
March 28, 2023 |
Alex Pasternack | Resilience
In recent months, Californians have endured a relentless barrage of atmospheric river systems, the massive volumes of water vapor that snake across the Pacific and unleash copious precipitation when they reach land. Tropical Storm Hilary drenched areas of Los Angeles with as much as six inches of rain in late August 2023. Street flooding occurred in downtown, and there were numerous road washouts in the surrounding mountains. The deluge has boosted historically low water levels, ending the state’s severe drought. But the flooding and landslides the systems bring severely test infrastructure and endanger lives and livelihoods, illustrating the many ways climate change increases risk to communities around the world.
California’s “weather whiplash,” the rapid swings between dry and wet spells, is also worsening. Cities like New York and Miami face risks from coastal and urban flooding, but cities in California have compounding risks. They face increasing flood risks while also managing drought and wildfires.
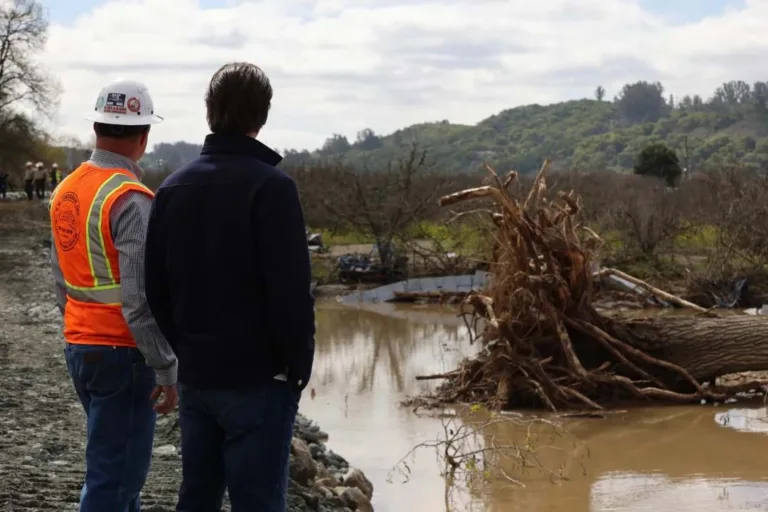
“You look back at the last few years in this state — it’s been fire to ice, and no warm bath in between,” Governor Gavin Newsom said during a news briefing on March 15, 2023 in Pajaro, the Monterey County town flooded by a levee breach. The flooding displaced hundreds of people in the primarily migrant town and raised concerns about crop yields in the agricultural region.
“If anyone has any doubt about Mother Nature and her fury—if anyone has any doubt about what this is all about in terms of what’s happening to the climate and the changes that we’re experiencing—come to the state of California,” he said.
In California, as elsewhere, the challenge is compounded by a basic problem: inadequate understanding of flood risk.
One recent study of flood exposure in Los Angeles suggests that the population exposed to dangerous flooding, or a flooding event with 1 percent annual probability, is between 10 and 40 times greater than US government maps show.
The study, published in November in Nature Sustainability, estimates that 425,000 people and $36 billion of assets would be exposed to dangerous floods rising to a height over 30 cm within the 100-year flood zone. The study also shows that the current 1 percent annual probability flood cannot be contained by existing flood infrastructure like levees.
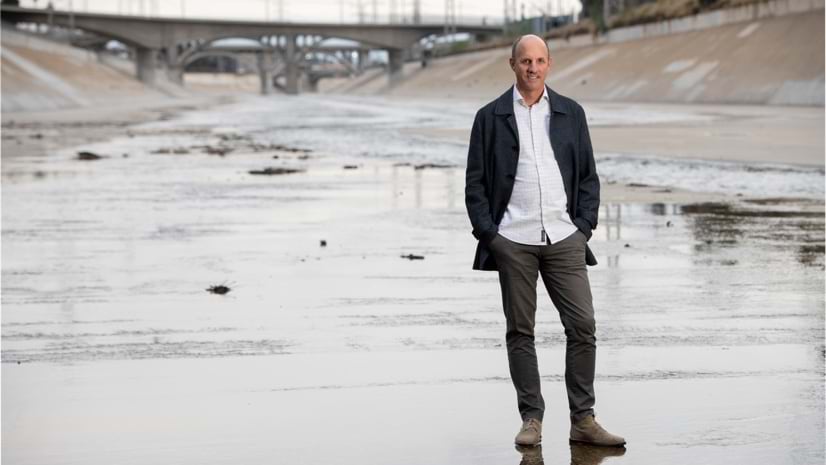
The numbers of at-risk Angelenos surprised even the researchers. “We double- and triple-checked our models and tried to figure out, Did we make a mistake?” said Brett Sanders, director of the Flood Lab at the University of California, Irvine.
To make their estimates, Sanders and his colleagues used an innovative geospatial modeling approach specifically designed for high-performance computing, allowing them to achieve an unprecedented level of mapping detail.
Initially, the researchers set out to learn which Angelenos face the biggest flood risks by combining new hazard maps with census data.
As they expected, they found an inequality along socioeconomic lines, with the more disadvantaged half of the population shouldering 65 percent of the composite flood hazard.
But the strongest disparity they found was racial. While non-Hispanic white communities were disproportionately likely to suffer coastal flooding, Black, Hispanic, and Asian residents were 79 percent, 17 percent and 11 percent more likely than white populations, respectively, to be exposed to dangerous flooding, particularly from river floods.
The racial and economic disparities, previously unacknowledged in federal flood risk maps, are exacerbated by the fact that disadvantaged communities tend to receive less government support for flood risk reduction and disaster recovery compared to more affluent communities.

Left unaddressed, these risks only grow, leaving communities not only unprepared but less capable of bouncing back after a storm, says Sanders. The six most expensive natural disasters in the world in modern history were all the result of tropical storms like Hurricane Katrina.
And years later, some communities are still recovering from previous disasters even as they try to prepare for future storms.
“New Orleans tells the story of cities that don’t recover, neighborhoods that are forever changed after the flood, that don’t bounce back,” Sanders says.
In the US, the National Flood Insurance Program (NFIP) is designed to assist owners of property within the 100-year flood zone in rebuilding after a damaging flood. But the maps that the Federal Emergency Management Agency (FEMA) uses for the program—and that many rely on to determine risks—aren’t required to include rainfall hazards, or the often-immense impervious surfaces of cities where rainfall runoff can’t be contained by street gutters.
The FEMA maps also rely on hydrologic and hydraulic modeling (of flood peaks and channel capacity) that is often decades out of date, and out of step with dramatic changes to population and the urban landscape.
While the maps cover coastal and river flooding, Sanders said, “they don’t ask, ‘Well, if it rains really hard and the water hits the ground and runs into the streets and it can’t drain fast enough, where’s it going to pond, and who’s it going to flood?’”
Even alternative efforts meant to improve on FEMA’s maps don’t properly estimate urban flood risks, says Sanders. Large-scale flood risk models used in nationwide studies offer relatively low accuracy in urban areas, since they typically lack data about urban drainage infrastructure and the condition of flood channels, levees, and dams. They also rely on geographic and computational grids that are too coarse to depict the complexities of flooding as runoff spreads across city landscapes.

For their study of Los Angeles, Sanders and colleagues built a numerical model capable of simulating flooding at a spatial resolution of three meters across the nearly 7,000 square kilometer area of greater Los Angeles. “Existing models for doing accurate local inundation mapping in the past haven’t let modelers study a region the size of Los Angeles County at once at this resolution,” he says.
They began building their map with topographic data and digital elevation models (DEM), based on aerial lidar or photogrammetric surveys. “It’s fine enough that we can resolve a road and how low the road is and how much water might run down a road.”
Still, the surface data misses all the complexity underground, like pipes and culverts. Sanders and his colleagues turn to local governments for ancillary datasets, like shapefiles for stormwater infrastructure and path lines for pipes.
From there, they “hydrocondition” the data to represent the functional effects of the infrastructure on the map and simulate different kinds of floods.
Running these simulations demands the supercomputing powers of parallel servers, but this introduces its own bottlenecks. So the researchers developed a more efficient flood inundation model, the Parallel Raster Inundation Model, or PRIMo. Designed specifically for whole-city-scale hazard modeling, the model uses a new way to represent infrastructure, says Sanders, and “strikes a balance between the amount of detail you put into the model and your ability to model a large area.”
Sanders and his team also held workshops with city agencies, environmental groups, and some of the community groups most likely to be impacted to hear Angelenos’ biggest flood concerns, from sea level rise to levee failures to heavy rain. Using Esri’s ArcGIS and StoryMaps, developed by Jochen Schubert at the UCI Flood Lab, they shared data with stakeholders to get early input into the flood model. Sanders thinks the process can help deepen understanding and trust.
“We know from experience that getting stakeholders involved early in a process is really important, so that when results are finally finalized, there’s more buy-in that this model has some validity and it’s sharing something that makes sense and is actionable,” Sanders said.
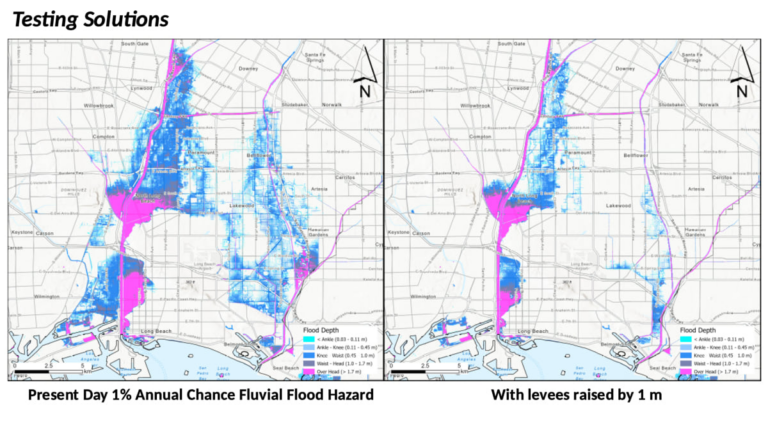
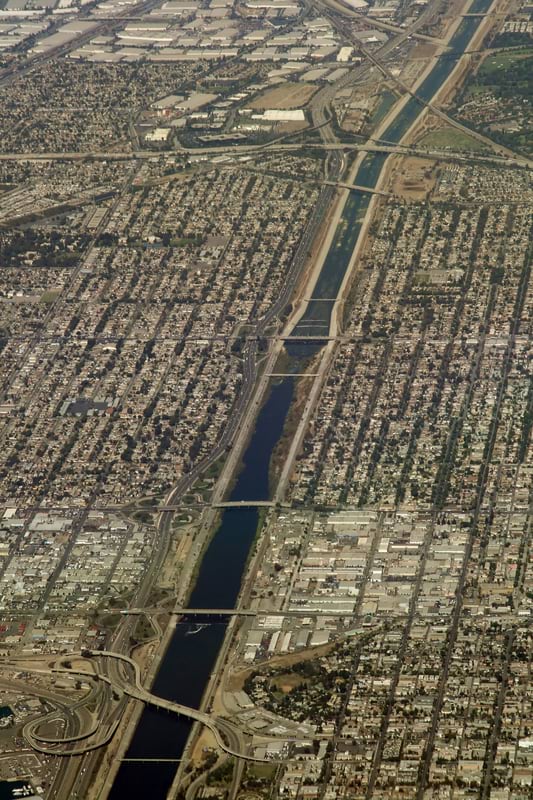
The new maps are now helping improve flood understanding in vulnerable areas, like along the LA River, and sparking fresh discussions about adaptation. The system can be updated to account for possible infrastructure projects, like new levees, channel widening, green infrastructure and even changes to land-use and building codes.
“We can run different scenarios like, Well, what if we widen the river? What if we raise levies? What if we invest in parks and green spaces? … Can we slow down the water before it gets to the river and capture it and store it? I think a lot of people would like to do that.”
Next, Sanders and his team want their model to be used by other US cities where flood risk remains undermapped, harnessing the power of big data, machine learning, and new aerial sensors. Better flood risk maps can help identify projects that will address inequities while reducing risks for everyone, while possibly addressing other risks too. One example: Governor Newsom’s recent order to use flood waters to fill aquifers, to battle the state’s ongoing drought.
For climate adaptations, says Sanders, “you want to have something that’s good for water conservation and good for ecosystems and good for flood risk management and good for social equity.”

The federal government has also emphasized the need for better, more public climate risk mapping, especially as it prepares to distribute historic sums for local infrastructure projects. The Climate Mapping for Resilience and Adaptation (CMRA) tool uses maps and data from over a dozen federal agencies to help communities better understand their risks and seek resources accordingly. Sanders hopes his team’s approach will eventually inform tools like this too, for instance, by helping FEMA improve its flood risk models.
Already, the maps are leaving their mark on Los Angeles. Following the study’s publication, the County Board of Supervisors passed a motion directing the city’s public works department to develop a plan to address flood risks and inequities, while improving the city’s water conservation and drought measures.
It’s an “impact that you could only dream of,” says Sanders, “seeing your work immediately register with leaders who say we need to act on this problem.”
Learn how GIS helps communities respond to flooding.