September 16, 2022 |
Patricia Cummens | Resilience
New Yorkers are tough, but they’re no match for an ever-weirder, ever-fiercer climate. It took only 48 hours for Hurricane Sandy to overwhelm coastal neighborhoods, killing 44 people, damaging, or destroying 70,000 housing units, and leaving behind $19 billion in damages. The ferocious remnants of Hurricane Ida dropped more than three inches of rain in an hour, submerging streets and subways, and killing 11 people in flooded basement apartments.
These impacts underscore the growing threat climate change poses to cities like New York, especially to their most vulnerable residents.
In the US, 90 percent of natural disasters involve a flood, according to the Federal Emergency Management Agency (FEMA), making flooding the most frequent and the most expensive natural disaster in the country. Estimates suggest that by the 2050s, sea level rise and inland floods could impact 1 of every 10 people on earth and cost cities over $1 trillion.
Now, as the US federal government embarks on a historic nationwide infrastructure buildout, researchers, nonprofit organizations, and geographic information system (GIS) specialists are harnessing new technology to improve understanding of where flooding is likely and to better rank investments in resiliency. These include advances in real-time flood sensor systems, sophisticated hydrological models, and high-resolution satellite monitoring.
In New York City, officials are preparing a decades-in-the-making revision to federal flood maps that will, for the first time, include projections that show how climate change will impact the city’s neighborhoods.
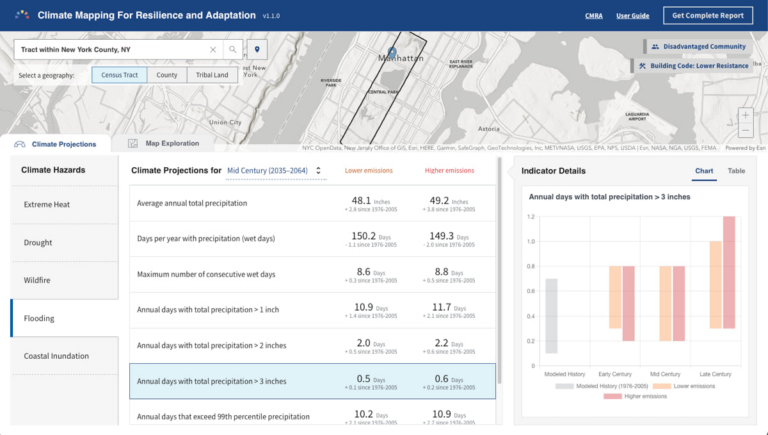
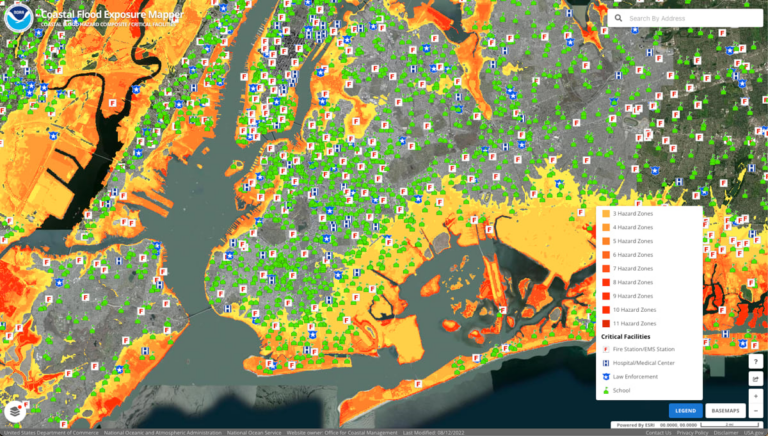
Communities across the US need better risk mapping. The White House recognized this need and created the Climate Mapping for Resilience and Adaptation tool in 2022 to surface projected exposure to climate hazards. Similarly, the National Oceanic and Atmospheric Administration (NOAA) created the Digital Coast Mapper to aggregate a range of data—on coastal flooding, storm surge, and long-range inundation impacts—using a method of visualizing climate risk that was initially developed for New York in the wake of Hurricane Sandy.
Anywhere along the New York waterfront ranks high for flood risk, and nearly 1.5 million New Yorkers live in the federally designated 100-year floodplain, threatened by once-in-a-hundred-year extreme storms. Maintained by FEMA as part of the National Flood Insurance Program, floodplain maps are meant to define mortgage risks, set insurance rates, and establish building and land-use regulations. But in New York and elsewhere, the actual risks of floods and storms reach farther than most people tend to think, and farther than the prevailing federal flood maps have described.
The old floodplain maps don’t account for sea level rise, rainfall, or riverine flooding, and they can be hampered by outdated data and models. They can also create a false sense of security, by focusing on whether a property is inside or outside of a floodplain, without addressing risk to individual properties. And FEMA hasn’t significantly updated many of its maps for decades.
In a study published last month in the journal Nature Climate Change, researchers found that on federal maps, the underestimations of flood risks missed about 8 million homes and overvalued the housing market by about $200 billion. The analysis, by researchers from the Environmental Defense Fund and the nonprofit organizations Resources for the Future and the First Street Foundation, found that many overvalued properties are concentrated in coastal counties with no flood-risk disclosure laws and where there is less concern about climate change. The unpriced flood risks endanger the stability of the housing market, local governments, and homeowners, particularly in low-income areas.
In cities like New York, billions of dollars in property values and government revenue are at stake, to say nothing of lives and livelihoods. By the year 2050, according to a recent report by the city’s comptroller, rising tides and more frequent storms will put significant essential infrastructure and properties amounting to upwards of $242 billion in current market value at risk of coastal flooding.
The consequences of geospatial data gaps can be devastating. When Hurricane Harvey dumped up to 47 inches of rain in Harris County, Texas, in 2017, over two-thirds of the homes that flooded were outside FEMA’s Special Flood Hazard Area, which designates areas where flood insurance coverage is mandatory. This means that most of those homeowners were uninsured or heavily underinsured.
New maps, expected this year, will likely show Harris County’s 100-year floodplain growing from around 150,000 acres to 200,000 acres. The maps, built in consultation with the county, will be FEMA’s first to depict urban flooding and will incorporate new rainfall estimates from the NOAA, data that had not been updated since the 1960s.
Still, while the analysis includes data up to 2017, it will not consider projections for how climate change will impact future storms.
“One of the fatal flaws of FEMA flood maps is that they are largely backward-looking,” Rob Moore, director of the Natural Resources Defense Council’s water and climate team, told the Houston Chronicle last month. “The only place I’m aware of where they’re attempting to include future conditions in flood maps is New York City.”
When Hurricane Sandy devastated parts of New York in 2012, city residents were relying on FEMA flood-risk maps that hadn’t been significantly updated since 1983. In 2016, after a city review found errors with FEMA’s maps, the agency and the city agreed to work on a new map.
The new FEMA flood-risk map will factor future flood risk, based in part on maps made by the city’s panel on climate change that use a projection of 30 inches of sea level rise by 2050.
According to a separate analysis by First Street, New Yorkers can expect a 20 percent increase in flood risk by the year 2050, impacting thousands of residents currently unaddressed in the federal data. A recent report by the city’s comptroller found that by then, rising tides and more frequent storms will put upwards of $242 billion in property value at risk of coastal flooding, a 38 percent increase from today.

The new maps from the city and FEMA will emerge sometime this year and next year, respectively. When they do, they’ll still face challenges.
The city anticipates thousands more residents will be required to pay for flood insurance, a burden many will undoubtedly struggle to meet. Updates to the city’s building code will likely increase costs for developers in flood-prone areas. And many New Yorkers may not see the maps: A state law, which passed last year, finally mandates that landlords warn renters about flood risk before they put down a deposit, but the law doesn’t extend the same protection to buyers.
In the meantime, ahead of the new maps becoming available, the city has been finding other ways to fill in the public’s understanding of flood risk. The Department of City Planning made an interactive map that lets residents see current flood hazards as well as how they are likely to increase with climate change. And last year the mayor’s office released a map New Yorkers can use to check their future risk from flash floods during a moderate event (a storm with two inches of rain in an hour) as well as during an extreme stormwater flood, given expected rises in sea level by 2050 (2.5 feet) and 2080 (4.8 feet).

NYC is already using its new flood risk projections for its climate resilience design guidelines, which inform development as well as the planning of infrastructure projects aimed at reducing the impacts of climate-related hazards. To help residents and officials track the progress of the mitigation projects, the city’s Office of Emergency Management is mapping them. And the Department of Environmental Protection built an ArcGIS StoryMaps story to illustrate the city’s stormwater resiliency plan, which involves, finding ways to make the Big Apple more “spongy.”
Geospatial analysis is also guiding the biggest mitigation project of all.
Last year, the US Army Corps of Engineers unveiled a proposal to build movable sea gates —designed to protect against once-in-a-hundred-year storms—across the mouths of major bays and inlets along New York Harbor.
The plan—which also calls for more than 30 miles of land-based levees and sea walls and nature-based solutions like wetland restoration and shorelines built out of sand, oyster shells, and plants—is estimated to cost $52.6 billion. But a geospatial cost-benefit analysis—a central tool for the corps—showed that without the protections, average annual damages to the region would amount to $5.1 billion by 2030, and $13.7 billion by the end of the century. Conversely, the corps estimates its efforts would generate a net benefit of $3.7 billion each year over the next 50 years.
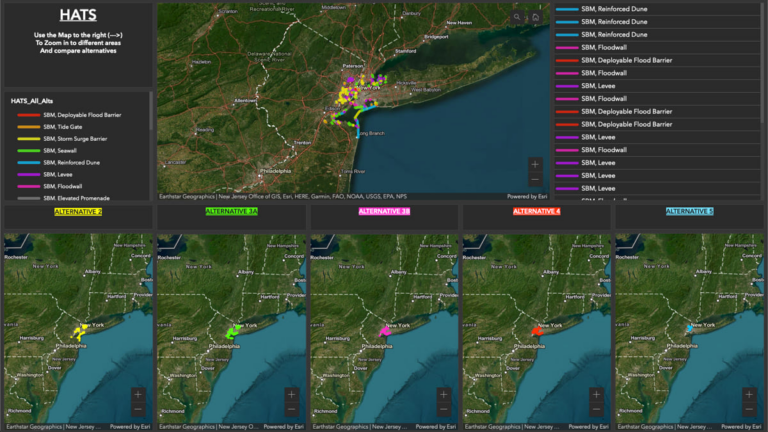
In meetings with community members and environmental groups, maps that show the benefits, drawbacks and uncertainties of the corps’ plan have been helping the corps incorporate public feedback into its analyses. Once the plans are finalized, and if Congress approves them, construction could begin in 2030 and end by 2044, with some projects completed sooner.
Even this may not be enough, according to some experts, who argue that the government will likely need to buy out and relocate residents in at-risk areas.
In light of rising seas, New York City should create a “predictable, community-informed buyout program” that prioritizes individuals in areas at the highest risk, says a report published in December by actuarial consultancy Milliman and the nonprofit Rebuild by Design.
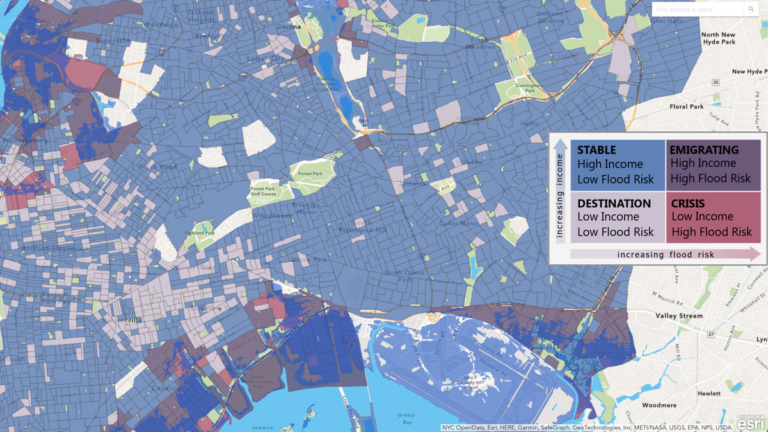
The report’s authors recommend that New York invest massively to protect shoreline communities and build affordable housing in inland neighborhoods, since the areas most vulnerable to floods are home to people of color in low-income communities.
“It is important to think about not only who is being impacted by climate change now, but who will be impacted as existing climate pressures worsen,” said Molly Barth, a GIS consultant at Milliman, in a statement. “Using geospatial and demographic data, municipalities can better understand the risk to local populations and use that data to make more informed community decisions.”
Learn more about how GIS supports all types of emergency and disaster management operations.