
February 14, 2018 | Multiple Authors |
April 18, 2018

The Library of Congress (LOC) in Washington, DC is the largest library in the world. Its mission is to serve the United States Congress, the federal government, and the American people. The library’s collection now boasts more than 167 million individual items. The staggering 838 miles of bookshelves contain books, printed materials, recordings, photographs, maps, sheet music, and manuscripts. Although 12,000 items are added daily, many of these national treasures will never be part of a physical exhibit.
As the library embraces the twenty-first century, leaders have set priorities to share more of their collections by using new technologies, systems, and online tools. Physical exhibits cost money, take time, and are available only to those who can visit the library. The library has empowered curators with digital tools to reach an increasingly connected global audience well beyond library walls.
Library leaders initiated a 12-week pilot program to test Esri Story Maps as a new method for curating collections. Story maps let users combine text, images, and multimedia content in an interactive application that tells stories through the power of geography, with the underpinning data and capabilities of geographic information system (GIS) technology. During the trial program, 10 employees from six library divisions used the online platform to create presentations that illuminate previously unseen collections. The curators chose compelling materials and readied their digital displays for the presentation of projects at LOC’s GIS Day celebration on November 15, 2017. Following are descriptions of four of these presentations, two of which LOC is scheduled to unveil to the public at a special event on May 2, 2018.
Southern Structures
“Surveying the South,” by Kristi Finefield of the Library of Congress’ Prints and Photographs Division, follows the journey of one of America’s first professional female photographers. Frances Benjamin Johnston created what is now known as the Carnegie Survey of the Architecture of the South. Johnston took 7,100 photos of 1,700 structures and sites in rural and urban areas of Virginia, Maryland, North Carolina, South Carolina, Georgia, Alabama, and Louisiana and made smaller forays into Florida, Mississippi, and West Virginia.
Finefield’s story map weaves together Johnston’s photographs and allows the reader to take a journey through the past. The photographs provide vivid portrayals of the exteriors and interiors of houses, churches, mansions, and other buildings.
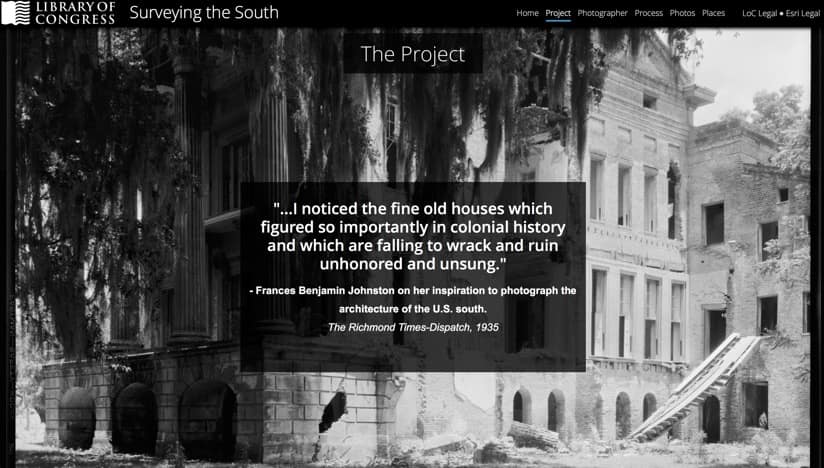
Finefield used Esri Story Maps to share Johnston’s work and show the splendor of what then was fading and now has largely disappeared. The story map displays her photographs side-by-side with Johnston’s hand-colored “glass lantern” slides, colored by hand with paint and brush before color film became available. The resultant display provides a rich visual tour of Johnston’s 150,000-mile journey.
These photographs have long been of interest to the bricklayers, carpenters, and architects charged with preserving the past. Now anyone can take a geographic look at the work of the country’s early artisan builders.
Freedom Rings
Guha Shankar, from the American Folklife Center (AFC) at the Library of Congress, curated a story map entitled “Freedom – The African-American Struggle for Rights and Justice in Words and Images.” The project draws attention to key moments and themes in the modern civil rights movement by combining many media types.
Shankar included LOC’s recordings of civil rights figures in his story map, giving their words greater context by pairing recordings with relevant graphic and pictorial materials. He also featured specific sections of each recording, using the ability of story maps to dictate the frame start and stop points of longer media files. This distills long and complex recordings into accessible pieces, while preserving the listener’s ability to hear the full recording if they choose.
In Shankar’s view, combining audio and images had two positive outcomes. The variety of media types added historical depth with enriched context and texture, and procuring those materials encouraged collaboration between other departments of the library.
“Items from across the library can be brought together and we can show the relationship between them in a very real sense,” Shankar said. “It brings home the relatedness of all those materials across different domains and different collecting divisions.”
Collection Communication
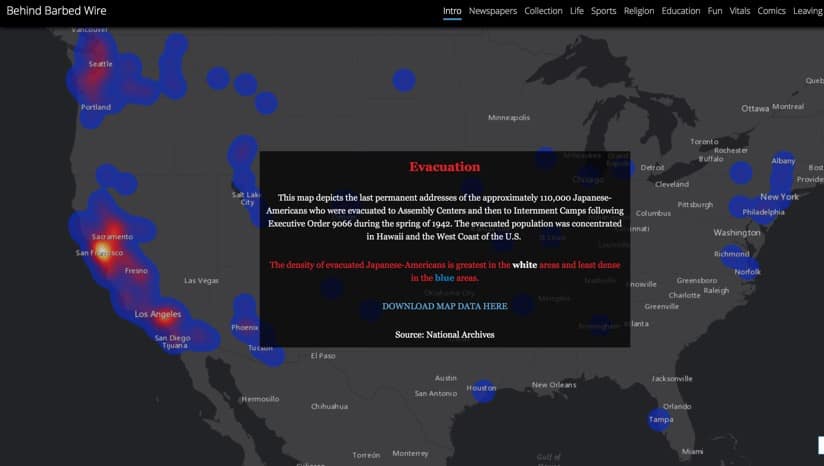
Todd Harvey took a different approach with his presentation, “What’s Cooking? American Folklife Center: Fiscal Year 2017 Acquisitions.” This story map communicates the mandated priorities for new acquisitions to the AFC and is meant for internal rather than external communication. It documents the items acquired and suggests how LOC staff can use them.
A map illustrates the geographical diversity of the 250,000 new items acquired by the AFC in 2017. These items came from every US state as well as 18 other nations. The map functions as a visual representation of how the team has met department goals. Diversity can be a difficult concept to prove, but revealing the new item’s original locations on a map instantly conveys diversity by adding clear geographic context.
“Just as in previous years, we have contributed to the library’s diversity in terms of geographic spread and linguistics in cultures,” Harvey said. “The map here shows you all of the locations from which the Folklife Center acquired materials and then displays the collections.”
Precious Printing
Stephanie Stillo, curator of the Lessing J. Rosenwald graphic arts collection in the Rare Books Division at the Library of Congress, shared “Incunabula: The Art and History of Printing in Western Europe, c. 1450-1500.” Incunabula is the word used to describe early printed books, pamphlets or broadsides printed in Europe before the year 1501.
“The history of printing is truly remarkable,” Stillo said. “It begins with [Johannes]Gutenberg printing a Bible on this converted winepress in the 1450s and it ends 50 years later with 20 million books circulating throughout Europe.”
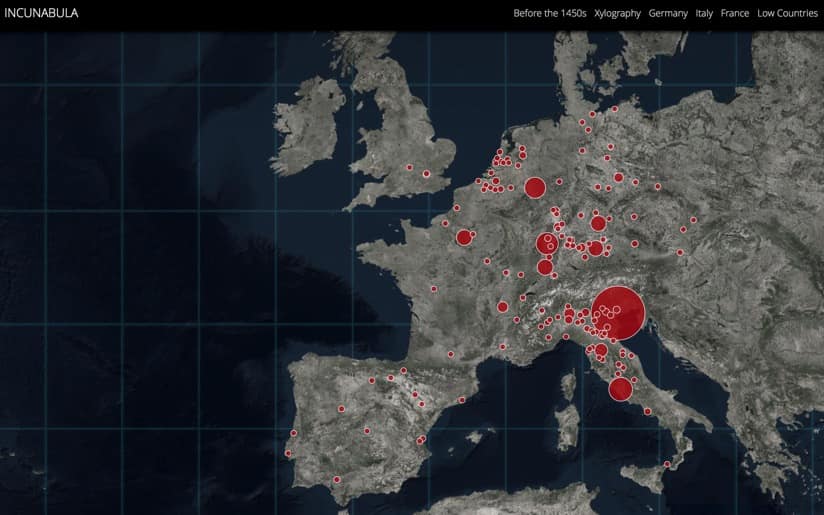
Today, the Rare Books Division possesses the largest collection of rare books in North America. To showcase part of that collection, Stillo used more than 5,000 data points to identify each item’s origin. The resulting map of Europe clarifies the geographical sweep of book production. The map also draws attention to localized gaps in the LOC’s collection. The division can use this information to help inform future collection strategies.
Stillo took her story map project beyond mapping by including colorful imagery from some of these books. She also used close-up images to simulate the experience of examining a 500-year-old book in person. In her view, telling the stories behind the imagery and printing techniques increases public interest.
“One of the most exciting parts of my story map is the ability to show people how books are made,” Stillo said. “The ability to show people how a book was colored and how it was bound really humanizes the fifteenth century, making it more understandable for people.”
Unlocking Understanding
Story maps provided new ways for the 10 curators to explore and share their collections. They each used the existing location data contained in their subject matter to better understand the collection and tease out new insights. The exercise shined a light on collections that otherwise might never have been seen. It also fostered connections between different divisions at LOC, as the diverse team of curators collaborated to enrich each other’s projects. Perhaps most importantly, the story maps created a means of sharing collections with anyone in the world who has an Internet connection.
“I was able to give a voice to a collection and make it my own,” said Francisco Macias, of the Law Library of Congress. “I think many of us who work in the library oftentimes think, ‘Why don’t they do an exhibition on this?’ This provides an opportunity to bring collections to life.”
Moving forward, the cloud-based Esri Story Maps platform will be available to all library staff, as well as the pilot project participants, who are eager to create more digital exhibits using story maps. In addition to the three already published, the library plans to share other story maps on its website.
“I find story maps to be a twenty-first-century tool for a twenty-first-century library,” Stillo said. “Story maps give us this fun and user-friendly way to mine deeper into our collections through mapping our data and through creative visualization. More and more people are reaching out to the library through our website, and I think it’s important that we’re reaching back to them with information that’s interactive, that’s engaging, and that has that stamp of authority from the Library of Congress.”
Learn more about getting started with Esri Story Maps and view more in the Esri Story Map gallery.

February 14, 2018 | Multiple Authors |

December 13, 2017 |

August 16, 2017 |