Students who embrace GIS learn a new way of problem solving and can parlay their knowledge into paying work.
Schools around the world are teaching with geographic information system (GIS) software, and students are reacting with enthusiasm.
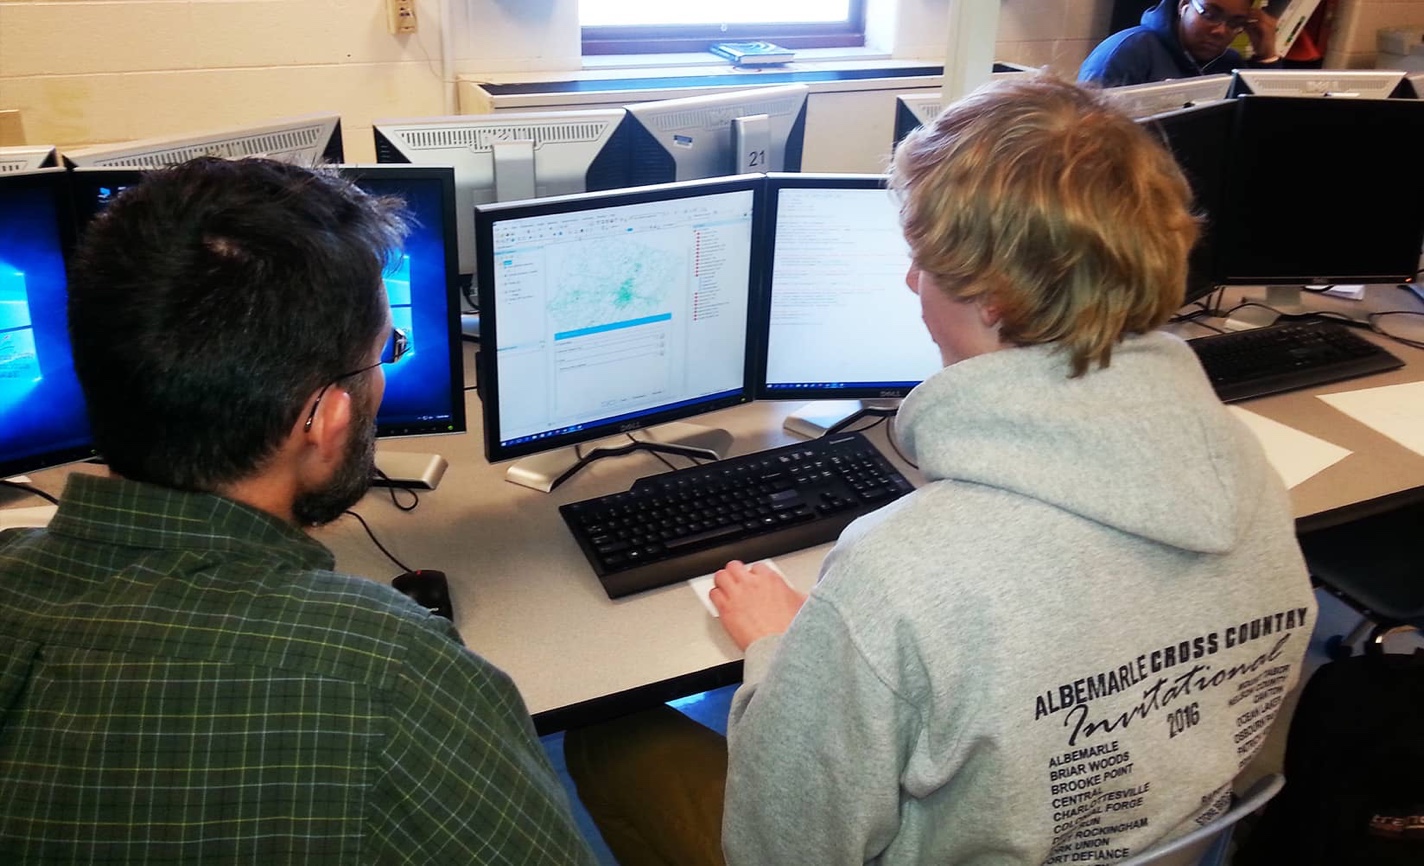
Chris Bunin’s GIS students at Albemarle High School in Charlottesville, Virginia, had a lot to say about how learning to map changed their thinking.
“You wouldn’t think that one software program can access and show so many different things,” says Taylor Holt. “It’s gained my attention completely, and I just want to do it all the time.”
“I don’t necessarily plan to go into GIS, but I’ve definitely developed a love for this class,” says Claire Mills. “People like to look at visual things instead of being told, and a map provides a picture that can be explored.”
“What I like about GIS is not the mapping part,” says Mary Davis; “[instead],” she added, “it’s the application to make other areas of study more efficient and successful.”
“I thought it was cool to not only make maps with GIS,” says Luke Symmes, “[but] you can also use it to create an app.”
“I like how you can take information in a raw form and make it more accessible,” says Chris Wildman. “I’ve enjoyed the class a lot, and now I think in my everyday life, ‘I can make a map out of that.'”
Students who embrace GIS learn a new way of problem solving and can parlay their knowledge into paying work.
New perspectives
GIS provides a map-based context in the classroom. It offers both a current and a historical perspective on our world, acting as an adjunct to textbooks. Students can explore at their own pace and drill down into maps to understand the context of coursework through the lens of geography.
“GIS is such a natural tool for my students, who are digital natives,” says Bunin, teacher of AP geography, world history, and geospatial technology at Albemarle High School. “The early challenge of GIS in K–12 education was that teachers were excited about the potential, but they didn’t have data and exercises they could use in the classroom. That’s all changed, and today’s interactive maps can really wow the kids.”
Students first get exposure to GIS in Bunin’s history and social studies classes. He has each student research the origin of ingredients from their favorite recipe. Using a crowdsourced map, he can display data from each student on a common map as the data is entered, tying it into lessons on cultural context.
“Many of the kids get excited and ask how it works, and that’s when I tell them to take my GIS class,” says Bunin.
Tool for discovery
GIS shines in project-based learning, where students have to create a question, go through steps to collect and analyze data, and then present their results.
The students enrolled in the GIS courses at Albemarle High School have the option for dual enrollment in the Geospatial Semester program offered by James Madison University (JMU) under the direction of Dr. Robert Kolvoord and Kathryn Keranen. These instructors are also the authors of the Making Spatial Decisions series of books and workbooks, published by Esri Press, that provide scenario-based lessons to help students develop GIS skills and critical thinking.
The program is a partnership between high schools in Virginia and JMU to offer college credit. It places an emphasis on local projects to connect students to technology and their community.
“The professors at JMU impress upon the kids the question, What can’t you study with GIS? If they’re interested in sports, they can map a basketball game. If they’re interested in dental hygiene, they could map decay on a tooth with an erosion analysis. The limitations they face are usually those that they place on themselves,” says Bunin.
With project-based learning, students pick a project that interests them, and it forms the basis for the entire curriculum.
“One of the challenges with letting them loose is they have to motivate themselves,” says Bunin. “Some are motivated and race out of the pen, and others hang back until they’re given more structure and guidance.”
Project-based learning requires shifting the typical rote-learning mind-set, but it more directly mirrors the typical work environment.
“One of the major advantages of project work is that it makes school more like real life,” writes Silvia Chard, professor emeritus of elementary education at the University of Alberta and coauthor of Engaging Children’s Minds: The Project Approach. “In real life, we don’t spend several hours at a time listening to authorities who know more than we do and who tell us exactly what to do and how to do it. We need to be able to ask questions, link what the person is telling us with what we already know, and say something about the topic ourselves.”

Skillful students
Geospatial technology was identified as a high growth industry by the United States Department of Labor in 2004. This initiative identified many different career paths and skill sets and pointed to a growth in jobs that require geospatial skills.
“I love the flexibility that the tool provides,” says Bunin. “Students may be interested in the environment, business, engineering, or public policy. They can explore natural phenomena, business processes, infrastructure, and electoral geography. Or they can have fun exploring topics of interest to their peers, like Davis, who mapped the locations on our campus with the best cell phone signals for each carrier, for those addicted to Snapchat.”
Esri has made a concerted effort to foster the use of GIS in the classroom with the company’s ongoing Schools Program, which offers free online mapping tools and activities to schools around the world. Students and teachers can use ArcGIS Online to explore and analyze data using maps.
Students who embrace GIS learn a new way of problem solving and can parlay their knowledge into paying work. Students from JMU’s Geospatial Semester program have gone right to summer internships, job assignments in the military, and college majors that feature GIS.
“We do talk in class about the money students can make using GIS,” says Bunin. “It’s a valuable skill. I enjoy having students who find a passion, and I encourage them, knowing that it can help pay their bills and accelerate their career.”
Sharing students’ work