Becoming an Antiracist City: Tacoma's Data-Driven Transformation
By Margot Bordne and Clinton Johnson
Tacoma mayor Victoria Woodards wants to make her city antiracist, a goal that’s now reflected in the Heal the Heart of Tacoma campaign. Many cities in the US face ongoing impacts of systemic racism, but not enough have examined the underlying issues. Tacoma’s program is moving forward with precision. The city first quantified the barriers people face and then mapped communities where disinvestment has led to lower quality of life.
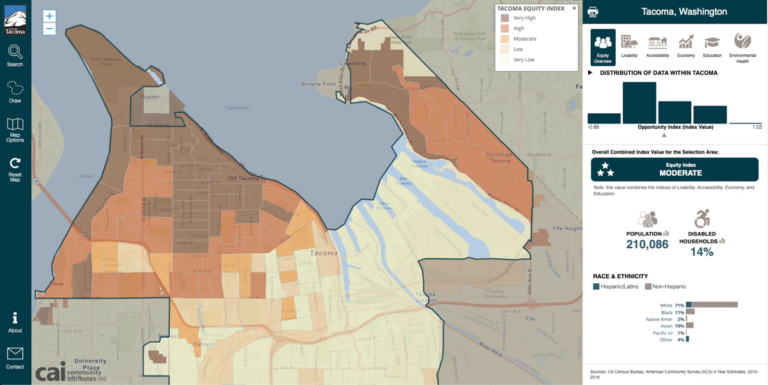
The Tacoma Equity Index measures entrenched economic problems, housing needs, and social justice issues. The tool examines five categories of inequity that include livability, education, environmental health, economic opportunity, and accessibility. These topics were analyzed with geographic information system (GIS) technology to show patterns and represent inequities on a map.
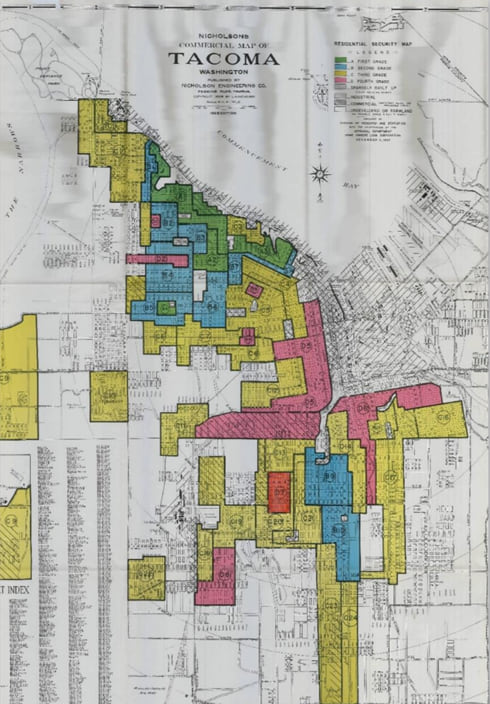
Tacoma is one of many cities in the US that still suffers from the 1930s policy of redlining, which assigned high loan risk to communities of color. This practice prevented two-thirds of Tacoma's residents from buying or building a home.
There are 29 key indicators within five determinant categories of livability, education, environmental health, economy, and accessibility. Indicators include such things as crime, home value, affordable housing, school quality, amount of green space, and access to recreation and transit.
The map and its underlying data give the city council guidance to see and repair the harm done by systemic racism.
When the city started to replace streetlights, for example, the equity index guided the public works department to see how specific neighborhoods that have lagged in repairs are experiencing more crime.
“They only have the budget to complete a certain number of streetlights every year,” Warren said. “By combining the equity index with data they already collect, they’ve reprioritized their list of work to consider past inequities as a factor of new investment. They’re targeting the areas of the city that have historically been disinvested in, where crashes or crime might be impacted by a lack of streetlights.”
Now, for all projects that go to council, equity analysis is required to show who is impacted and how equity is considered in implementation. The equity index gives us a story to tell why we've changed how we're doing things."
strategic initiative coordinator at the City of Tacoma
Bucoda Warren
Committed to Getting the Numbers Right
The group behind the equity index first focused on getting the facts right about the role of historical policies in shaping the city’s equity landscape. The foundational architect was then-senior policy analyst Alison Beason who sparked senior GIS analyst Adriana Abramovich’s passion for data-driven analysis of inequalities.
“We are a team, and each member has a different area of expertise,” Abramovich said. For instance, the 2020 equity index team had input from strategic manager Jacques Colon, strategic initiative coordinator Bucoda Warren, and IT GIS supervisor Christina Chelf. The new iteration of the 2022 equity index includes a core group that works in consultation with city departments and partner agencies.
While contemplating what Abramovich wanted to do for the next 25 years of her life—having had some success as an architect—she got a job at the Center for Urban Studies at University at Buffalo (UB). She worked under the direction of Henry Louis Taylor Jr., a scholar who focuses on a historical and contemporary analysis of distressed urban neighborhoods, and on race and inequity in American cities.
In Buffalo, Abramovich rekindled her passion for urban planning, she said, “fell in love with GIS.” After achieving a certification in GIS and then a master’s in urban design and planning from the University of Washington in Seattle, Abramovich knew her purpose was to use GIS to establish guidelines for the future growth of communities under the big umbrella of comprehensive planning. She worked for the City of Renton, Washington, supporting planners before joining the IT-GIS team in Tacoma, one of the most racially diverse cities in Washington State. Nearly 40 percent of people living in Tacoma are Latino, African American, Asian and Pacific Islander, Native American, or multiracial.
When Beason began asking about demographics in Tacoma and inequalities, it was Abramovich who helped the city discover the power of spatial analysis. Then Beason worked with the Kirwan Institute, which has a reputation for its equity index approach, to compile the 2018 equity index determinant categories, indicators, and data model.
Abramovich recently reflected on how her privileged upbringing in South America immediately made her starkly aware of what other families lacked. Yet it is not a guilty conscience that drives her.
I'm Jewish, so I set out to follow the concept of tikkun olam, which means 'repair the world,' and I'm going to examine equity to improve people's quality of life.
senior GIS analyst, City of Tacoma
Adriana Abramovich
Applying Equity to a Housing Crisis
From 2010 to 2019, the region around Tacoma has added three new residents for every housing unit. With the growing demand, rents have gone up, which has the largest impact on lower-income and historically marginalized communities.
The Home in Tacoma project used the equity index to show how historic housing policies disproportionately impacted people of color. The data led Tacoma to prioritize creating housing in higher-opportunity areas and avoid gentrifying racially diverse areas of the city.
Phase one of the Home in Tacoma project adopted low-scale and mid-scale residential land uses that allow a range of multiunit clustered housing options, also known as “missing middle” housing. Phase two is getting started, and it includes community outreach, new policies through zoning, affordability, antidisplacement steps, and actions to support housing growth. Abramovich will be working with planners on the zoning changes.
Another tool to increase the construction of affordable units is the Multifamily Property Tax Exemption Program, which encourages the development of affordable units with tax incentives. For example, suppose a builder pledges to make 20 percent of the units affordable at 70 percent of Pierce County’s average median income. In that case, the qualifying project with a minimum of four new units would be exempt from property taxes for 12 years.
With guidance from the Home in Tacoma policies and the equity index, Tacoma is planning for 60,000 new housing units by 2040. That growth is intended to be in the downtown area, and mixed-use centers, as well as along corridors in the city where growth has accelerated the most and where there are conveniences such as walkability and access to wholesome food and parks.
These decisions and policy changes will impact people’s lives. “Increasing affordable housing choices in high-opportunity areas strengthens success in life through a better education, access to health care, and other services; likewise, directing capital investment into low-opportunity areas aims to increase opportunities,” Abramovich said.
Engaging and Persuading Peers and Residents
Since 2018, the equity index team has steadily refined the tool’s accuracy. In addition, city staff members have been explaining and promoting the index’s power to other departments inside the city government as well as agencies and nonprofit organizations outside city hall.
Other projects and initiatives that have been guided by the index include COVID-19 relief funds; transit routes; and the extension of tree canopy to all neighborhoods to address extreme summer heat.
In addition to undertaking an education effort about the equity index within the city government, Abramovich and others have encouraged businesses, nonprofits, and residents to use the interactive tool to better understand the city’s issues and how they might influence business and personal decisions.
...
...
...
In 2021, a local television station even promoted an information and training session offered by the city to teach residents how to use the equity index. In addition, the city lists a variety of topics that the equity index may clarify for members of the public, including how the city schedules repairs, conducts maintenance, and distributes grants and loans to applicants.
The Tacoma Equity Index has a growing reputation for reliability of data and the power to show the distribution of disparity through maps. Race Forward’s Government Alliance on Race and Equity (GARE), a network of more than 400 governments, came together with Esri to create a Social Equity Analysis solution modeled in part on Tacoma’s Equity Index work. The equity index work has been presented at regional and national conferences, shared with regional agencies, and drawn the interest of the New England Statistical Society and the Biden administration.
“To know that the White House staff saw our presentation, and receiving questions from them about the tool was an amazing experience,” Abramovich said. “The origins of the urban crisis are tied to race, class, and gender. And now we have a tool to assess where help is needed and improve people’s quality of life. I’m repairing the world based on data, and that is a dream come true for me.”
Equity & Social Justiceaffordable housingequityspatial analyticsstreetlights
Margot Bordne
Margot Bordne is an account manager on Esri's Global Business Development team. Margot supports organizations across industries who leverage GIS to improve their operations and decision making capabilities, with a focus on the use of GIS for advancing equity and social justice. Margot also founded and leads Esri's Women's Enablement & Career Advancement Network (WeCan) and is currently working toward a Master's Degree in Diversity & Inclusion Leadership at Tufts University.
Clinton Johnson
Clinton Johnson, Esri's first Racial Equity and Social Justice Lead, is the founder and leader of NorthStar of GIS, a community organization focusing on racial justice and advancing equity and belonging for people of African descent in GIS and geography. Johnson is now an independent contractor at Esri. A National Geographic Explorer who received a 2023 Wayfinder Award, he's now working on Empathy Atlas, using geography to tell stories about the Underground Railroad. Prior to his work at Esri, Johnson worked for the city of Philadelphia for 17 years. He spent four years as Deputy Chief Information Officer and Chief Enterprise Architect.