The CEO of a major tech company announces a sweeping social justice plan—but needs a system to enact the blueprint and track its results.
A Fortune 500 furniture and appliance retailer seeks to create pay equity across its workforce, but can’t manage the effort without a platform to analyze geographic data on cost-of-living metrics, demographics, and income.
An influential Wall Street bank launches an expansive program to invest in BIPOC (Black, Indigenous, and people of color) communities, but the head of corporate social responsibility (CSR) needs a way to share the impacts with internal stakeholders and the public.
These examples are drawn from three real-life companies whose leaders are looking to practice racial equity—and discovering the importance of a geographic approach to that work.
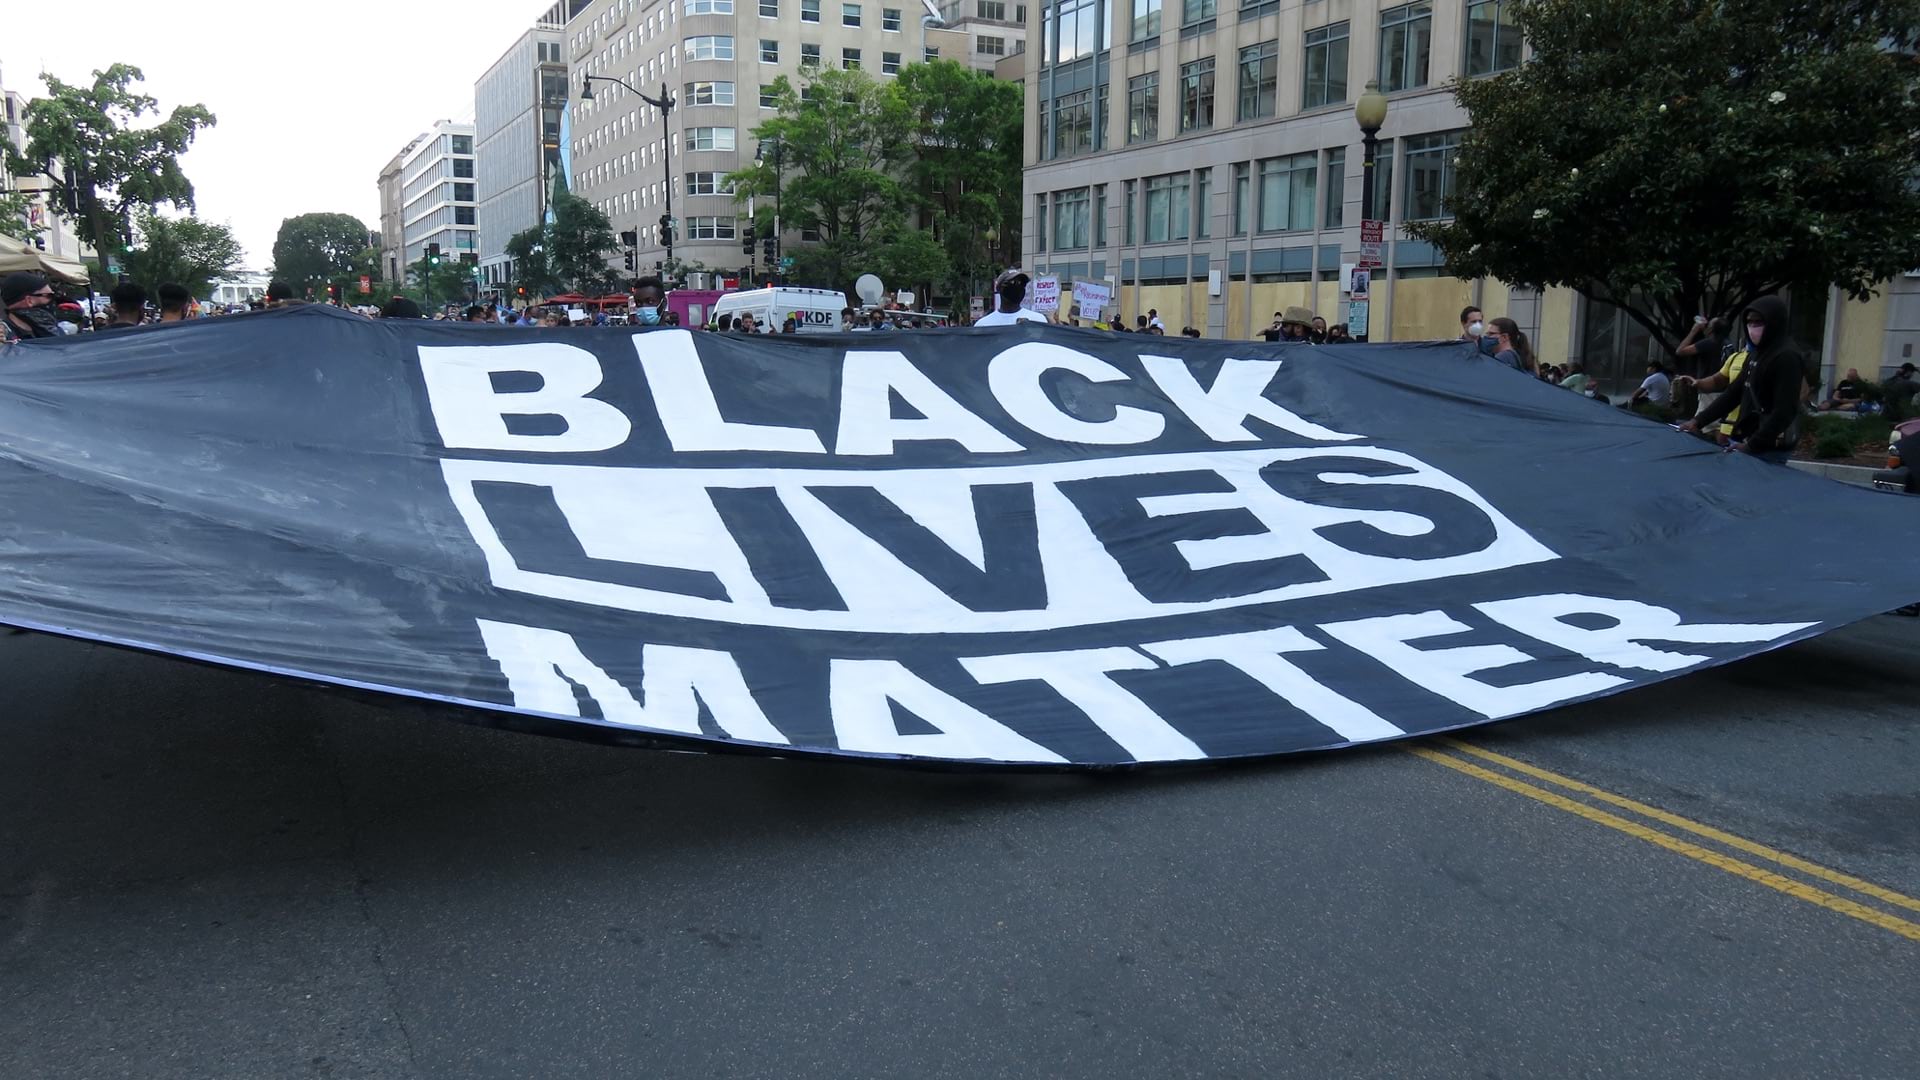
In the wake of George Floyd’s murder in May 2020 and the subsequent national reckoning on race, businesses responded with vows to support marginalized communities and make American workplaces more diverse, equitable, and inclusive. According to an analysis by The Washington Post, the 50 largest US companies have pledged nearly $50 billion to racial injustice initiatives since Floyd’s death.
Now, business leaders are using data analysis to understand the dynamics of the problem, operationalize plans, and effectively practice racial equity. In place of press releases and pronouncements, CEOs need dashboards, maps, budgets, and detailed quarterly reports to deliver on their promises. Many are turning to the analytic capabilities of a geographic information system (GIS) to transform data into insight, and insight into action.
A Moment of Accountability for Companies Practicing Racial Equity
In this moment of corporate accountability on social justice, a geographic approach is key to successful racial equity programs. Smart maps bring immediate context to people and places, while tracking the performance of programs over time.
Companies can identify neglected customer bases by mapping gender and race data in locations the company does and does not serve. Dashboards can help utilities and energy providers monitor the environmental impacts of pollution or carbon footprints on BIPOC neighborhoods, which often suffer the worst consequences of climate change.
Real estate departments can add equity-focused data to maps that decision-makers use when siting stores. That might help an executive determine whether a new bank branch or coffee shop will increase or decrease economic opportunities for communities of color, and identify whether equitable transportation infrastructure exists nearby.
To practice racial equity in the workforce, HR executives might expand the regions where they hire—by recruiting tech talent from places such as Atlanta, for instance, where a density of Black tech workers reside.
On a data-rich map, COOs can see the regions where their business operates and identify nonprofits, schools, and other institutions that are dedicated to equity work with whom they can partner. That might lead to a tech company collaborating with a historically Black university to create a pipeline for employment, and monitoring data to measure impact.
GIS and a geographic approach can be powerful tools for catalyzing change because racial bias is often etched into the places where we live and work. Redlining policies cut BIPOC communities out of homeownership and other opportunities to build wealth, while exclusionary zoning regulations can trap Black families in low-income neighborhoods. Location intelligence helps illuminate where these inequalities exist and charts a path for companies to improve conditions wherever their spheres of influence extend.
Practicing Racial Equity in Three Stages
The real-life stories of the businesses mentioned at the outset of this article help clarify how location intelligence informs diversity, equity, and inclusion (DEI) workflows. Three main stages in this process—mapping and analyzing racial inequity, operationalizing racial justice, and managing performance—emerged from the experience of business leaders who are using GIS to guide social justice efforts.
For organizations just starting the journey, mapping and analyzing racial inequity often make up the first stage. It involves gathering and contextualizing geographic data to pinpoint company facilities, supply chains, customers, employees, and other assets in relation to inequities. The unified map helps decision-makers identify the greatest needs and set priorities.
In the next stage—operationalizing racial justice—companies assess how they can practice racial equity in day-to-day operations and workflows. This requires a mixture of data analysis and community outreach to ensure that activities are well tuned to each city, town, or neighborhood.
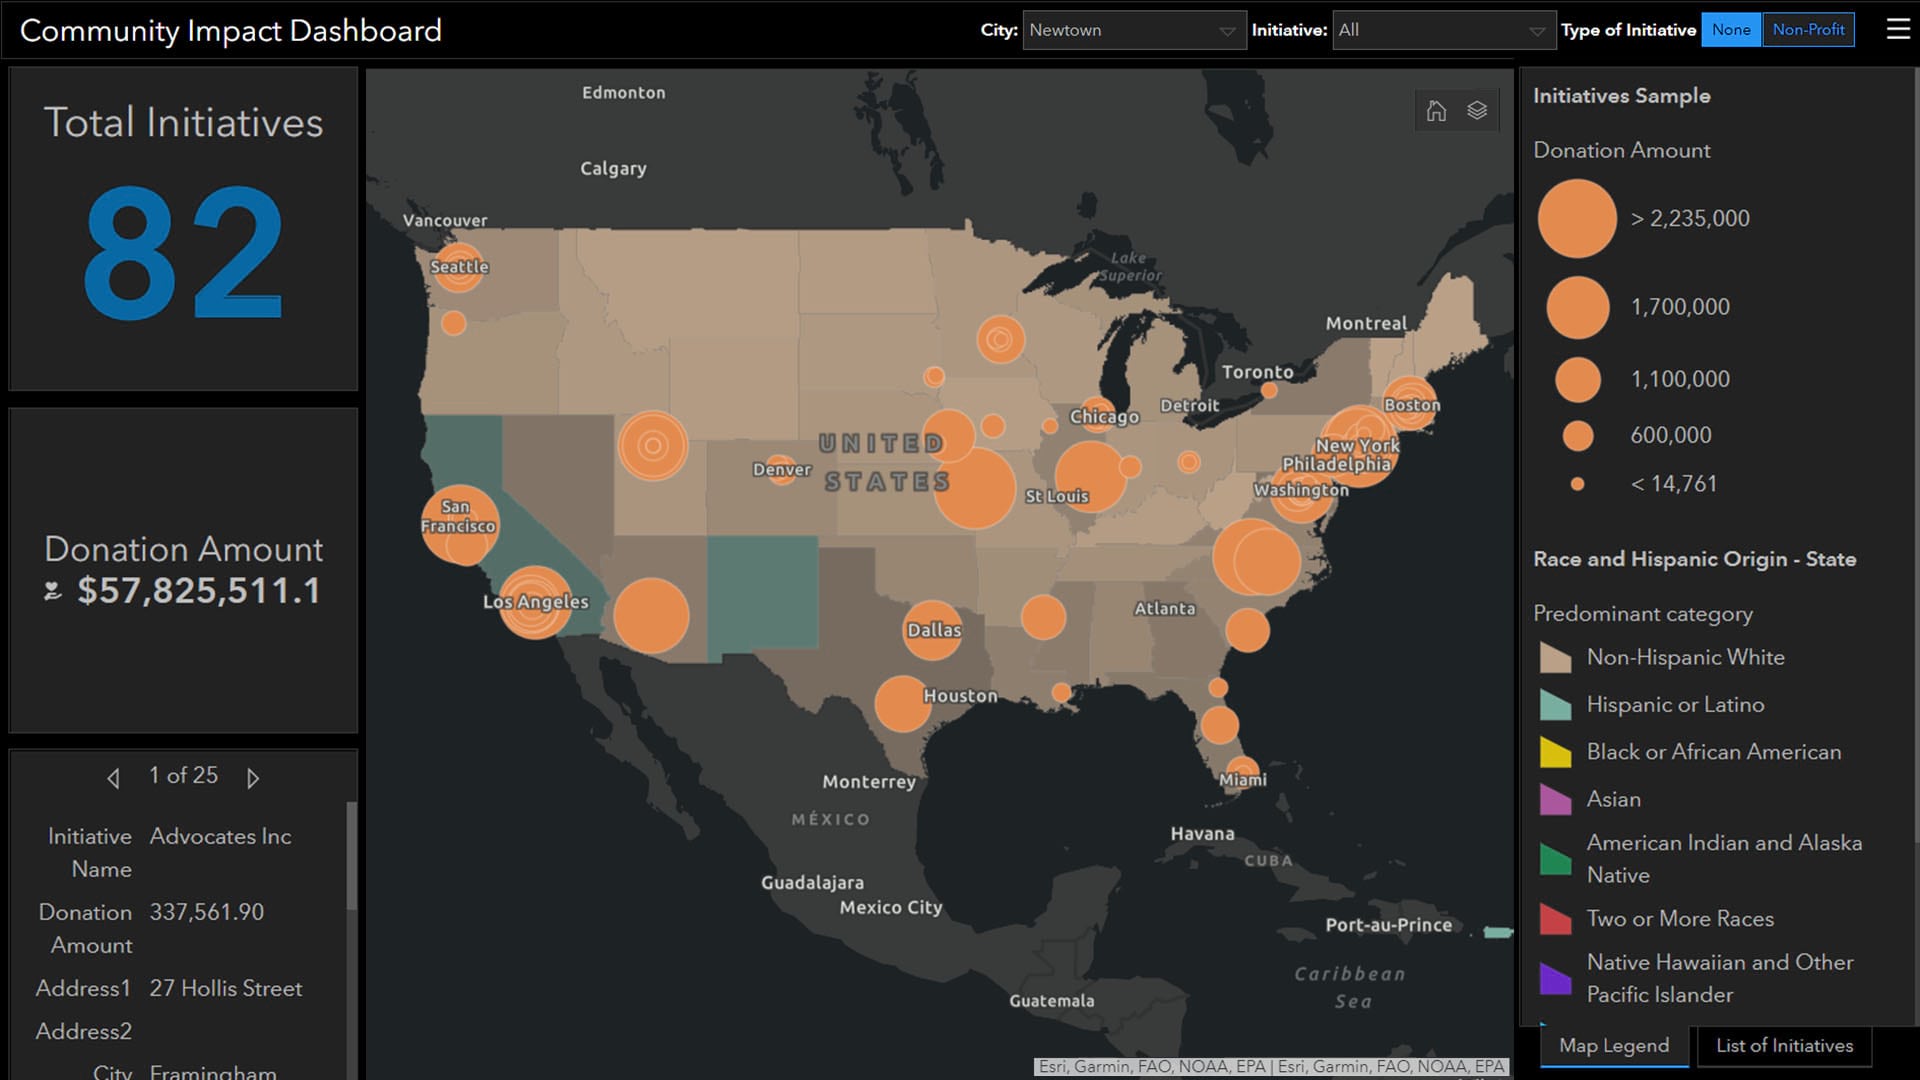
The third stage, managing performance, is when managers and leaders use GIS-powered tools like dashboards to follow the data showing which initiatives are successful and which aren’t, and to decipher reasons for the outcomes. This step also includes sharing maps and performance dashboards to update internal and external stakeholders on progress.
A recent survey of US employees shows how important this last element can be. Almost 50 percent of employees in a Benevity poll recalled their companies making social justice commitments, but 61 percent couldn’t say whether those commitments had been fulfilled, and only about a quarter were confident they had been.
Accordingly, managing performance often leads back to the first step of mapping and analyzing, as companies continually adjust their efforts to achieve better outcomes.
Work in Progress
The Midwestern tech company focused on computer data storage had strong leadership on equity-related issues from the company’s CEO. He had in mind a major social justice initiative that would encompass issues including environmental justice, the digital divide, and workforce development.
Because the scale of the company’s ambition was large, the CEO knew it would be foolhardy to rush in. GIS was a platform for organizing and making sense of the data that would undergird these efforts—the mapping and analysis stage.
GIS produced maps showing the demographic and professional characteristics of regions where the company was active, along with schools, concentrations of businesses, and the education levels of residents. This information would help direct investments in STEM resources that are aimed at overcoming the digital divide and diversifying the workforce.
The same technology can highlight how communities of color are impacted by greenhouse gas emissions or water usage. As the company implements programs to improve its impact in various regions, location intelligence will be key to managing performance.
The furniture company’s project was largely focused on its workforce. Leaders sought GIS to analyze pay equity by race, gender, and location, in addition to understanding the demographics of labor markets to improve recruiting.
Through mapping and analysis, the company could determine, for instance, if female Black employees in Galveston, Texas, were being paid equitably compared with white males in San Francisco. The next step for the company was to operationalize racial justice by adjusting pay levels and shifting hiring practices so that staffers reflected the communities where the company operated.
Down the line, an equity dashboard that captures these changing workforce metrics could help members of the C-suite trace outcomes of the company’s actions.
Lastly, the investment bank with the well-financed racial equity plan was looking for a way to handle the third stage of the process: managing performance. Colleagues and business partners were asking the head of CSR how the firm was practicing racial equity and how funds were being allocated. Since the bank was applying money and resources to dozens of programs to support BIPOC home-ownership, BIPOC businesses, bank access, and a more diverse internal workforce, the CSR executive knew a fact sheet wouldn’t be enough.
An interactive online map helps organize initiatives by location, creating geographic context for the loans, investments, and community development efforts under way. The map keeps stakeholders apprised of the company’s impacts and guides employees who want to know where and how they can contribute.
Equitable Business Is Good Business
These steps represent the kind of follow-through on racial equity pledges that the public is seeking. However, businesses aren’t motivated only by pressure from the outside. Especially as their ranks fill with employees who care deeply about social justice, businesses genuinely want to be on the right side of history.
Moreover, as advocates of CSR have long recognized and as studies prove, an equitable, inclusive business is a well-performing business. Organizations strengthen their bottom lines by improving the communities where they operate and unlocking economic opportunity for people of color. When business leaders have the location intelligence to understand the impacts of their actions, they can ensure that corporate America does its part to create a more just future.
The Esri Brief
Trending insights from WhereNext and other leading publicationsTrending articles

December 5, 2024 |

May 26, 2026 |

June 2, 2026 |

June 23, 2026 |

June 9, 2026 |

April 7, 2026 |