
April 27, 2023 |
September 19, 2023
In 2020, against a backdrop of national protests over the killing of an unarmed Black man by police in Minneapolis, the Los Angeles County Board of Supervisors joined other counties and cities in declaring racism a matter of public health. The board said racism against Black people was at crisis levels.
“As a nation, we had reached an inflection point which demanded that every institution in this nation—including Los Angeles County—publicly and collectively confront the myriad injustices faced by Black people in this country,” the board wrote.
As the most populous and racially/ethnically diverse county in the US—serving approximately 10 million people—leaders here are especially motivated to adopt innovative strategies and approaches for ending systemic and normalized racism.
The supervisors called for a study to help them better understand conditions that negatively affect the health and well-being of Black residents in LA County. In the inaugural report on the State of Black Los Angeles County, maps and data science lay bare this unequal reality.
Los Angeles County has the third-largest Black population nationally. The report found that despite living in one of the most prosperous counties in the nation, Black residents are more likely to experience large disparities in family stability, health and mental wellness, education, employment, economic opportunity, public safety, criminal justice, and housing. Black residents also experience higher rates of homelessness, incarceration, and rent burden. These conditions combine with higher risk than other groups for dying younger, earning less, and being denied a home loan.
County officials hope the report, with its many maps that show where disparities exist, will “guide, govern, and increase the county’s ongoing commitment to fighting racism.”
The county’s research for the report drew on data analysis, digital mapping from geographic information system (GIS) technology, and first-hand accounts. Findings in the report indicate that racism in Los Angeles County has existed through decades of disinvestment in Black communities, unfair hiring practices, and discrimination in college admissions.
“We want this report to be a model for other counties and cities to think about how they assess the impact of their policies and procedures,” said Dr. Tolu Wuraola, ARDI data analyst and racial equity consultant.
The Los Angeles County Board of Supervisors unanimously adopted a motion to establish an Anti-Racism County Policy Agenda on July 21, 2020. After Minneapolis police officers killed George Floyd, an unarmed Black man, on May 25, 2020, the board said it had a responsibility to act and address centuries of structural racism.
The following year, in 2021, the board voted unanimously in a separate action to return the waterfront property known as Bruce’s Beach. The property was illegally taken from Black entrepreneurs nearly a century earlier. When fixing this historic injustice, LA County leaders said that more can be done.
The State of Black Los Angeles County report provides the social and historical context that explains why racial disparities exist. The report’s maps allow county officials to see the number and location of neighborhoods where disparities exist.
Los Angeles County’s Board of Supervisors passed a motion in July 2020 to establish the Anti-Racism, Diversity, and Inclusion (ARDI) Initiative. The team supporting this initiative worked with key stakeholders to develop the county’s Racial Equity Strategic Plan. According to the 10-year plan, which was passed this year, “the disparate geographic landscape of opportunity yields very different life outcomes for those raised in neighborhoods of affluence compared to those raised in neighborhoods of disadvantage.”
Through this plan, the county is coordinating its departments to improve opportunities for education, full-time employment for individuals, and incomes above the poverty level for families. The county is also working to prevent infant deaths and first-time felony convictions for adults.
Since 2020, the county has also added new departments that focus on improving outcomes for some of the county’s most vulnerable populations. The new departments include Aging and Disabilities; Youth Development; Justice, Care, and Opportunities; and Economic Opportunity. County officials expect that the new programs will provide the resources that are needed to meet or exceed their larger equity and anti-racism goals.
To ensure the county is making progress toward these goals, the ARDI team will continue to collect and analyze data with GIS and report on outcomes.
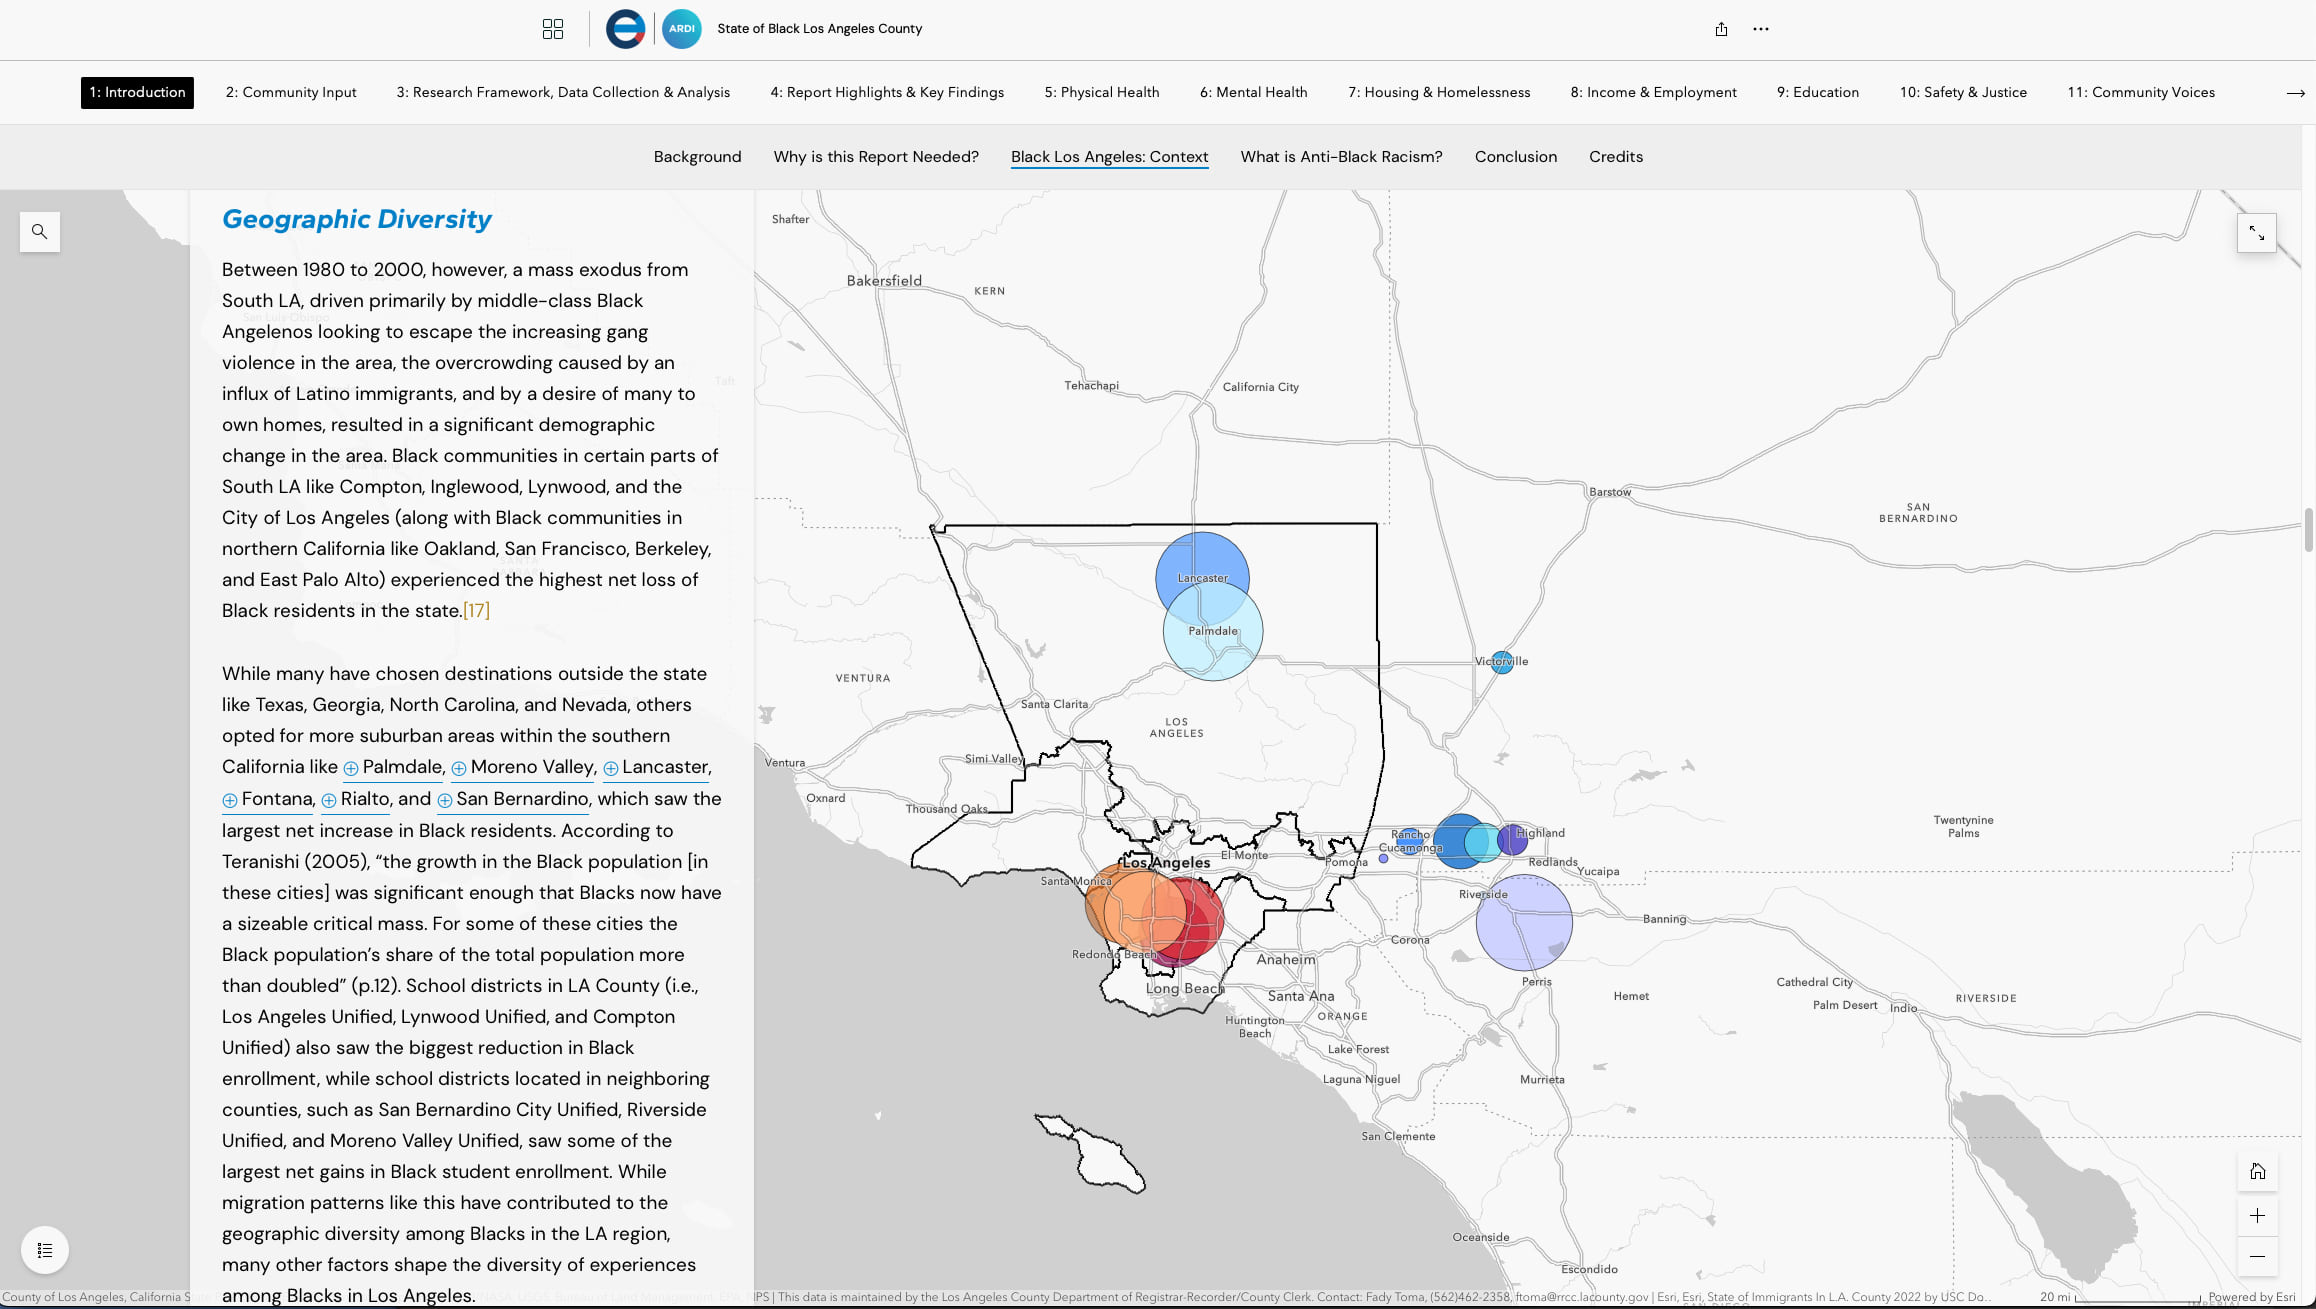
Los Angeles County is an economic powerhouse. Its gross domestic product is the largest nationally for a county, at $710 billion or 3.8 percent of the US economy. Yet, wealth is lacking in Black communities.
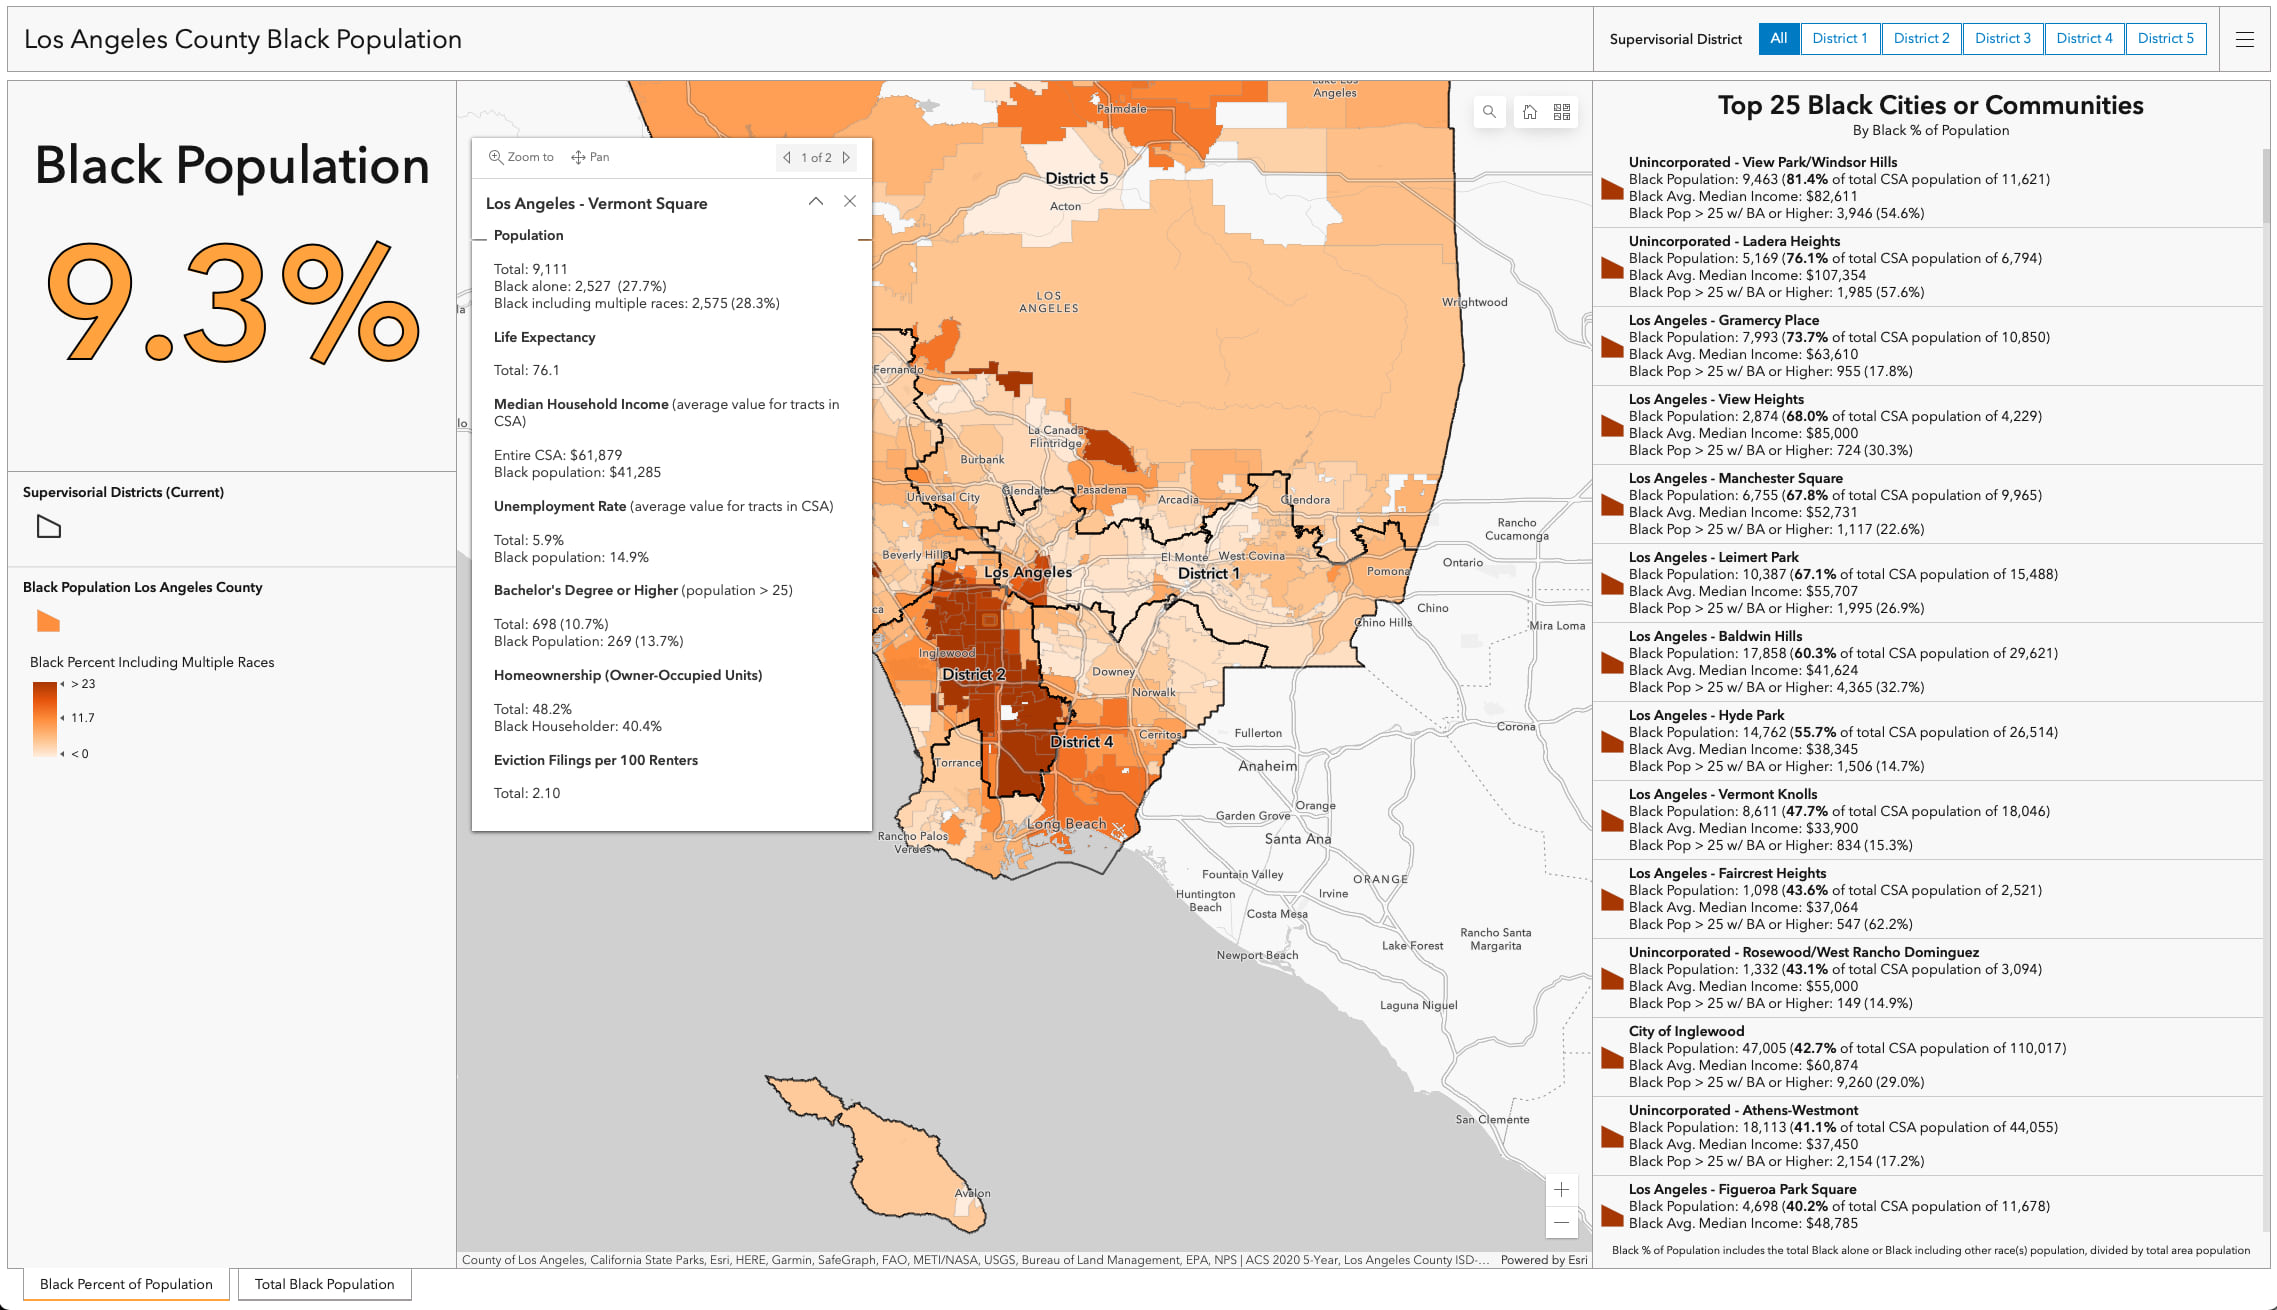
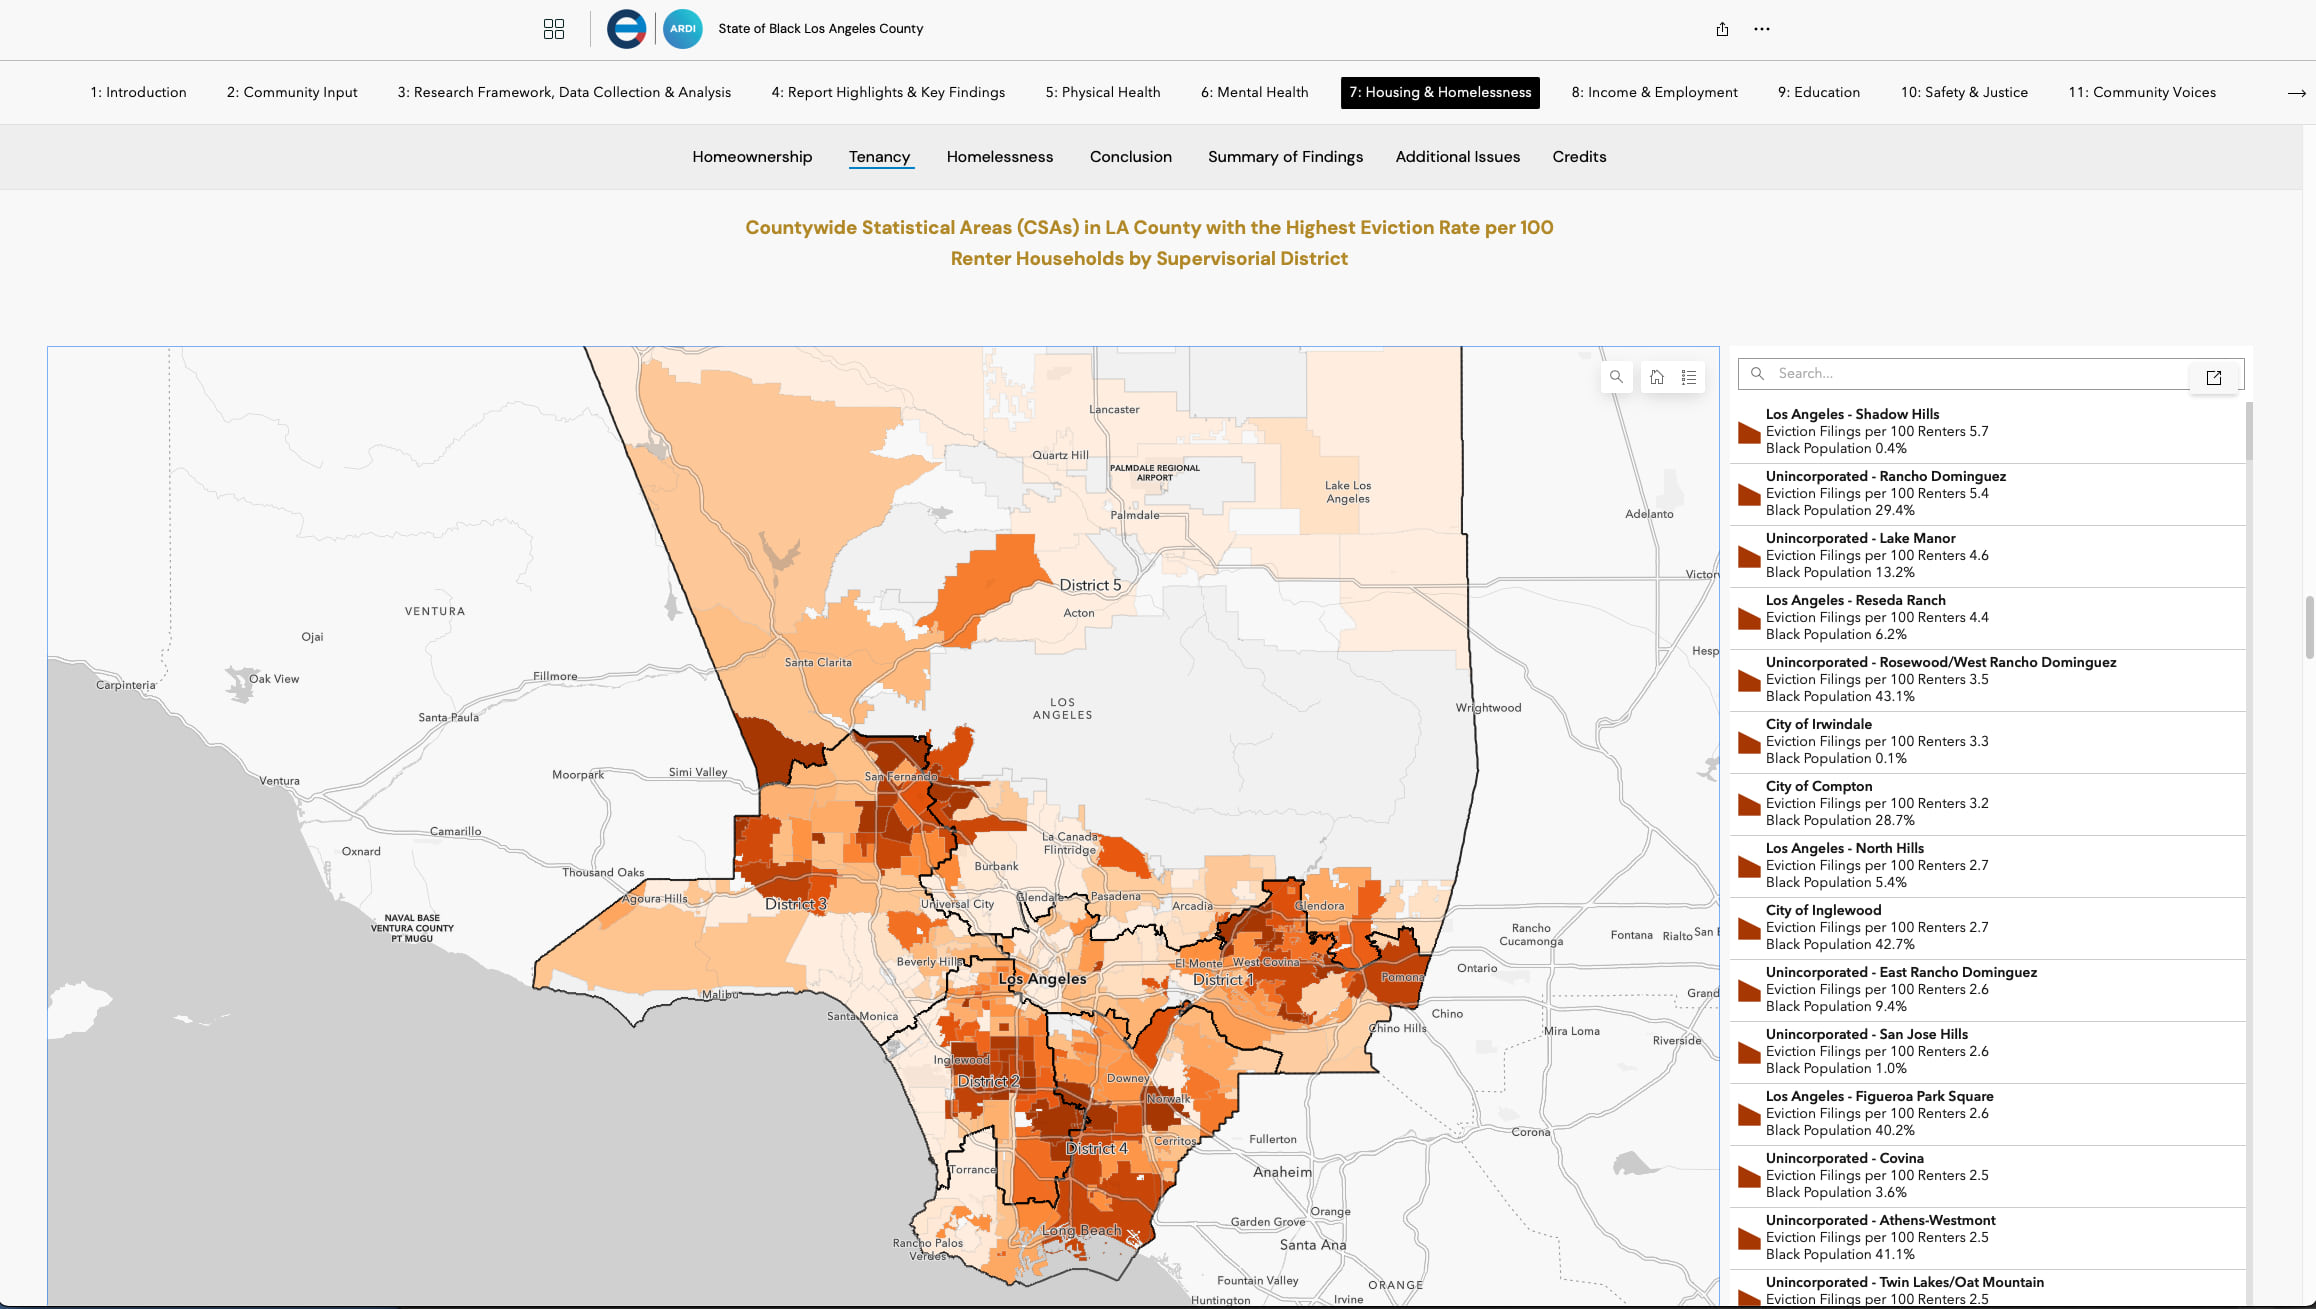
The State of Black Los Angeles County report indicates that 30 percent of the county’s homeless population is Black, although this group is just 9.3 percent of the county’s population. Blacks in Los Angeles County have higher rent burden (62 percent) and rates of eviction (1.6 evictions/100 renter households), according to the report.
Black applicants are less likely to have a mortgage application approved (61.9 percent) compared to whites (69 percent), Asians (69 percent), and Latinos (64 percent). The average value of a home owned by Black residents in the county is approximately $200,000 less than the county average and more than $450,000 below the average value for homes owned by whites.
However, there were bright spots. Among the counties in the country with the highest number of Black residents, Los Angeles ranked second on Black college degree attainment (28.4 percent), though still significantly trailing white and Asian residents within Los Angeles County.
Also, more Black Angelinos now have access to health care with an estimated 93.6 percent having health insurance, compared to 95.5 percent of whites. The county also saw a 16 percent reduction in the rate of Black Angelinos incarcerated in the county jail system. One of the biggest bright spots, however, was the data on Black people and mental health treatment. It showed that—both before and after the onset of the pandemic—Black people in the county were more likely than any other group to receive treatment for self-reported mental/emotional issues.
The county’s ARDI team partnered with researchers from California State University at Dominguez Hills, Claremont Graduate University, and Capacity to Impact, a research and evaluation firm. The study design called for an examination of Black outcomes at smaller geographies.
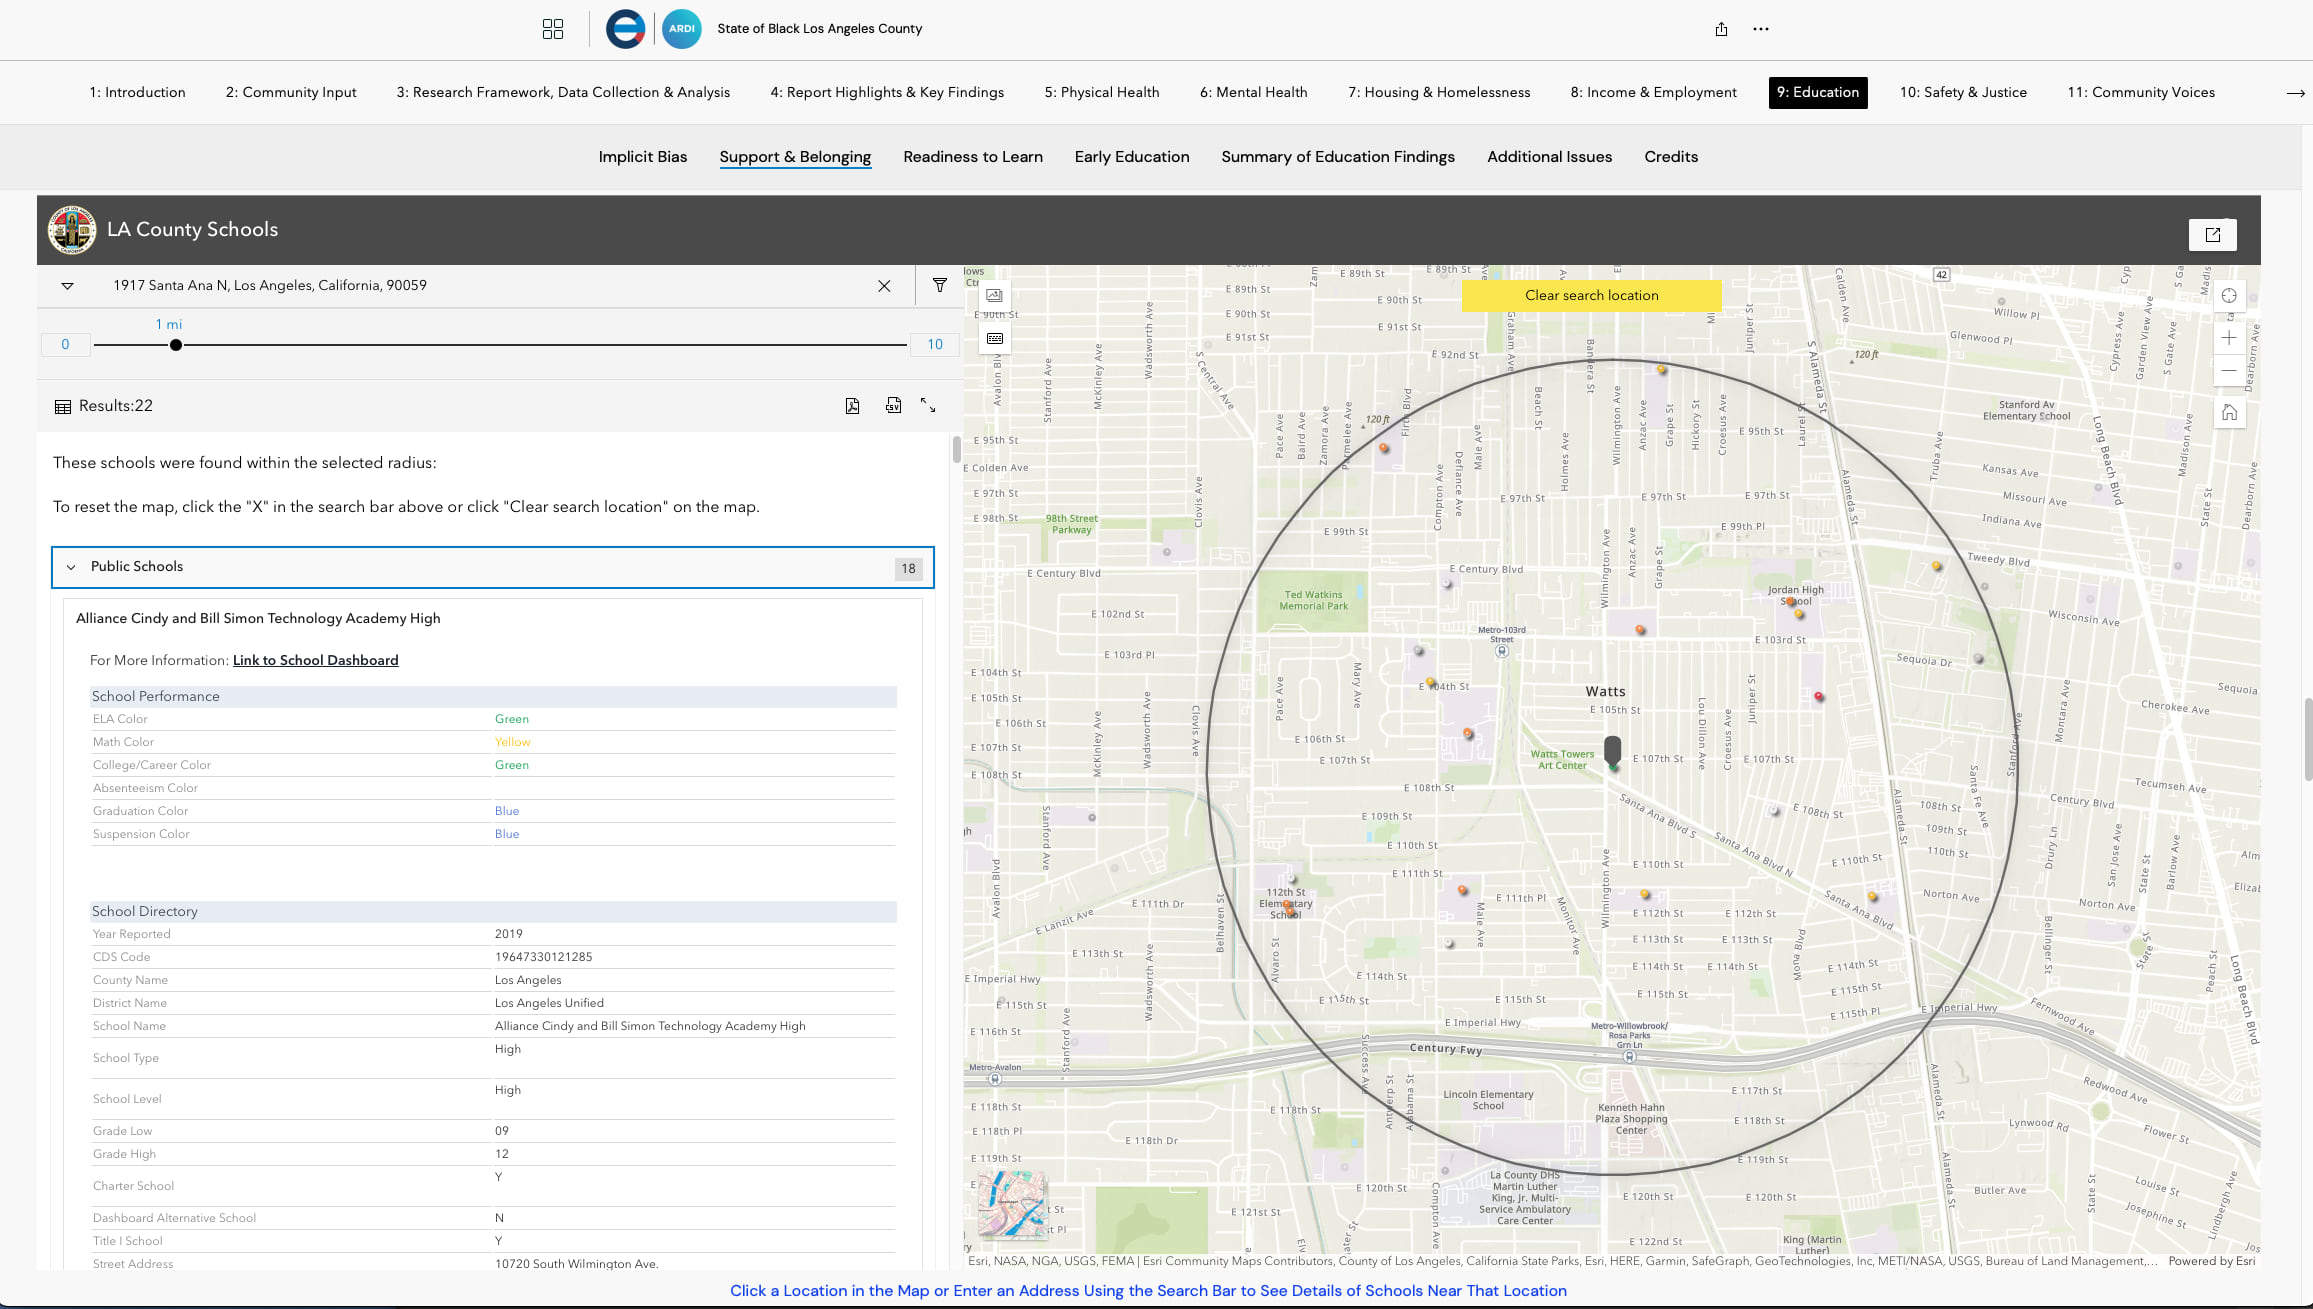
As a part of its research, the ARDI team worked with the county’s Internal Services Department to compile data about the well-being of Black residents using GIS technology. The research focuses on physical and mental health, housing and homelessness, income and employment, education, and criminal justice.
Organizing the data on GIS-based digital maps by location allowed the researchers to see patterns. Stacking data layers over the maps has shown, for example, that segregation, health disparities, poverty, and lower property values tend to follow historical patterns for redlining. For decades, mortgage lenders used this practice to deny loans to Black applicants. Maps were drawn to designate communities from which loan applications would be refused.
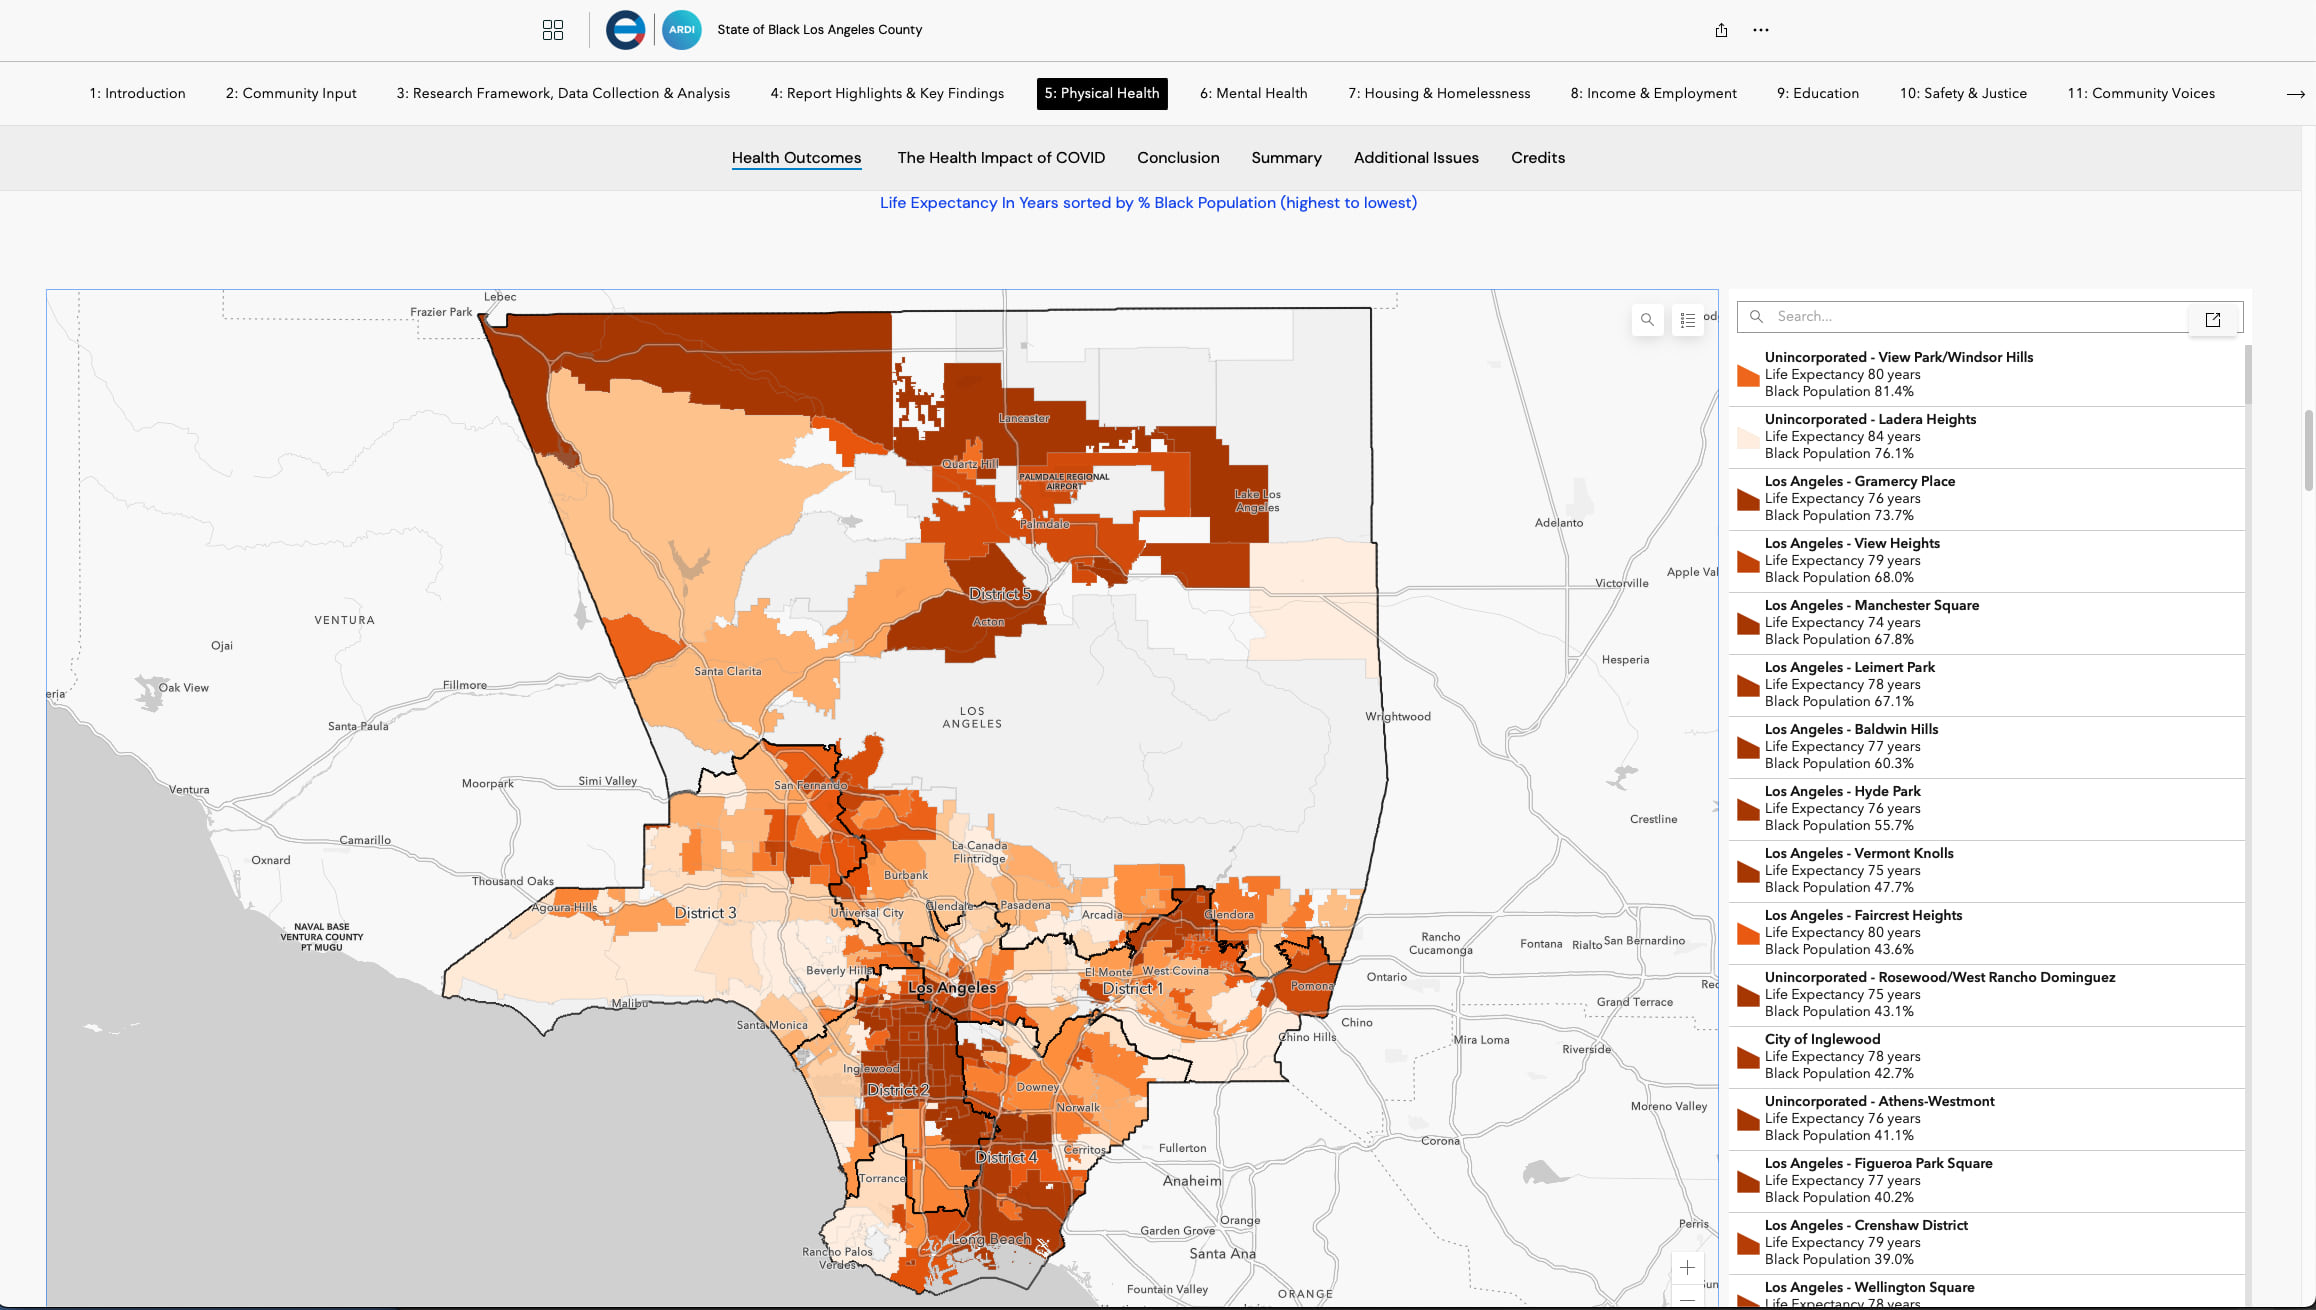
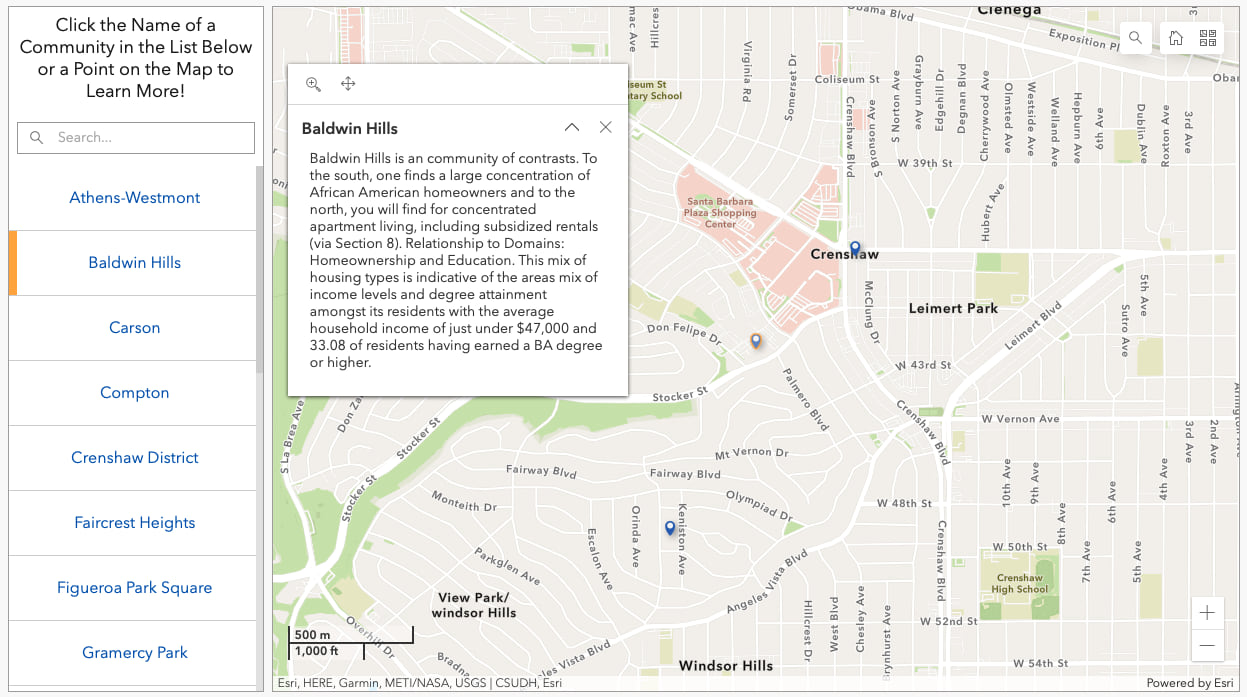
In its work to address such inequities and show the distinctiveness within the county’s Black communities, the ARDI team also examined inequities at the city and neighborhood levels. By doing so, the researchers could compare differences in life expectancy, median household income, unemployment rates, homeownership rates, and more across the county.
For example, while the Black median household income is $51,259 at the county-level, the (average) Black median household income is $107,354 in unincorporated Ladera Heights (which is 76 percent Black) and $38,345 in unincorporated Hyde Park (which is 56 percent Black). Countywide, the Black homeownership rate is 33.5 percent, but 73.3 percent in Ladera Heights and 36.9 percent in Hyde Park.
“It was critical for us to evaluate how residents were doing at the neighborhood level since we are aware of the relationship between race and place, the legacy (and ongoing occurrence) of residential segregation, and the lack of access to resources in certain geographical areas,” Dr. Wuraola said.
Hyperlocal location intelligence—authoritative information about a specific place or places—guides decision-makers in many areas of business and government. GIS mapping and data analysis tools support many of the county’s equity initiatives. Examples include the county’s Equity Explorer tool and the Los Angeles County GIS for Equity web page.
Many organizations in Los Angeles County and elsewhere are working toward similar goals for equity. For that reason, the ARDI team expects other organizations and foundations to benefit from its work.
“To date, we have made some progress in our collective struggle for equity, but we know we need to do so much more,” said Hilda Solis, Chair of the Los Angeles County Board of Supervisors when the 2021 budget was released. “We are in this marathon together, and we will see this through to the finish line.”
Today, technology offers powerful tools for ensuring that all residents are healthy, experience justice, and thrive. The work carried out in Los Angeles County is evidence of this. As in that community, other jurisdictions will need courage, commitment, and resources to address disparities in life outcomes and public investment.
Learn more about how GIS helps advance racial equity, social justice, and sustainable, inclusive development.

April 27, 2023 |

August 21, 2023 |

September 22, 2020 |