July 13, 2020 |
Dr. Dawn Wright |
As a child, Nick Okafor already knew he would one day enter a career in the fields of science, technology, engineering, and math (STEM). He loved building things, from LEGO models with his friends to bookshelves for his mother. Now, he’s a strategist and researcher at Sidewalk Labs where he helps cities build products and places to radically improve quality of life. In his spare time, he trains high school students to follow in his footsteps.
In college, at Washington University in St. Louis, Okafor took classes in biomedical engineering and computer science before deciding to major in mechanical engineering and sustainable development. The courses appealed to his analytical mind and interest in creating things that helped people. Later after graduation while working for Boston Consulting Group, for an externship in 2019, he was asked by Planned Parenthood to apply geographic information system (GIS) technology to create a national market strategy for reproductive healthcare options available in different states across the country; the experience helped Okafor understand how GIS can address complex issues.
“I knew data, I knew the importance of spatial insights, but for me, that externship was the first time that I connected with GIS,” Okafor said. “It was a lot of work to understand what their use cases are, what are the questions that they’re grappling with every day. And then as a market analyst, how can I create tools and elevate data to start to help them make the right decisions?”

In 2020, he began teaching a course called Mapping Justice for the Massachusetts Institute of Technology (MIT) Online Science, Technology, and Engineering Community (MOSTEC). The academic enrichment program from the MIT Office of Engineering Outreach serves high school students, many from underserved communities. It starts with a six-week summer project and mentoring that extends six months through the first semester in the students’ senior year.
Okafor, who is Black, Queer, and Nigerian, says his goal as an instructor is not just to create more Black analysts, but to have all the students carry the work with them into any industry. “Whether or not they’re going into tech, business, or a local community organization, I think this education is needed. I want them to be mindful of the implicit biases that are present and the role we can play in making impact.”
Years earlier, in 2011, Okafor was a student in the first class of MOSTEC. Growing from student to mentor in 2014 and later an instructor in 2019, Okafor wanted to think beyond the networking and college readiness aspects of the MOSTEC program.
“I was grappling with limited time, and the remote nature of the program, I thought, ‘Well, what’s a technical skill that I feel confident in teaching, but also feel confident that they can comprehend?’ And I thought about my GIS experience and how within a month I was turning around maps and dashboards for CEOs, so why can’t a 16-year-old?”
He wanted a part of the Mapping Justice course to be focused on GIS technology and spatial analytics because he saw the power of using those tools to explore systemic racism. He explored critical questions like “Can GIS have a role in telling a story and working toward a solution?” Core to the class is facilitating conversations around bias in data, responsibility in action, and the role race, power, and technology play in their lives.
Most of Okafor’s students don’t have experience using GIS, but after six weeks they are able to build interactive maps and apps to tackle topics of interest to them.
In the first week of the class, Okafor starts his students with an assignment called Everyday Spatial Analysis, where they look for applications of the technology. “Where do you see data and space connected, and where are those implications?” Okafor asks his students. “Is it a map on the news around COVID rates? Is it an infographic? A clickbait on Instagram about comparing different states?”
Okafor knows students are really learning when they get excited about the subject area. He tries to connect them with issues they care about, help them identify what they want to change, and see how that change can happen.
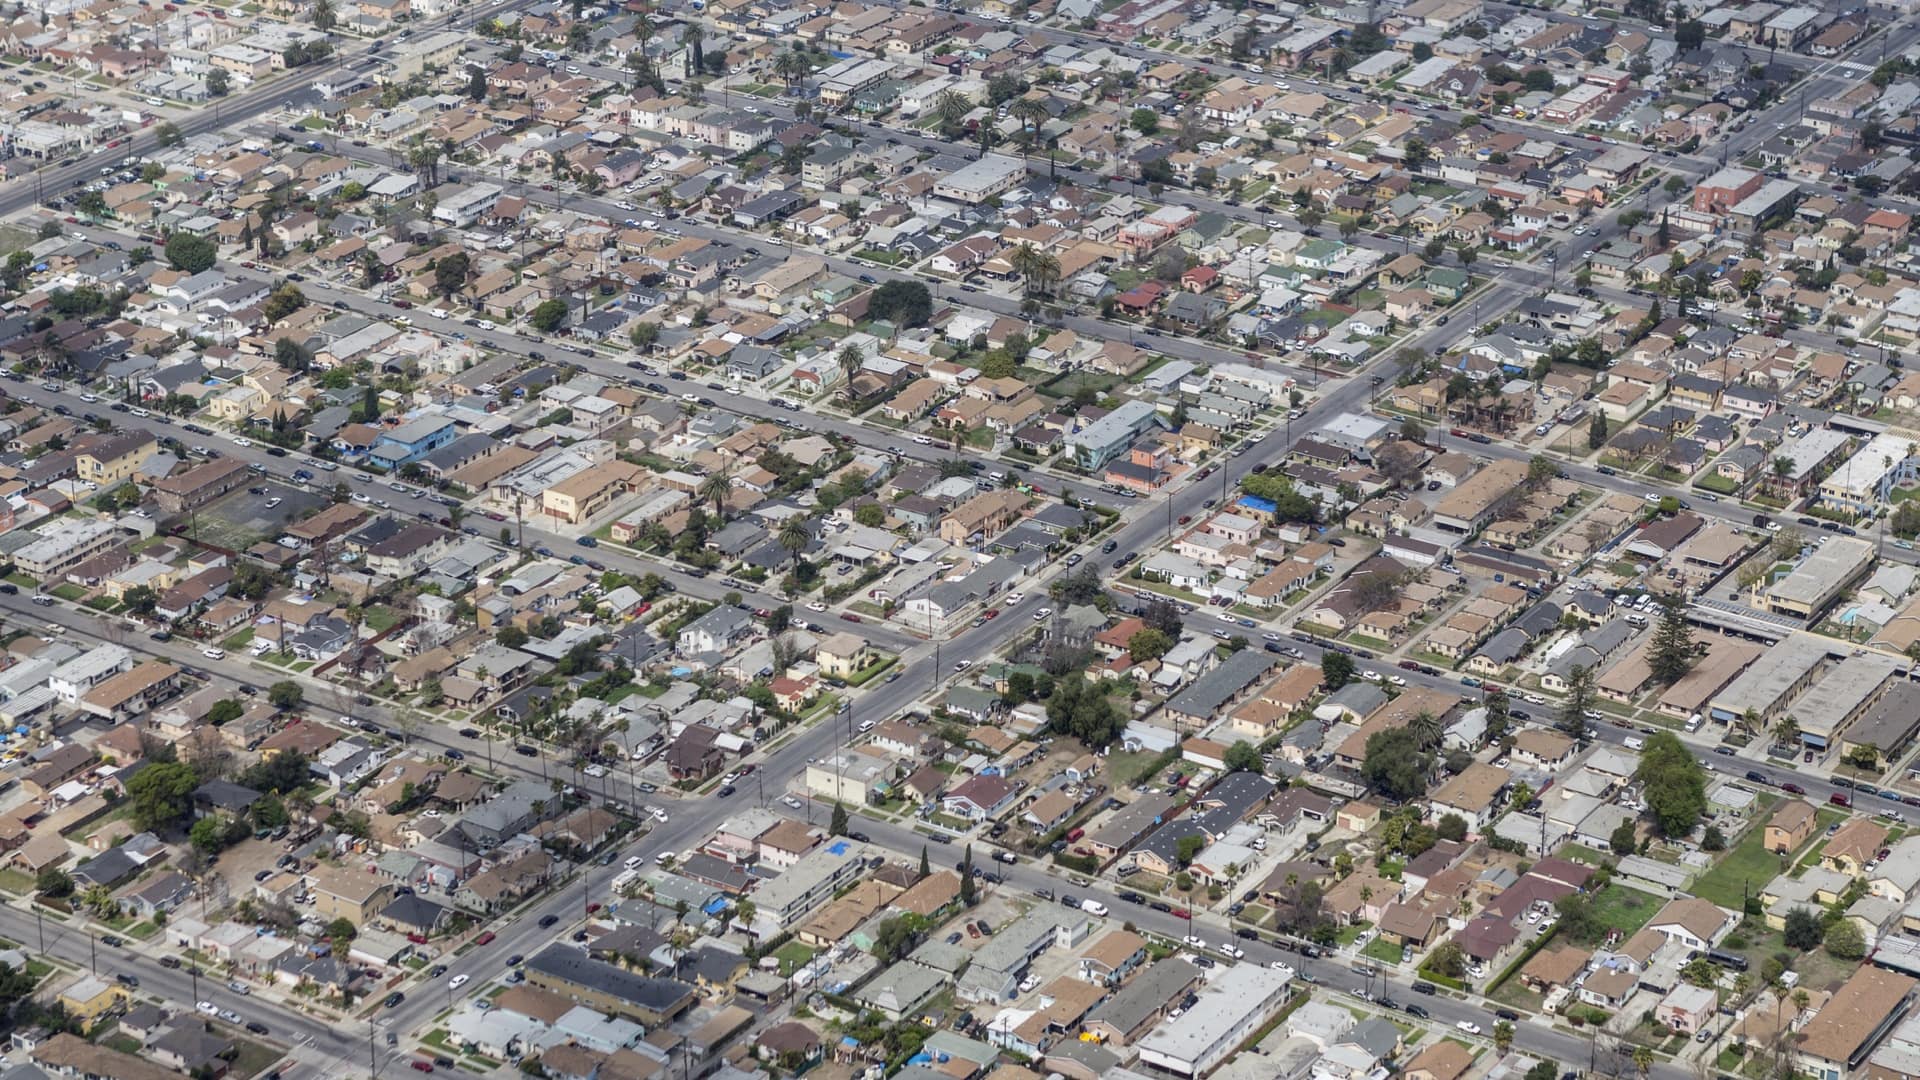
Students begin their class projects by thinking about a big idea, then they are paired up based on their ideas. They find data and take a closer look at issues impacting their communities such as transportation inequity, climate change, transgender discrimination, food access, gentrification, the digital divide, education disparities, and more.
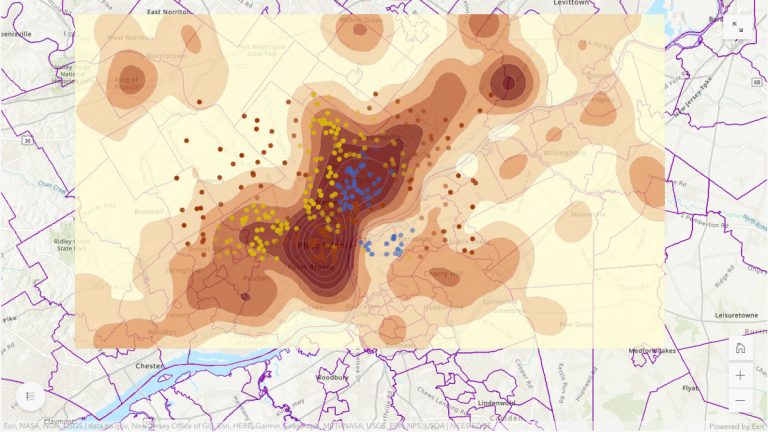
While students are working and scoping their projects, they are learning how to use GIS for the first time. This includes figuring out how to pull data, how to make a story map, and what story they want to share in an interactive and meaningful way.
Okafor says he enjoys seeing the students’ progress through the course, “starting from zero to dashboard, maps and web apps in less than six weeks.”

The high school students who participate in the Mapping Justice course come from all parts of the United States, and many come from underserved communities. They have grown up in a world saturated with technology, data, and analysis—without realizing the role location intelligence plays in making sense of it. Now that they are armed with GIS tools and skills, they are shaping their own narratives for how to impact change.
Okafor thinks that location intelligence gives students an advantage. “We’re born into identities, into networks, into communities that will shape us, but we’ll be forever shaped by that—how we continue to present in the world is always going to be affected by that,” he said.
In teaching the powerful analytical capabilities of GIS, Okafor encourages his students to lean into their own experiences and cultural backgrounds, especially when thinking about their research and data design. This method of teaching, combined with project-based learning, allows the students to gain a deeper understanding and draw their own conclusions.
Beyond spatial awareness, Okafor says the Mapping Justice course “brings that quantitative nature to social problems that sometimes can be missing from leaders’ decision-making.”
Learn more about Esri’s Social Equity Analysis Solution.