A Conversation with Roger Sayre, Senior Scientist for Ecosystems at the U.S. Geological Survey
Scientists have long mapped components of our planet’s ecosystems including soils, rocks, vegetation, and climate. More recently, the intergovernmental Group on Earth Observation (GEO) commissioned the first comprehensive maps that define all of Earth’s ecosystems. A team led by Roger Sayre, Senior Scientist for Ecosystems at the U.S. Geological Survey (USGS), and including Esri and other partners, got to work defining and mapping land, marine, and coastal ecosystems.
These ecosystems support life on earth, providing the food, fuel, and services that sustain us. Accurate maps will help scientists, land managers, conservationists, developers, and the public better understand the location and condition of each ecosystem, and identify how they are changing.
Geographers, analysts, cartographers, and software developers from Esri joined the USGS team to help synthesize earth observation data and produce innovative global ecosystems data for lands and waters.
Two goals for the project include: providing a downloadable dataset that can be imported and analyzed in a geographic information system (GIS), and developing a repeatable big data approach to synthesize and classify data about distinct ecosystems.
How does this project address a gap in our ecological understanding and help answer questions?
It’s really important that we understand where our ecosystems are, what they are, what shape they’re in, and what they’re giving us as human beings in terms of goods and services that we might need for our very survival. We’re going to need this data to know which ecosystems to conserve as protected areas and which ones need to be managed more sustainably.
We’re mapping global ecosystems because it’s one of the data layers you just can’t find. Ecosystems have been mapped at different scales, and with different definitions, but no standardized global product existed before.
I’m a scientist and a lot of the work we do is in the name of science, by scientists, and for scientists. However, we want the work to be useful to non-scientists as well. We’re making these data available to the broadest possible community, as something managers and decision-makers can access and use.
How does this project inform inquiries into the impacts of global change?
Understanding change implies that you knew what was there at time T0 and you know what’s there at time T1. If we were to remap global ecosystems in the same way five years down the road, then we could calculate change, but that kind of remapping effort would require additional resources.
While we can’t answer questions about change yet, we’re contributing to our understanding of what’s on the Earth’s surface. We’re providing a piece of the puzzle and allowing researchers to relate geographic patterns in their data to ecosystem characteristics.
How do you distill the uniqueness of this work, and how will it be used?
I consider a lot, if not all, of what we’re doing as essential global ecological base mapping. We’re still in base mapping mode because no one has done it yet and it still needs to be done.
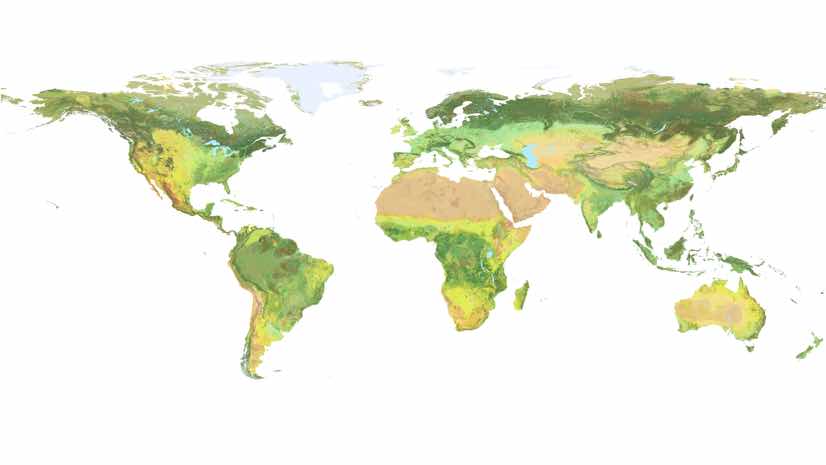
When we map terrestrial ecosystems, we know they are an integration of the climate regime, the moisture in the soil, the geology, the landform, and what organisms are there. All of those things together constitute an ecosystem. If you map each of those things and then combine them in a GIS, you get a geographic set of ecosystem areas that can be visualized and analyzed.
It's really important that we understand where our ecosystems are, what they are, what shape they're in, and what they're giving us as human beings in terms of goods and services that we might need for our very survival.
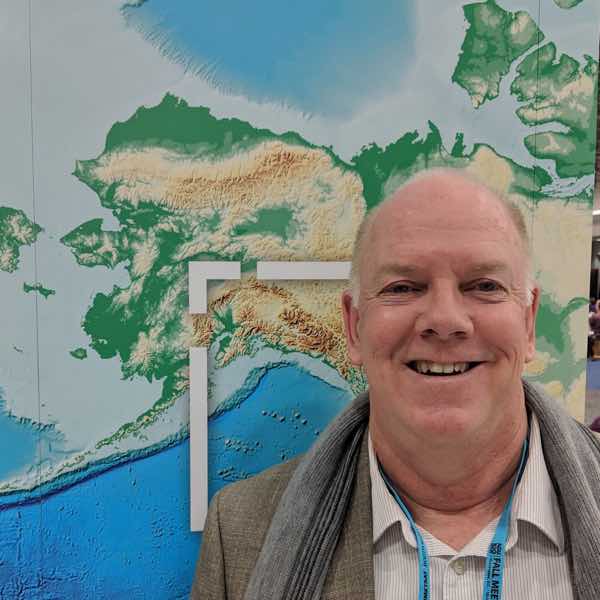
Senior Scientist for Ecosystems at the U.S. Geological Survey
Roger Sayre
What does this work contribute to larger questions, such as how much life our planet can support?
We’re contributing a small piece into a larger picture by creating authoritative ecosystems data that people can use for any number of different applications.
We’re mapping ecosystems based on their structural elements and less so on their biological assemblages. Our job is to put out the environmental aspects of ecosystems, and we hope that species specialists will use our maps to understand why species locate where they do. That is the basic question behind the scientific discipline of biogeography.
I’m an ecosystems geographer and I really want to call each unit an ecosystem, but I can’t until we have a much better understanding of the biology. Once we integrate the species distribution information into the environmentally distinct areas which we have mapped, then we can call them ecosystems and researchers can start asking and answering questions about life support.
As you and I know, the scale and scope of this effort has been huge. Can you share some of the specific details?
There are more than 105,000 ecological facets on the planet, which represent all the unique combinations of land cover, lithology [characteristics of rocks], landform type, and climate. We aggregated those facets into about 4,000 Ecological Land Units (ELUs).
The Ecological Marine Units (EMUs) delineate physically and chemically distinct regions of the open ocean, noting variations in temperature, salinity, oxygen, and nutrients from place to place. We built the EMUs from an ocean point mesh that had 52 million points. I thought that was big data at the time, but the definition changes on an almost daily basis.
The geospatial cloud definitely helps us. For some of our work, like global shoreline mapping, we use Landsat imagery. The Landsat imagery already exists in the cloud, so we didn’t have to separately house and manage all the imagery. We could take our algorithm to the cloud and do the interpretation there and bring down the output.
How does having GEO as a sponsor give the project added validity?
All of this work has been commissioned by an intergovernmental protocol and a consortium of nations. The original architects of GEO defined the need for a global ecosystem map. At the start of GEO they contacted me and asked my advice, based on my prior work in this area. I gave them that advice and was later asked to be the leader of the initiative, which is an honor and a privilege.
What’s unique about the coastal zone that is the current focus of mapping?
We decided to create the global Ecological Coastal Units (ECUs) independently because it’s so much different than inland environments or the open ocean. We will be mapping nearshore coastal waters to a depth of 20 meters, offshore coastal waters from the nearshore to the edge of the continental shelf, and coastal land areas.
We’ll characterize whether the system is wave influenced, tidal influenced or river discharge influenced. We’ll determine the climate. We’ll also classify the onshore topography, and the geomorphology (whether the coast is sand, pebbles, boulders, cliffs, concrete pavement, etc.). It’s a massive project.
What’s the update on the latest product to come from the effort?
We needed a coastline vector as the spatial backbone for this project, so we went into the cloud and extracted a brand-new global shoreline from 2014 Landsat imagery. Looking at this new global shoreline, it occurred to us that since every land mass on the planet is an island, no matter how big it is, we were sitting on a new global islands database.
Prior to this effort, the hundreds of thousands of islands on the planet were not available as data, certainly not in the public domain. We simply subdivided it into three size classes—continental main lands (the five obvious ones), big islands, and small islands (smaller than a square kilometer). We found that there are some 22,000 big islands and there are some 320,000 small islands. The new Global Island Explorer allows you to visualize and query this data.
What’s on the agenda for the coming year?
We’re always trying to increase the spatial resolution. It used to be that all the best global data products were at a 1-kilometer resolution. We mapped ELUs, the first global ecosystem mapping effort, at 250 meters. Now, for the coastal product, we’re mapping at 30 meters. We have gone down that scale ladder, increasing the detail and depth of information.
The amazing thing about all these products we’re producing is they’re so new they haven’t caught on yet. They have great potential to inform decision making and aid research.
The collaboration between Esri, the USGS, and a host of international experts is strong and very productive.
We’re moving on to map the next thing, but we also need to promote the data and seek partnerships with researchers who can add the species dimension. It’s exciting, and there’s much to do.
ConservationMappingecologyecosystem servicesmappingnatural capital
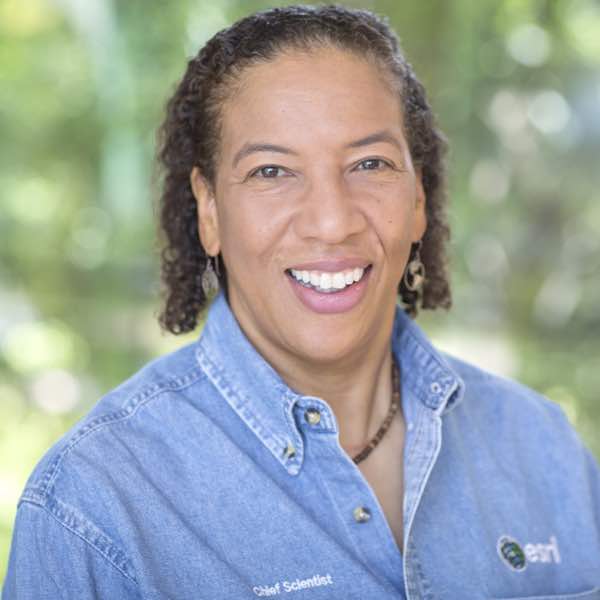
Dr. Dawn Wright
Dawn Wright is Chief Scientist of Esri. She works to strengthen the scientific foundation for the company’s products and services. Notably, Dawn led the team that created the Ecological Marine Units (EMUs), a 3D digital ocean that creates better understanding of marine environments and how to plan for more sustainable activities there in the wake of climate change.
Dawn joined Esri in 2011, and has written and contributed to some of the most definitive literature on marine geographic information system (GIS) technology. An elected member of both the National Academy of Sciences and the National Academy of Engineering, as well as the American Academy of Arts & Sciences, she earned her doctorate in Physical Geography and Marine Geology from UC Santa Barbara. In 2022, Dawn became the first Black person to visit the Challenger Deep in the Pacific Ocean, the deepest and most unexplored place on planet Earth.