June 19, 2020 |
Clinton Johnson | GIS for Good
October 6, 2020
Driver’s license suspensions can pose huge barriers in low-income communities. In 41 US states, the penalty for unpaid traffic tickets is to have a driver’s license suspended or revoked, or renewal refused—a move that limits ability to travel for work, childcare, and other daily needs. In New York State, a coalition concerned about the ethics and impacts of motor vehicle fines and penalties opened the eyes of legislators, using maps to prove its case.
“It’s all too common to miss a notice about an unpaid traffic ticket and then learn from an arresting officer that you have been driving with a suspended license,” said Katie Adamides, New York State director, Fines and Fees Justice Center (FFJC).
Those able to pay fines and fees will pay and leave the system. But, Adamides says, for those who cannot pay, “it’s the beginning of not having the freedom of movement, being afraid, and making awful calculations to either forego basic needs or commit a crime by driving on a suspended license.”
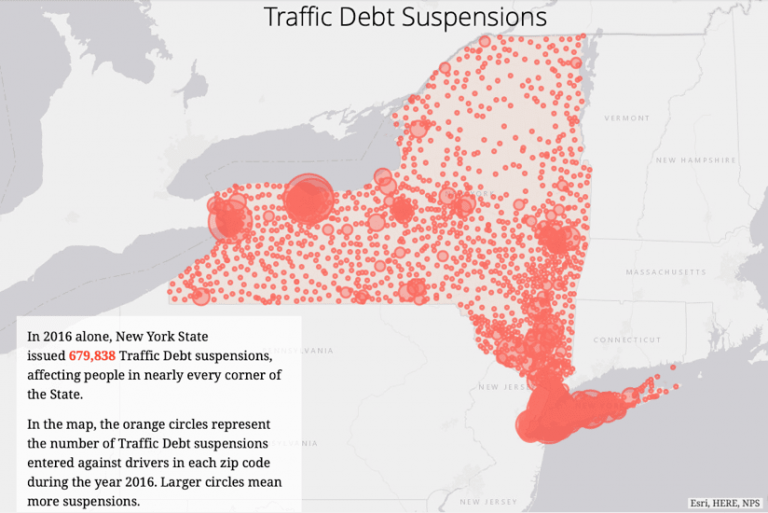
The data reveals a connection between poverty and punishment. FFJC turned to the Self-Represented Litigation Network to bring the data to life with spatial analytics and mapmaking (see the sidebar below).
The stories these maps tell helped inspire the Driver’s License Suspension Reform Act, which will eliminate suspensions for unpaid tickets and require income-based payment plans. The New York State Legislature passed the bill, which is awaiting the governor’s signature.
At least 11 million Americans have driver’s license suspensions due to unpaid court debt, according to FFJC. More than 75 percent of those polled said they continue to drive multiple times per week because their vehicle is essential to their lives and livelihoods.
Without a vehicle, it can be impossible to fend for family, manage health care and childcare, or get to court.
“Instead of serving the public safety interest that people think suspensions serve, our current system actually creates additional public safety problems,” Adamides said. “We are diverting policing resources to criminalize people whose only real issue is they can’t afford to pay, and we create a situation where people are driving without insurance. The fees people can’t afford to pay don’t actually generate revenue.”

Taking away a license to coerce payment is a flawed concept, Adamides says.
“If you look at our maps, it shows that it may work sometimes, but not for people who can’t afford to pay,” Adamides said. “The majority of suspensions in low-income communities are unresolved a year later, showing that people are most likely not paying because they just don’t have the money.”
“Maps were a really useful tool because the siloing of data in New York State had made it hard to see inequality,” Adamides said. “We needed to do a regression analysis from two different data sources to visualize the problematic trends.”

The Driven by Justice Coalition found that in New York City, the 10 ZIP codes with the highest concentration of people of color are two and a half times more likely to have traffic debt suspensions than those with the highest concentration of White ZIP codes. In the rest of the state, people of color face four times more debt suspensions. The rate is almost nine times higher in the 10 lowest-income ZIP codes than in the 10 wealthiest ZIP codes.
“When we’re talking about the right thing to do, we’ve got to be clear on the facts about how things are and how they ought to be,” Adamides said. “Maps are key to communication because they make a technical, inaccessible issue accessible.”
Adamides credits interactive maps as key to the coalition’s strategy in communicating with legislators in New York State and beyond.
“Giving them a tool that allowed them to drill down into a locality helped lawmakers connect with and feel responsibility for their constituents,” she said. “That helped us show them that it wasn’t just a problem for the state; it was a problem for them.”
The advocacy included statistics and reports specific to each legislator.
“I have to say that the maps were almost too powerful,” Adamides said. “If I opened them up at the top of the meeting, no one was going to hear the words coming from my mouth because the maps are more engaging.”
Whether the legislators agreed with the analysis or the way policy needed to change, the maps provided authoritative information in a way that made it easy to understand and use in making decisions on the issues.
“The maps locked in our credibility immediately, and rightfully so, because we have the data and know what we’re talking about,” Adamides said. “Legislators turn to trusted sources for guidance and analysis, and through our analysis and mapping work, we became an authority on this issue.”
Similar driver’s license suspension reform legislation is pending in several other states. Staff at FFJC are advocating with maps and data for further legislation across the country through its national “Free to Drive” coalition and campaign.
“This reform has been happening all across the country—in Mississippi, Idaho, Montana, California,” Adamides said. “Mississippi and California are not usually on the same page, but they are on this issue because it’s a logical and right thing to do.”
Learn more about how GIS helps examine racial inequities.