

February 3, 2026 |
Sunny Fleming | Conservation
May 26, 2026
If you had a million dollars to invest in conservation, where would you spend it?
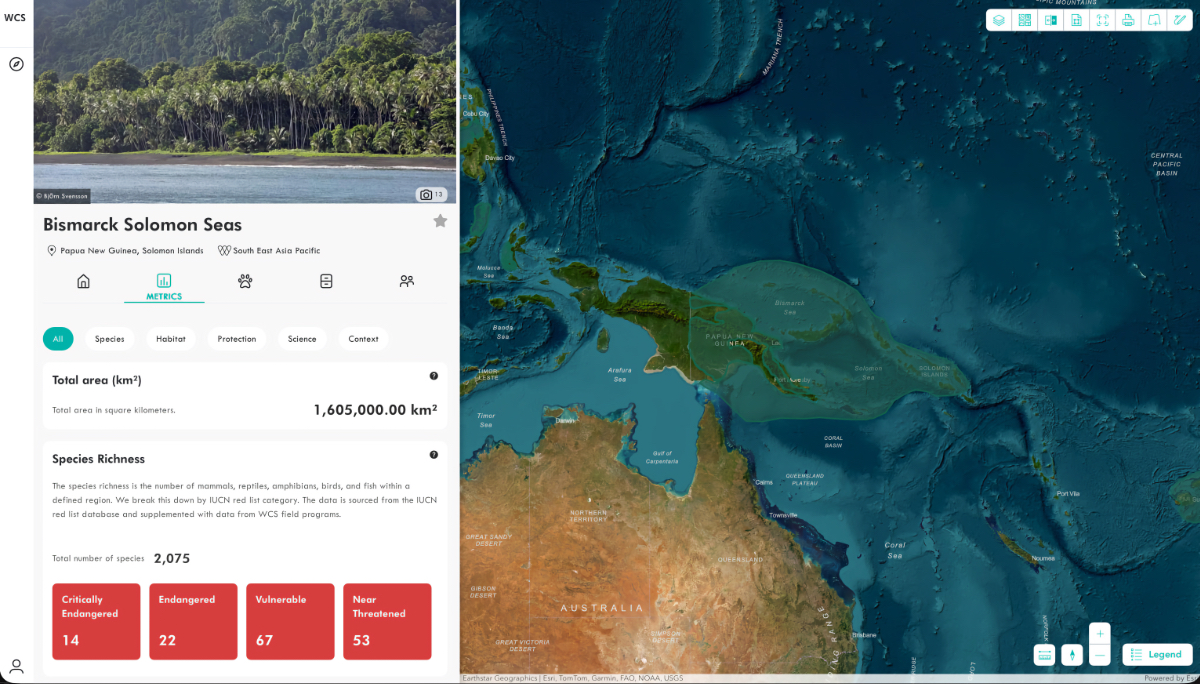
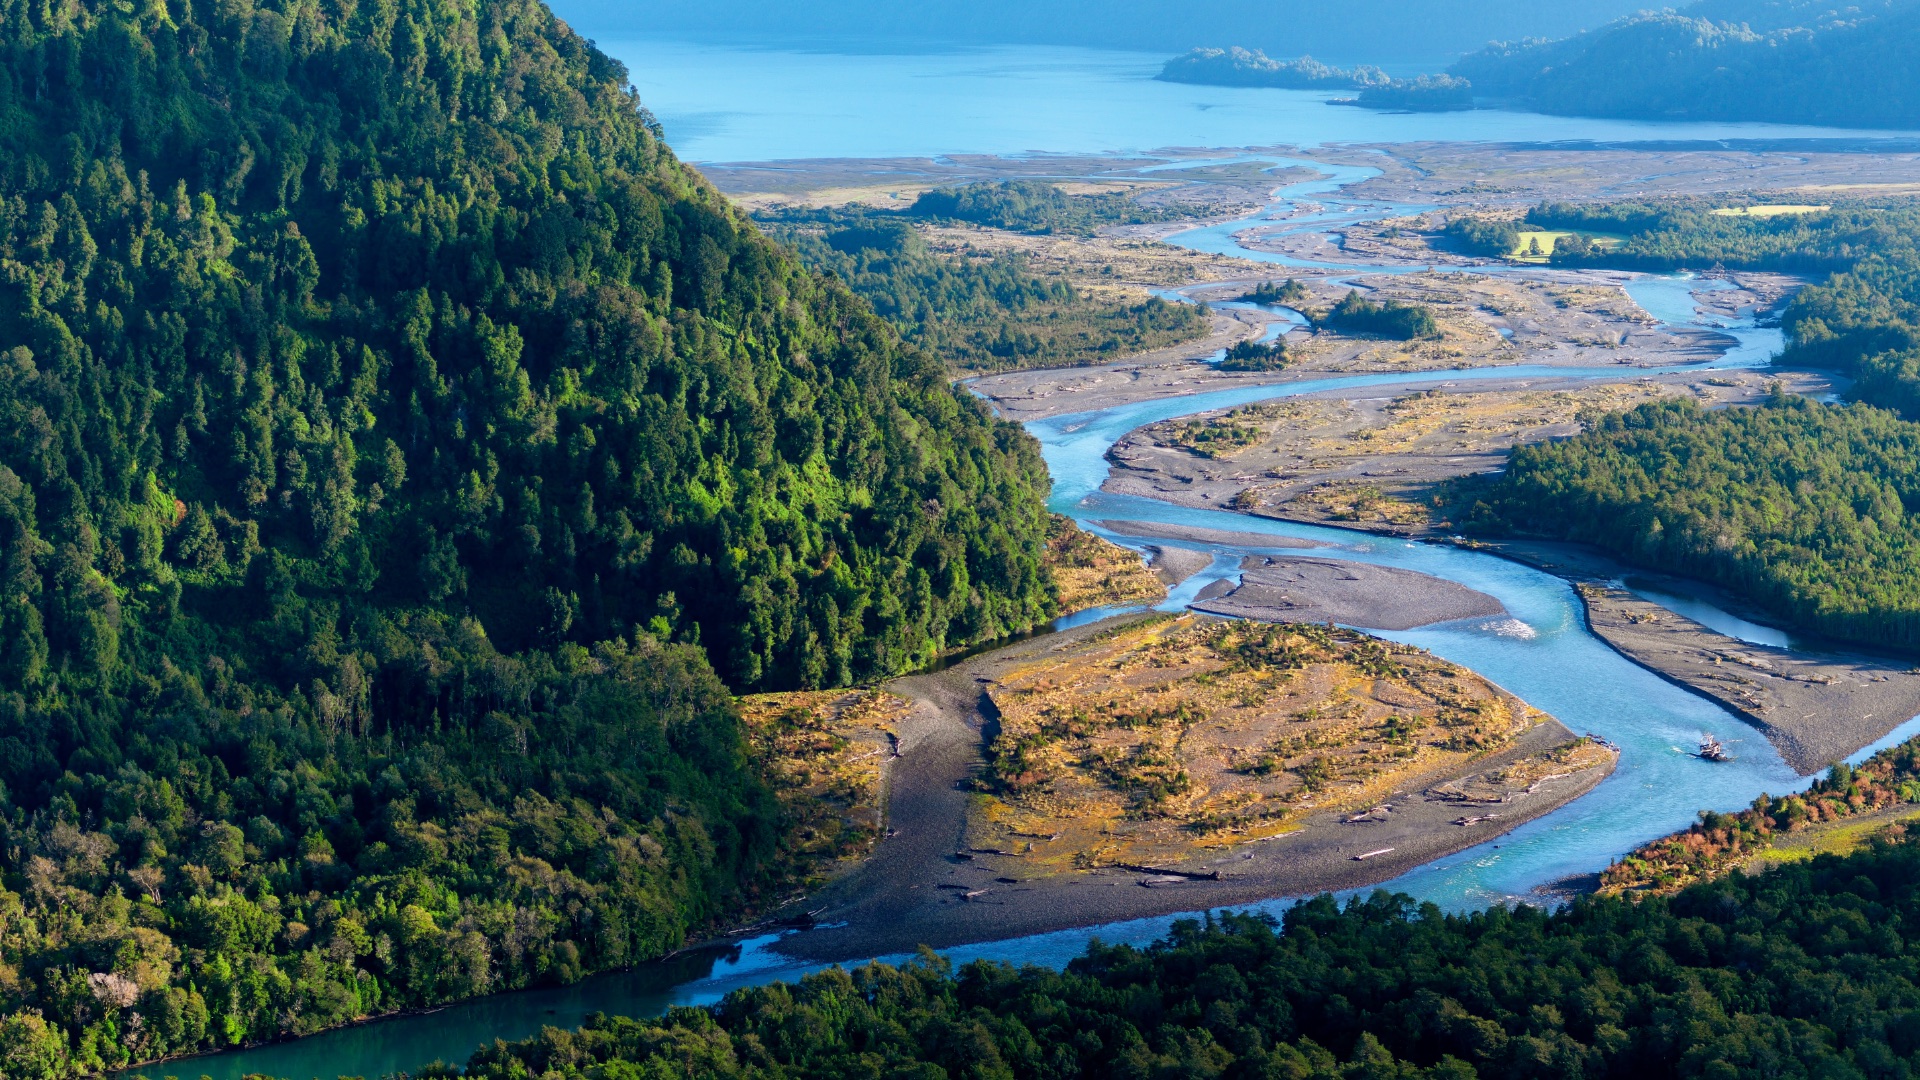
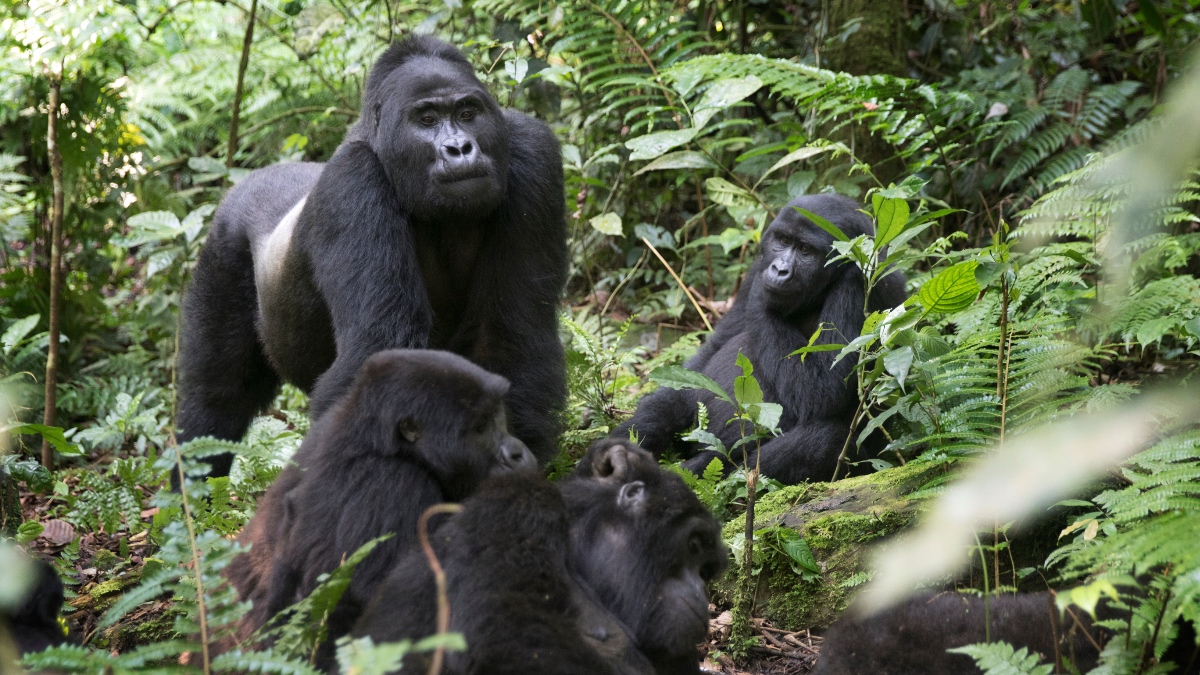
Would you protect Africa’s rarest gorilla from poaching in Cameroon? Or restore marine habitats in Patagonia? Perhaps you’d preserve biodiversity in Papua New Guinea and support the local Indigenous Peoples and local communities who steward these landscapes?
Jonathan Palmer, director of conservation technology at Wildlife Conservation Society (WCS), is helping WCS supporters explore such questions, showing them how and where their contributions will make the greatest impact.
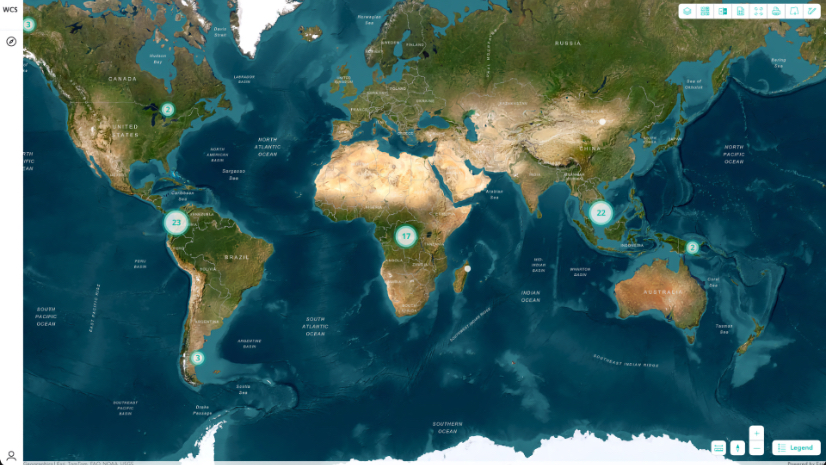
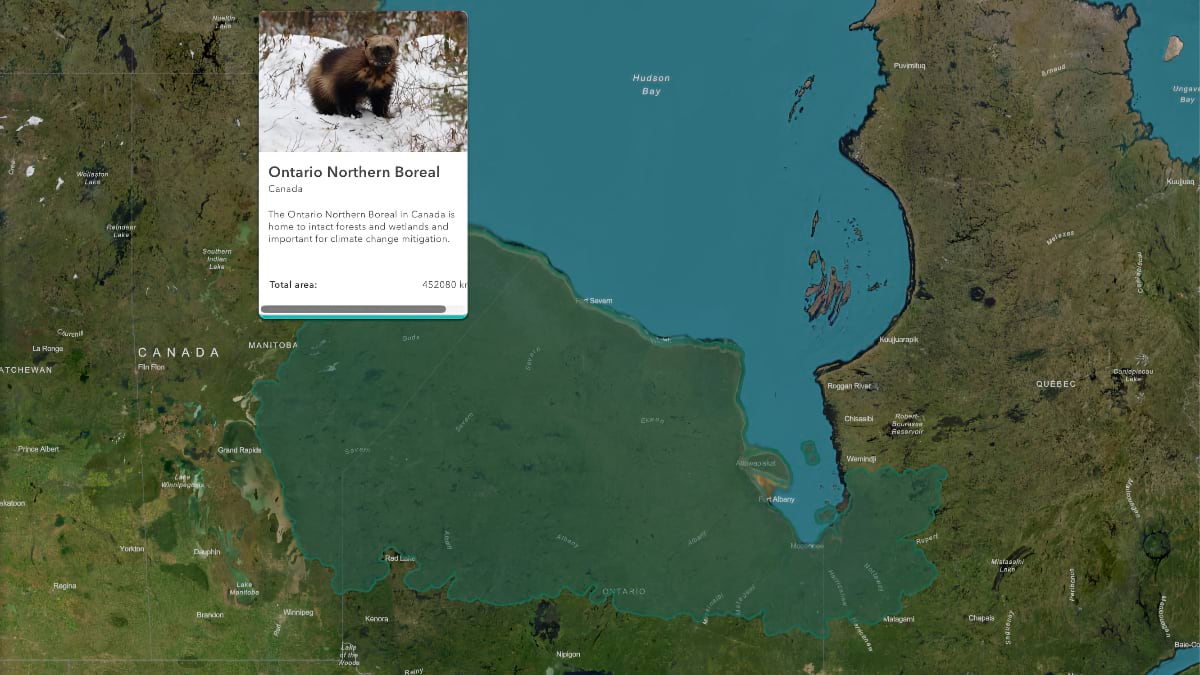
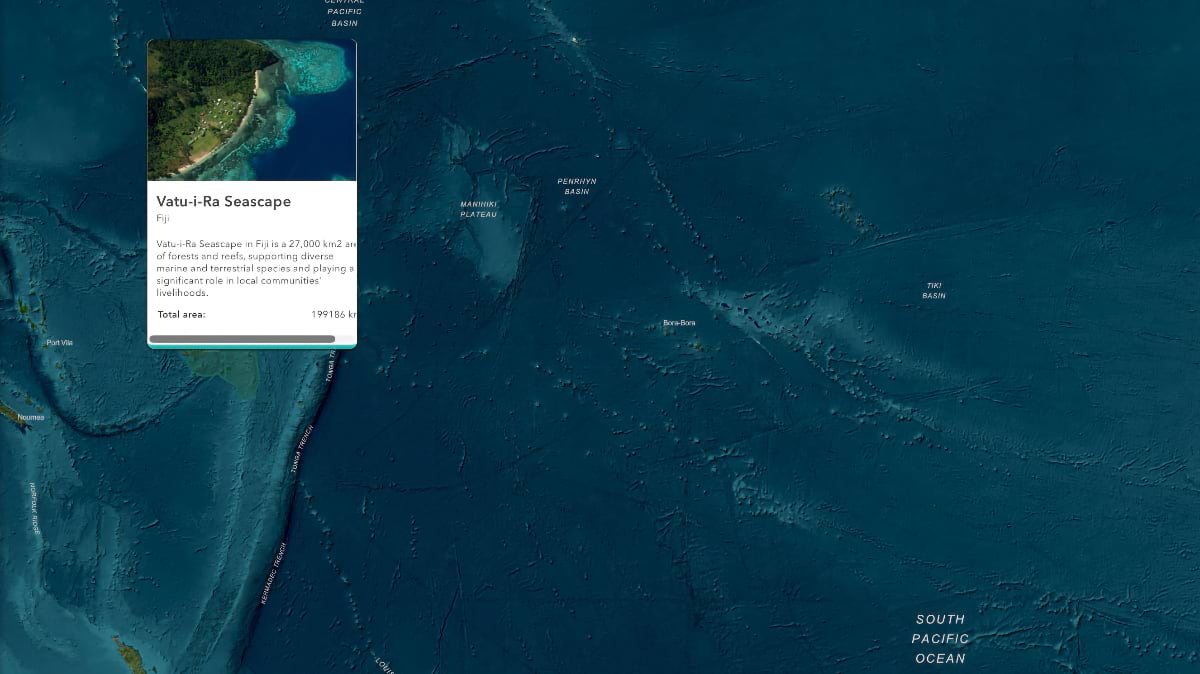
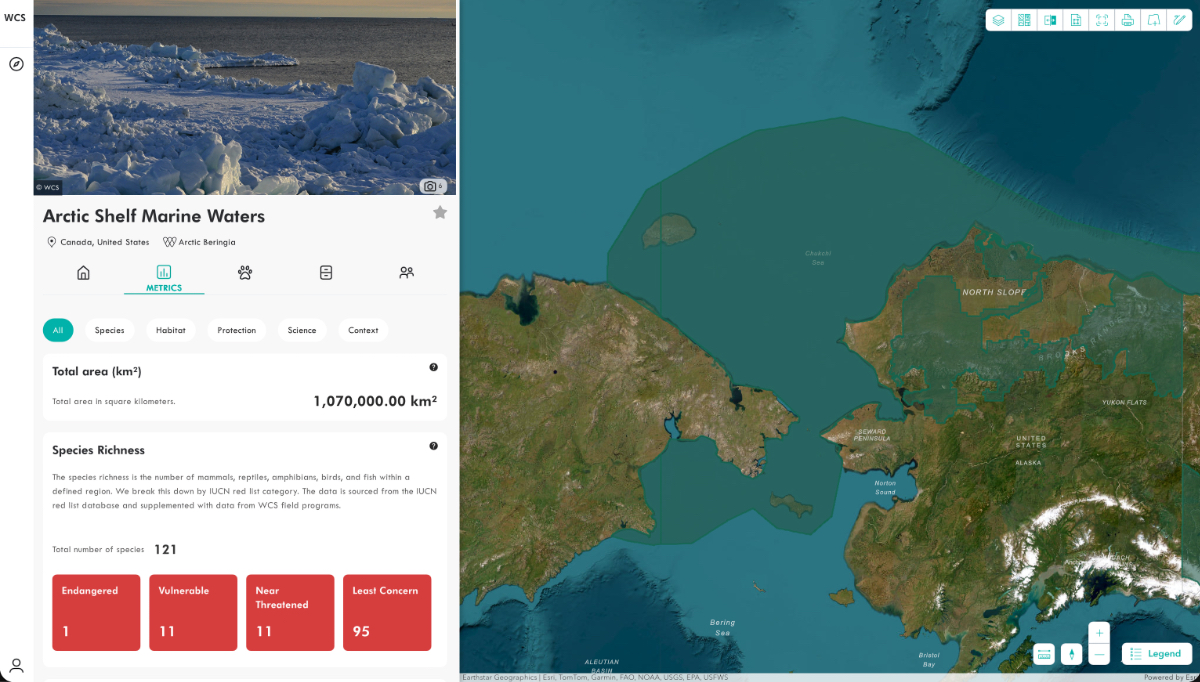
Palmer and his team built a map-based dashboard, called the WCS Impact Platform. It provides timely, up-to-date reporting on the organization’s efforts in more than 55 countries around the world. WCS, which has the world’s largest field-based conservation program, tackles threats like deforestation, unsustainable fishing, human-wildlife conflict, and environmental crime. Supporters can click on the map and zoom in to find metrics and data about protected areas and species.
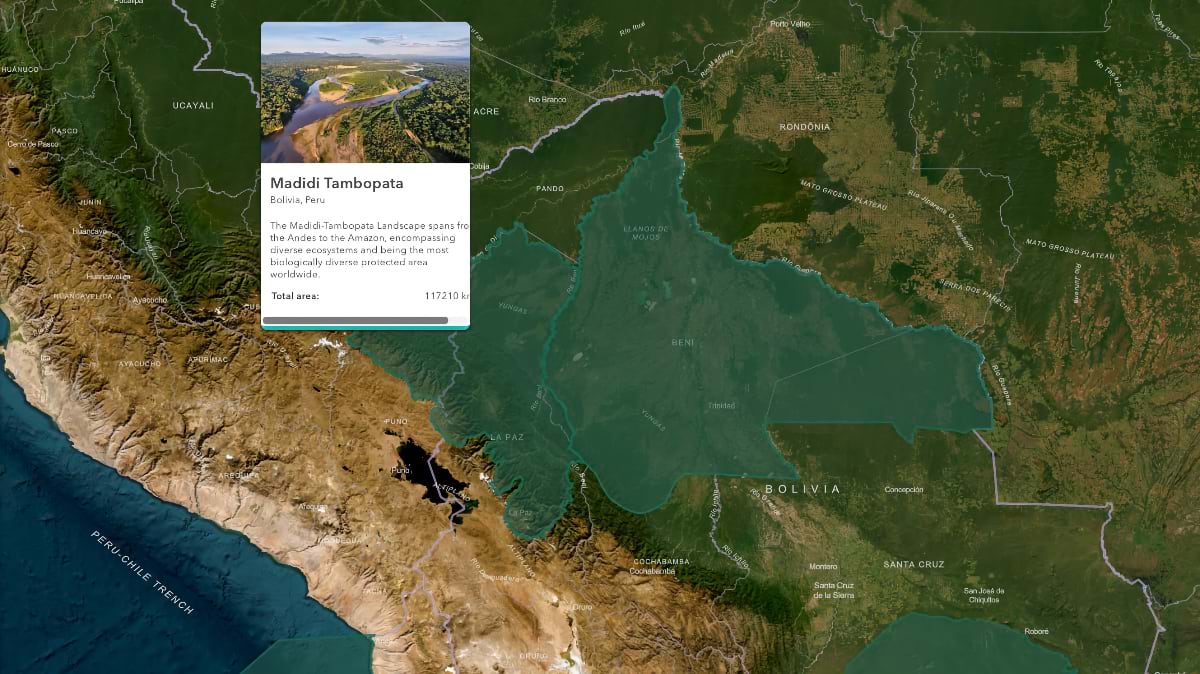
In the past, supporters may have needed to review dense reports and spreadsheets to understand WCS’s work. Palmer wanted a more engaging and intuitive way to share conservation stories—so his team built an interactive map where users can zoom from a global view down to specific landscapes; click on protected areas; and see metrics like species populations, habitat extent, and conservation actions tied to each location.
It can show the full global reach of that work across varied landscapes, every continent and ocean. A single map with all the work on it tells more of a story than any spreadsheet that lists names and numbers can.
“There’s this paradox that a lot of the people who support nonprofits . . . they don’t have time to hear a complex story,” said Palmer. Powered by GIS technology, the Impact Platform gives people an accessible yet richer and more nuanced view of WCS projects and successes. It enables supporters to invest and engage with WCS’s impact on the ground.
“A lot of the information WCS gathers is inherently geographic, which is why the main dashboard is built around a mapping component,” Palmer added.
When developing the Impact Platform, Palmer’s team members set out to meet three critical needs. They wanted to give supporters a clear picture of the impact their contributions make, enable WCS teams to critically evaluate strategies and outcomes across diverse projects, and create a central hub for the data collected by WCS teams and partners worldwide.
For a global organization like WCS, data fragmentation creates real obstacles in the field. A team monitoring wildlife in one region may not know what a neighboring country program has already learned. Rangers track patrol data in one system, researchers log species counts in another, and local partners maintain their own records—with no easy way to see across all of it. Teams may duplicate efforts, miss emerging trends, or struggle to coordinate across regions without a shared view of information.
“We collect masses of information” Palmer said, “It’s inherently distributed across systems. We’ll never get it all in one place.” The Impact Platform solves this challenge by turning all the data WCS gathers into an institutional resource. This means data isn’t just used for individual projects and programs. It’s aggregated to reveal trends at regional and global scales, guiding both strategy and investments.
Palmer’s conservation technology department aims to turn all the data WCS gathers into an institutional resource. This means data isn’t just used for individual projects and programs. It’s aggregated to reveal trends at regional and global scales, guiding both strategy and investments.
“It’s challenging,” said Palmer. “But for a lot of the data that we want to bring together to tell a story, what brings that data together is geography.”
GIS makes that possible—providing a system for gathering layers of information and seeing them together on a single map. For an organization working across 55 countries, that shared view is what turns scattered data into a coherent picture of global impact.
By connecting data across the entire organization, WCS creates connections that didn’t exist before. The system makes information more broadly available across teams, country directors, local partners, and supporters, so insights can be shared and used by the people who need them. Teams can track species trends, assess landscape health, and quickly see who is working where.
Visualization and analysis tools within GIS also make it possible for the entire organization to understand its conservation work at a deeper level. Teams have moved beyond traditional output‑based metrics, such as acres protected or rangers trained. They can connect actions—like expanding ranger patrols or safeguarding key forests—to measurable improvements in ecosystem health, species recovery, and sustained community livelihoods.
WCS has built a legacy of conservation success over more than 130 years.
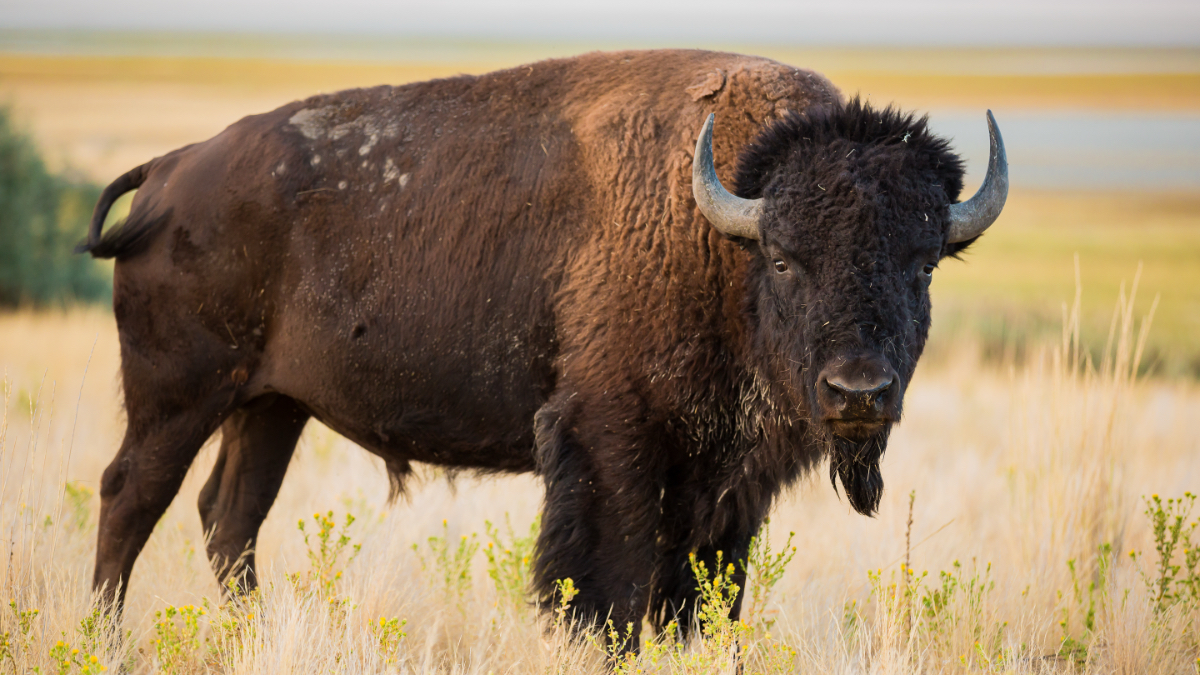
In the early 1900s, with American bison numbering in the hundreds, WCS shipped 15 bison from Bronx Zoo to a reserve in Oklahoma—bison’s first reintroduction in North America. This marked a milestone in saving bison from extinction.
Since 2004, WCS has been working in collaboration with the Government of Thailand to protect wild tigers. WCS’s efforts to support the Thai government have contributed to near 300 percent increase in tiger populations and established a national model for tiger recovery that is being repeated in nearby protected areas.
In 2015, WCS Myanmar began releasing captive-born Burmese star tortoises into the wild; the species was extinct in nature with only a few hundred tortoises left anywhere. Wild populations are now thriving and reproducing.
Recovering a species from the brink takes time as well as focused efforts, steady funding, and the right tools.
WCS has collaborated with governments, Indigenous peoples, and local communities to catalyze the creation of over 580 protected and conserved areas across more than 40 countries, covering over 1.4 million square kilometers. Through strengthened partnerships and a growing understanding of where protection matters most, WCS now has a clear pathway to double this footprint over the next decade.
Palmer has seen astonishing leaps in technology during his career, with specialized software and field-ready apps for every facet of conservation. He and his team have curated and built a rich ecosystem of tools that supports WCS staff around the globe. From camera traps that monitor wildlife movements to digital surveys and mobile forms that rangers use on patrols, the Impact Platform brings it all together in one place.

Ultimately, Palmer sees the Impact Platform as a steppingstone toward a broader, collaborative effort—underway across WCS and partner organizations—to develop a planetary measure of nature’s health.
Much like how the S&P 500 signals the state of financial markets, this metric would offer a clear, accessible way to answer the deceptively simple question, Is conservation succeeding?
A nature health index would support and unify the conservation movement by signaling net positive or negative trends in ecosystem integrity and biodiversity. It would also be a way to track impact, making conservation work measurable—and fundable.
“To achieve global conservation goals, we need more than better data—we need a shared compass for the planet,” Palmer said.
Learn more about how conservation science combined with GIS technology helps protect and restore the natural world.