March 17, 2026 |
Christian Carlson | Urban Planning
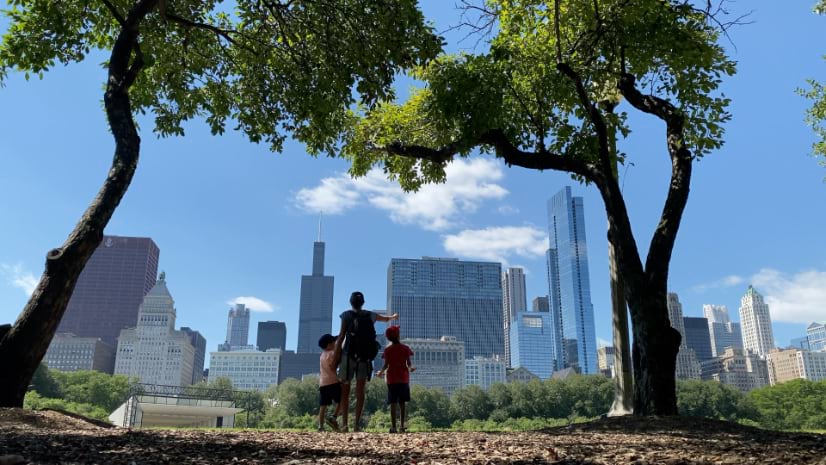
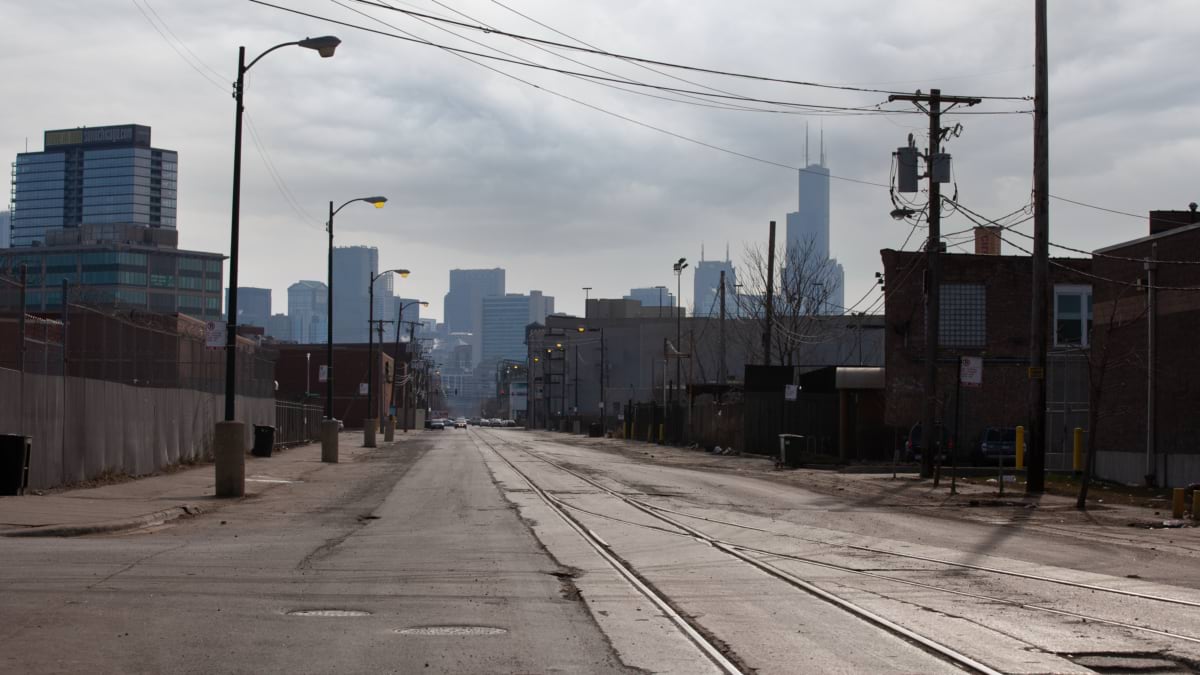
Harrison Garcia noticed the fatigue before he noticed the cause. As a medical student at Northwestern, he spent afternoons walking Chicago blocks with My Block, My Hood, My City, a nonprofit connecting students with neighborhood organizations taking personal responsibility for their communities. Some streets ran thick with shade. Others didn’t, and it sapped his energy. “There would just be open fields,” he said. “I can’t imagine how this affects people long-term.”
That question became an analysis of a decade’s worth of tree canopy changes, published in GeoHealth, tracking tree loss and human mortality across Chicago from 2011 to 2021. Garcia is the lead author. He’s also a fourth-year medical student, currently applying to residencies.
Most of his classmates were headed toward chart reviews and clinical investigations, the more conventional route through a medical degree. Garcia kept circling back to his belief that the built infrastructure shapes our lives and our health, something upstream of the hospital. “The way that we choose to design our cities is much more directly affected by people,” he said, “and has very direct health outcomes.”
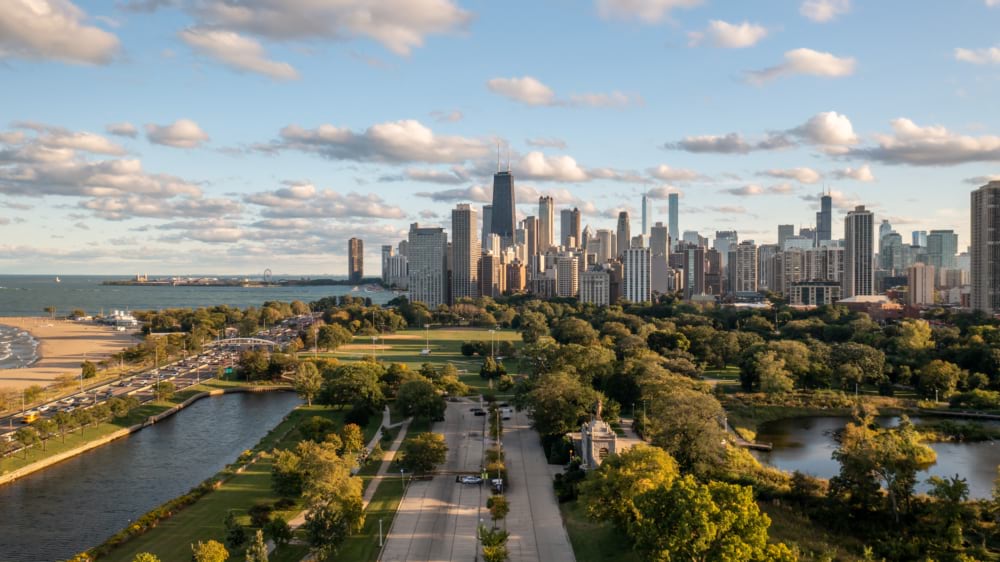
The built environment, in his view, is never really an accident. “It’s all being intentionally created by people,” he said. “A lot of the choices for why areas are the way they are—it’s not just coincidence. It’s the result of deliberate actions and laws and policies that have been created.” Streets get standardized without regard for local ecology. Zoning and permitting decisions outlast the people who made them. Few of those choices were made with tree canopy or life expectancy in mind, and fewer still asked who would end up living with the consequences.
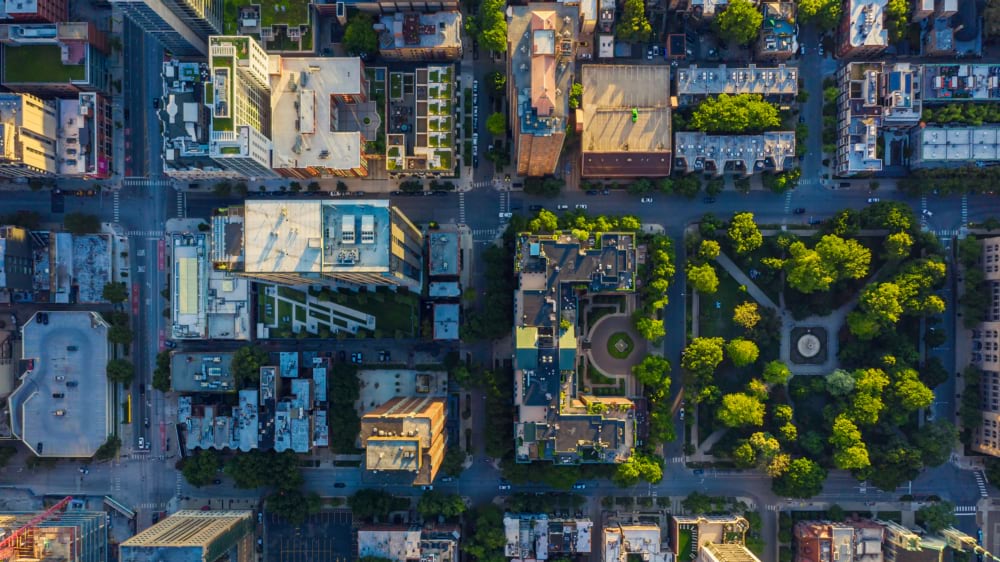
He’d never worked with map data before. Measuring tree canopy change block by block and then comparing that to mortality records meant placing the data on a map. Figuring out how to do that became its own education. Garcia sat down with satellite imagery and started writing Python scripts to pull tree canopy percentages, tract by tract, checking what the numbers said against what he already knew from walking those same blocks. “That was mostly a journey I took on my own,” he said.
That willingness to learn geographic information system (GIS) technology rooted the research in open data about trees and changes in population. Spatial thinking wasn’t common in his clinical coursework, but it made him think holistically about how humans influence their own environment—and how rarely those decisions get revisited once neighborhoods are built.
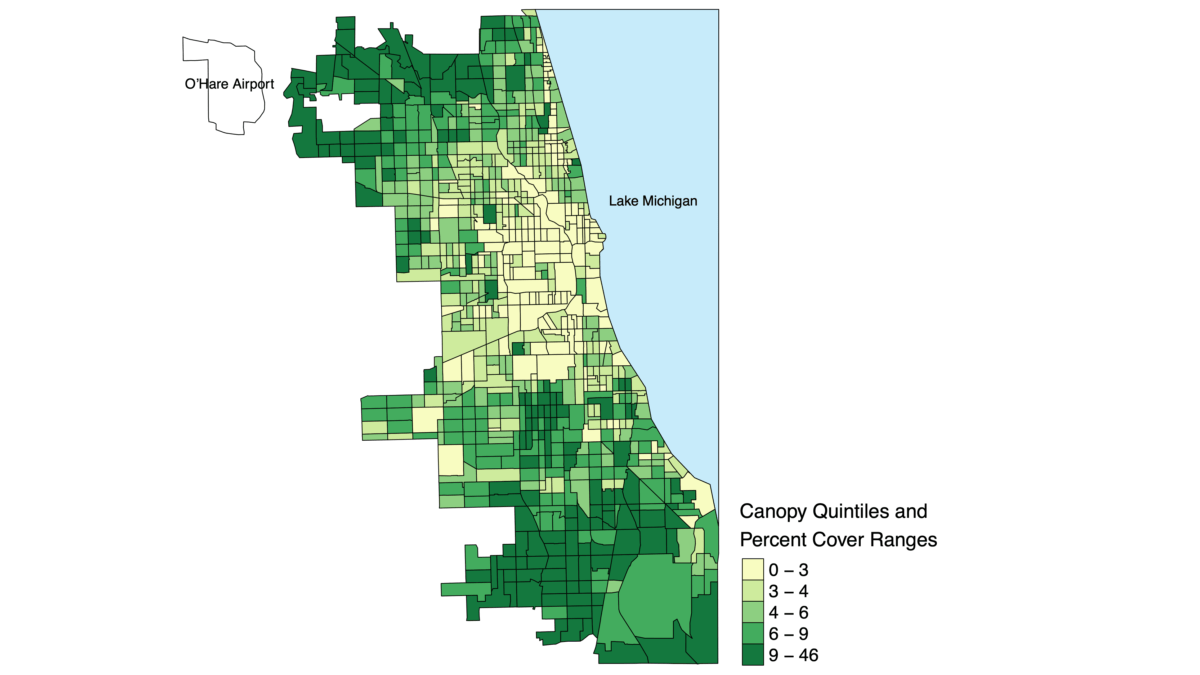
Mapping a single year of canopy is manageable work. Tracking how that canopy shifted, tract by tract, across an entire decade, is a different scale of problem. That part of the study depended on Garcia’s collaborators.
The published paper lists more than a dozen coauthors, spanning Northwestern, the University of Illinois, and Georgia Tech. Some brought statistical modeling. Others brought climate data, demographic expertise, or public health records from city and state agencies. Garcia has been consistent about where credit belongs. “It really was the team that did this,” he said. “It was the culmination of everybody’s hard work, bringing together different people, individuals, and datasets that made this possible.”
Holistic thinking, and imagining what our cities could become, shows up elsewhere in his circle. A colleague at Openlands, a Chicago conservation nonprofit, once described the goal of his own work as a city where you can’t tell where the built environment stops and nature starts. You’re just walking through it, immersed. That stuck with Garcia.
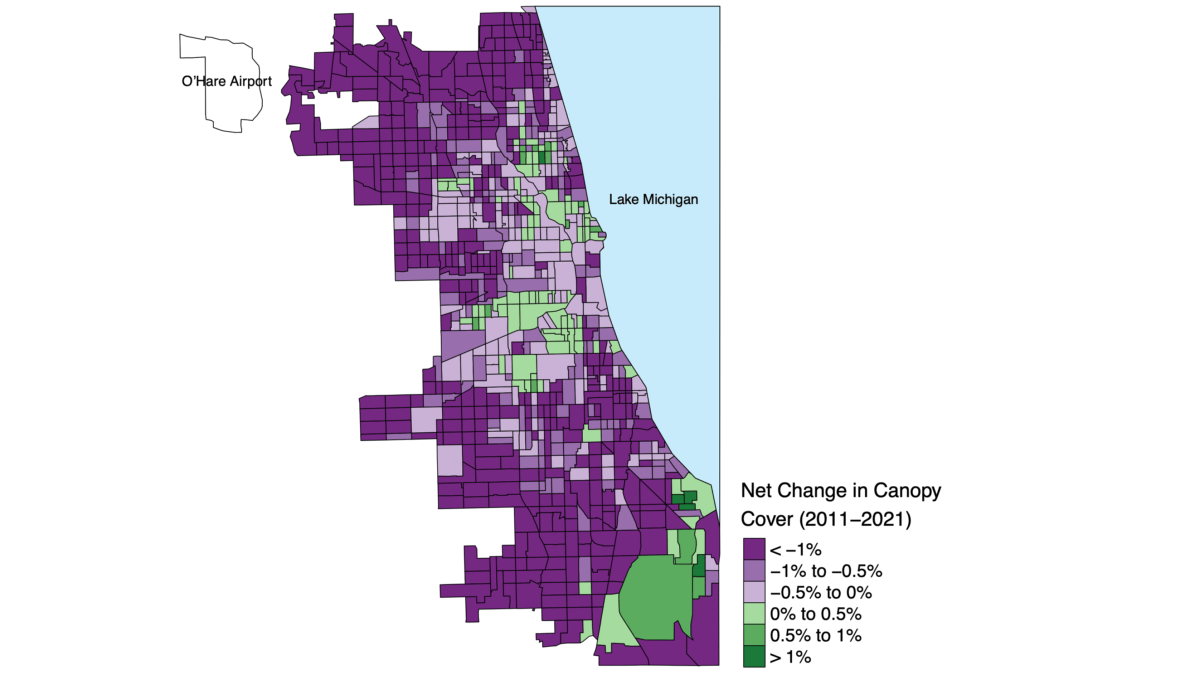
The research team found that a neighborhood’s total tree cover, measured at any single point, showed almost no relationship to mortality. Instead, what mattered was the direction of canopy cover, whether it was expanding or shrinking, year over year.
Each percent of year-to-year tree canopy loss saw death rates increase by roughly 10 percent, with the largest differences showing up in cardiovascular, respiratory, and mental health deaths. Neighborhoods that gained canopy, particularly in the hottest parts of the city, saw the pattern run in reverse. A place could look green on a map and still be shedding canopy year after year, too subtly to see in just a snapshot.
“Trees are not just a luxury,” Garcia said. “They’re very essential health infrastructure.”
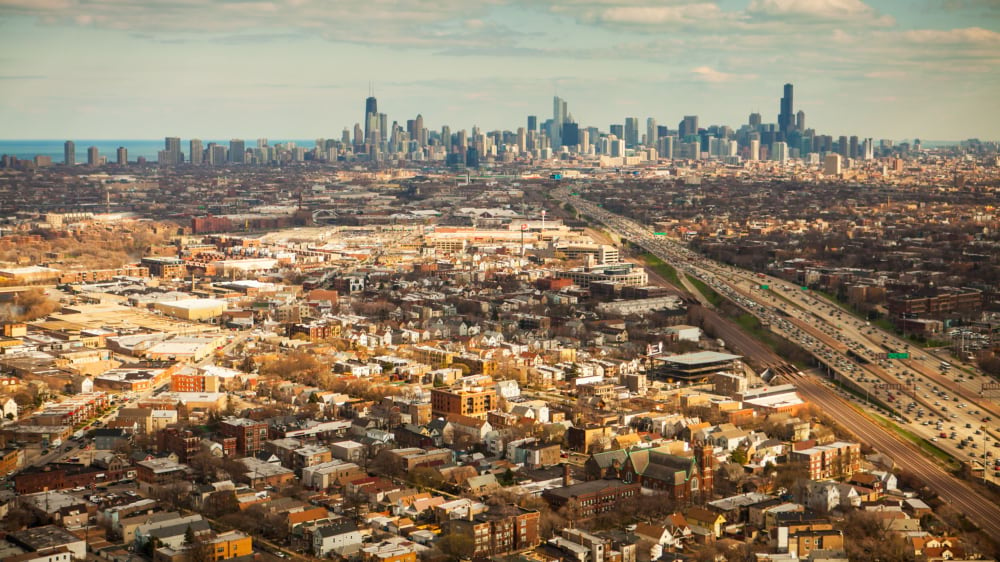
The mental health finding surprised him most—the models showed that each percent year-over-year loss in canopy was tied to a 16 percent increase in mental health–related mortality, the largest effect of any disease category in the study, ahead even of heart disease.
Garcia has watched friends move through residency and come out with a clear-eyed view of what a hospital can and can’t fix. He argues that our neighborhoods are the place to make fixes—and that’s a claim with a door anyone can walk through, not just a physician.
He pointed to the Green Heart Louisville project, a clinical trial that planted thousands of mature trees in low- and middle-income neighborhoods and tracked residents’ health before and after. It’s testing the same relationship with a level of causal proof that observational data alone can’t reach. Garcia wants to see whether the year-over-year pattern he found in Chicago holds in other cities, or whether it’s something specific to how Chicago has invested, and disinvested, in its own neighborhoods.
A single year of tree cover looks like scenery. Watched over a decade, it becomes a warning. The pattern doesn’t show up until someone brings the right layers together—canopy maps, air quality readings, census demographics, temperature records, a decade of death certificates—and holds them against the same set of city blocks, year after year. None of those datasets said much on its own. Stacked on top of each other, they revealed trends and a warning.
Garcia calls that the real opening in the findings—not proof that trees fix everything, but proof that the losses are visible and reversible once you’re looking at the whole picture. “The year-to-year changes, especially in preventing loss, are associated with reduced mortality, and that means we could actually do something about it,” he said. “In a positive direction, we can help our neighbors and help ourselves as well.”
Learn more about how cities use GIS to manage green infrastructure for environmental health.