
June 4, 2019 |
Ben Conklin | Public Safety
October 27, 2020
Hurricane Delta made landfall in Louisiana in mid-October, resulting in two casualties, flooding neighborhoods, and leaving thousands of residents without electricity. The storm hit just six weeks after Hurricane Laura devastated the same region, and just as power had been restored. With back-to-back hurricanes, the state’s emergency responders have been calling on new models and maps to anticipate where help will be needed most.
Hurricane Delta—the third to hit the state this year, and the fourth major storm—left a deluge of more than 15 inches of rain that damaged homes and businesses already reeling from Laura’s winds, which tied an 1856 storm for the strongest gusts to hit the state.
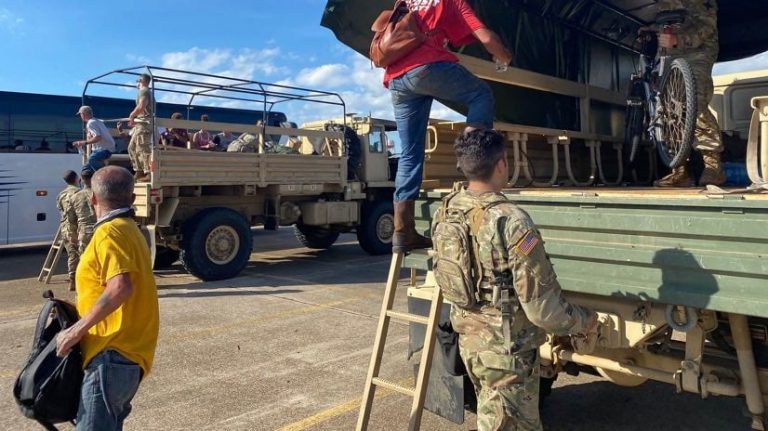
With a hurricane bearing down, Colonel Greg St. Romain, commander of Louisiana National Guard’s 225th Engineer Brigade, used maps informed by a new predictive model to guide his team into position.
“The storm surge map helped me pre-position the right types of equipment for a windstorm versus a flooding event,” Colonel St. Romain said. “We have high-water vehicles, we have boat systems, and we have engineering equipment to clear roads so emergency vehicles and power companies can access impacted areas.”
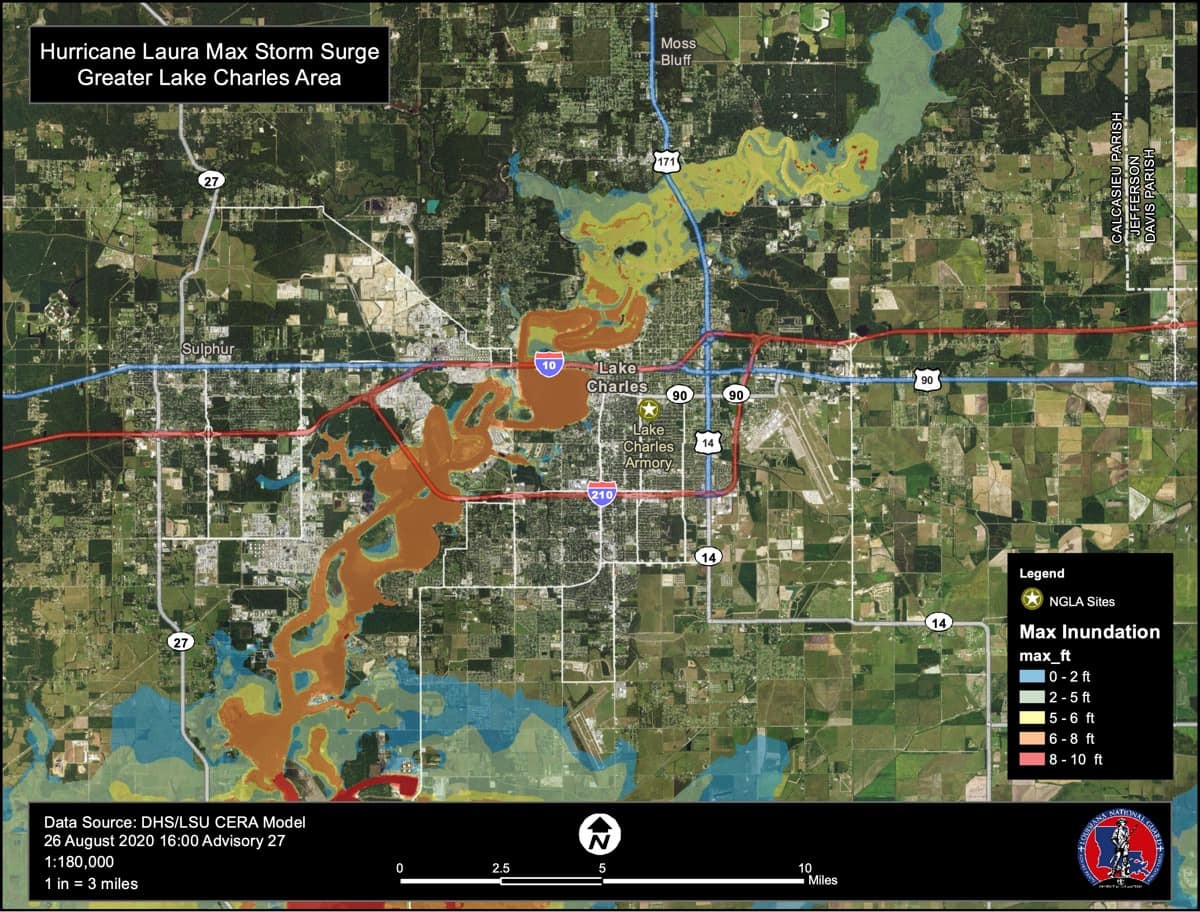
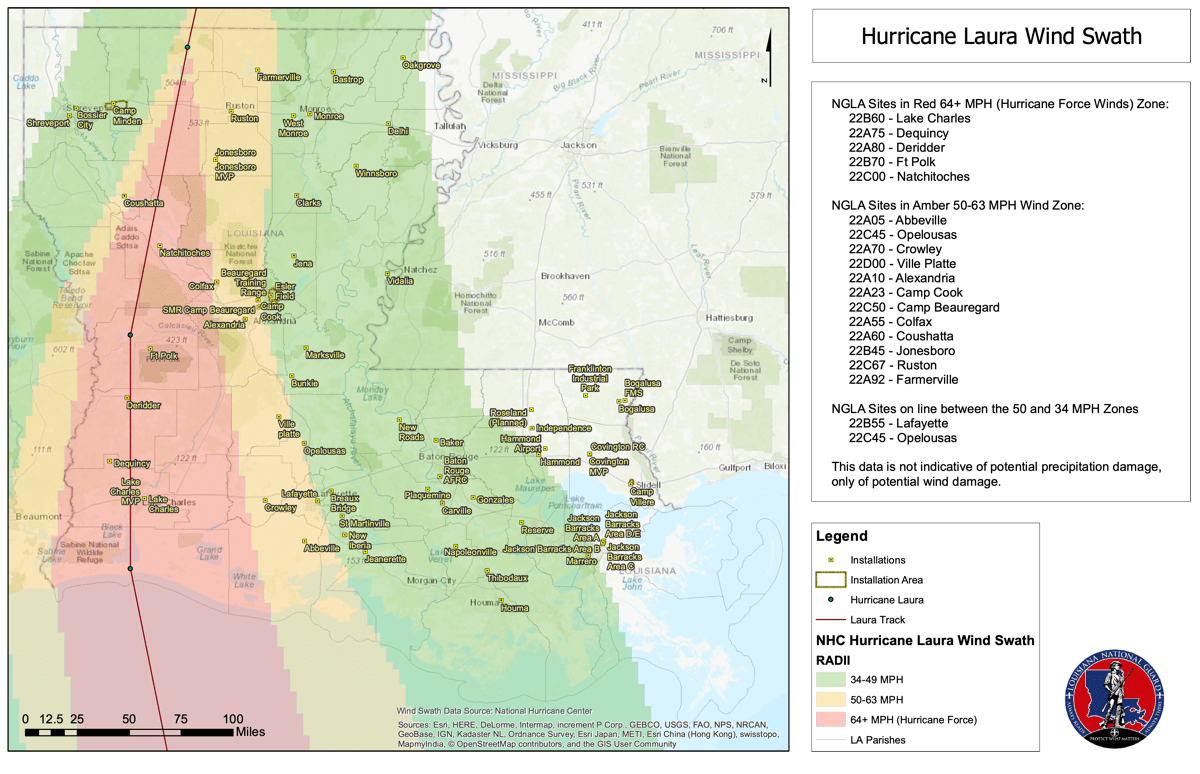
The maps, showing where wind would cause the greatest damage, were developed using models built with a geographic information system (GIS). During Hurricane Laura, the standard storm surge model showed significant flooding for areas near Lake Charles. However, as the hurricane approached land on August 28, 2020, a high-resolution storm surge model coupled with a consequence model revealed high winds as the greatest threat.
“Time is of the essence, and having the right tools and the right data, is essential to make effective personnel and equipment decisions,” Colonel St. Romain said.
The consequence model was developed at Louisiana State University (LSU), born from the need to bridge the gap between a high-level storm surge model and an understanding of local impacts. It uses the high-resolution Advance Circulation (ADCIRC) model of storm surge provided by a team of researchers at the University of North Carolina and Notre Dame University. The model is visualized through the Coastal Emergency Risk Assessment software to predict impacts on an inventory of infrastructure assets, businesses, buildings, homes and people (see sidebar). Together, these models have proven their predictive power.
“When I first came here, Hurricane Isaac had just impacted the state [August 21, 2012], causing massive flooding in LaPlace, which previously hadn’t experienced any significant flooding from storm surge,” said Brant Mitchell, director, Stephenson Disaster Management Institute (SDMI) at LSU. “We went back and looked at the data and analyzed the ADCIRC outputs and it successfully predicted approximately 90 percent of the extent of flooding 48 hours prior to landfall. The model wasn’t leveraged by the emergency management community then, which would have helped the response. So, we set out to provide the output from the model in a manner that can be easily understood.”
Emergency management professionals have trouble looking at complex models in the midst of lifesaving and property-saving measures. They’re busy allocating resources and triaging calls for assistance. Mitchell realized that emergency managers and public officials needed a way to quickly grasp the information in the models.
“Decision makers need tools that tell them exactly what’s going on,” Mitchell said.
The National Weather Service (NWS) model is fast and can be run on a desktop computer. Speed is crucial to understand the potential impacts while meteorologists are developing the hurricane advisory. The NWS’s Sea, Lake and Overland Surges from Hurricanes (SLOSH) model doesn’t have the granularity or resolution of the ADCIRC model that researchers run on supercomputers or the data inputs of the consequence model. “Even with a supercomputer, it takes approximately 90 to 120 minutes to run the model,” Michell said. “That doesn’t provide the National Weather Service sufficient time to integrate it into the development of their advisory.”
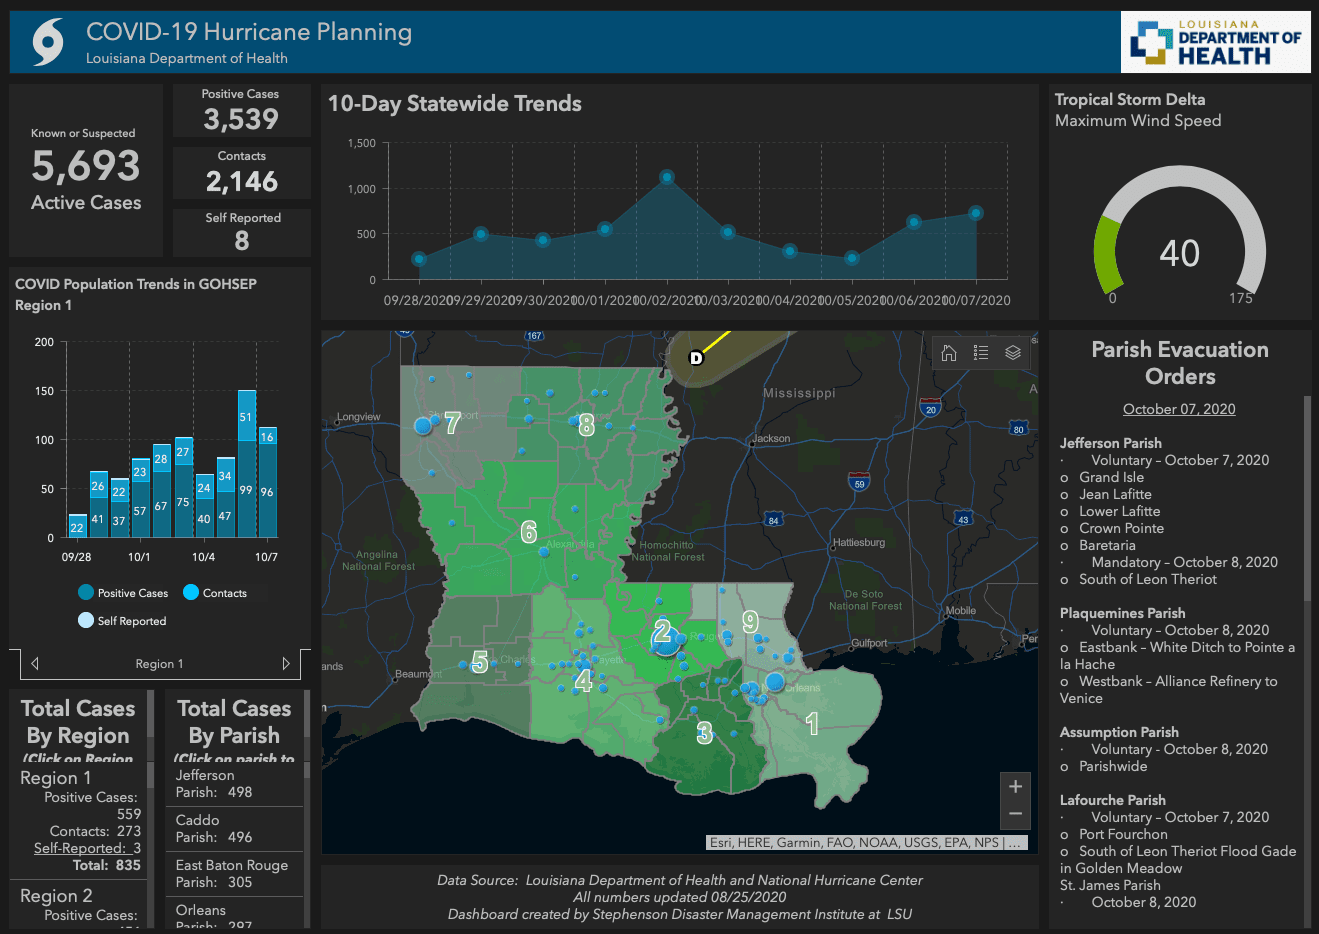
The more granular model fits perfectly with the emergency response mission. To make the details easy to consume and share, Mitchell and the team from SDMI deliver detailed maps via ArcGIS StoryMaps, share data, and print large maps to convey actionable details.
The SDMI consequence model pinpoints a hurricane’s impact on people, homes, businesses, hospitals, and critical infrastructure—details of great importance to first responders.
“The model presents an overview of damages in a manner that is easy to understand,” Mitchell said. “It serves as a decision-making tool on whether to call for evacuations and where to prioritize post-disaster actions such as search and rescue.”
In the case of Hurricane Laura, the ADCIRC and consequence model saved a lot of needless work when it showed that storm surge wasn’t likely inside the city of Lake Charles. With Hurricane Laura designated a Category 4 Hurricane, the National Weather Service warned residents of Louisiana of the potential of up to 20 feet of flooding and life threatening storm surge.
“We have an armory in Lake Charles, which is used as a staging area, and they were talking about relocating those resources,” said Mike Liotta, GIS manager, civilian with Louisiana’s Military Department. “After looking at the consequence model, I was able to update our leadership that our staging area should not be impacted by the storm surge.”
Having the maps and models of the projected damage also helped troops stage the right equipment for clean-up and to stand down the search and rescue mission. It typically takes 24 hours to completely switch missions, but thanks to the predictive view, the 225th Engineer Brigade was ready to go.
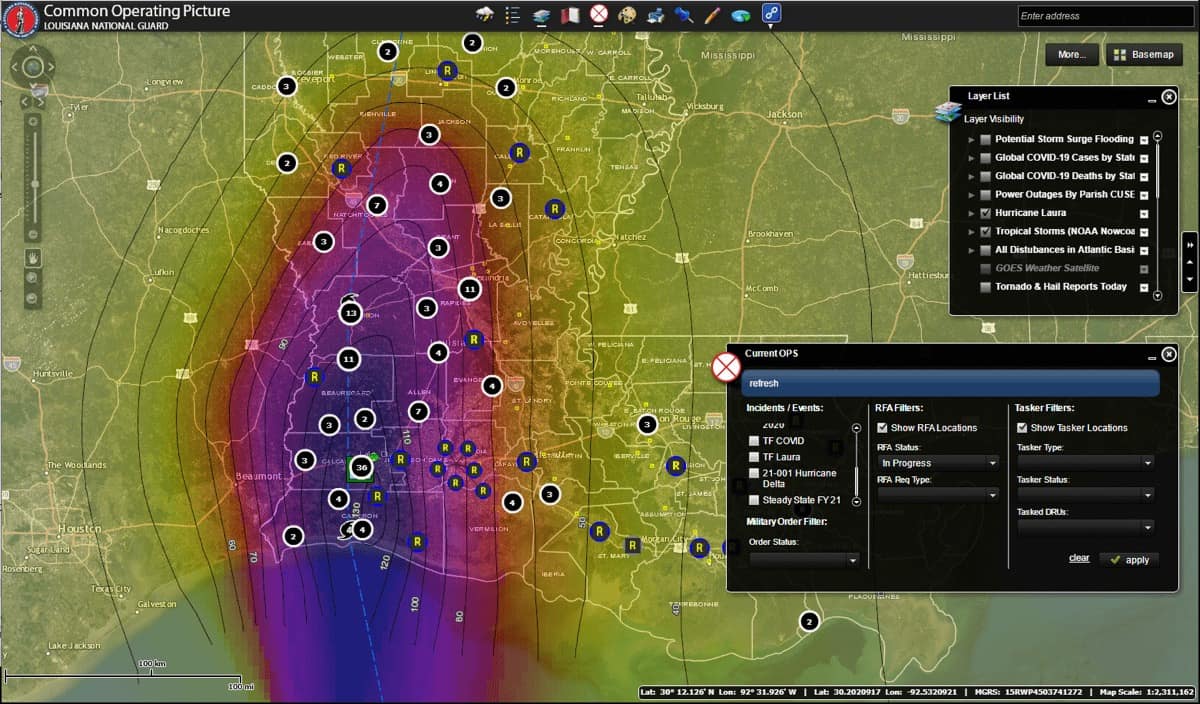
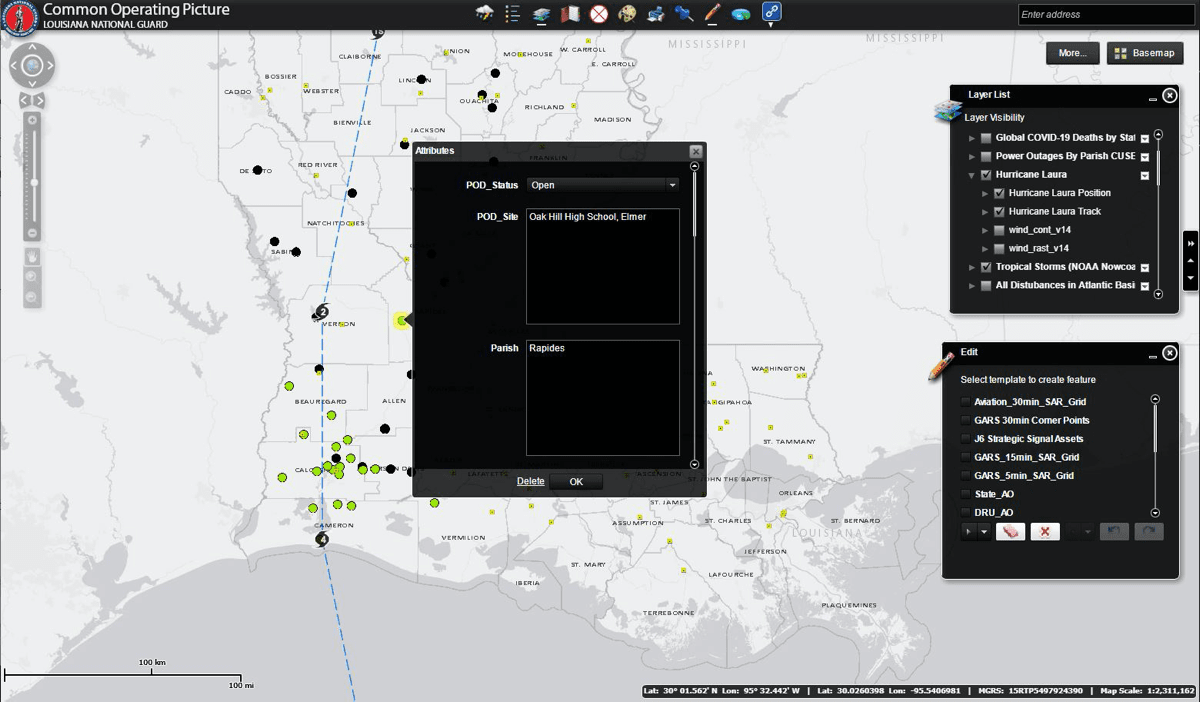
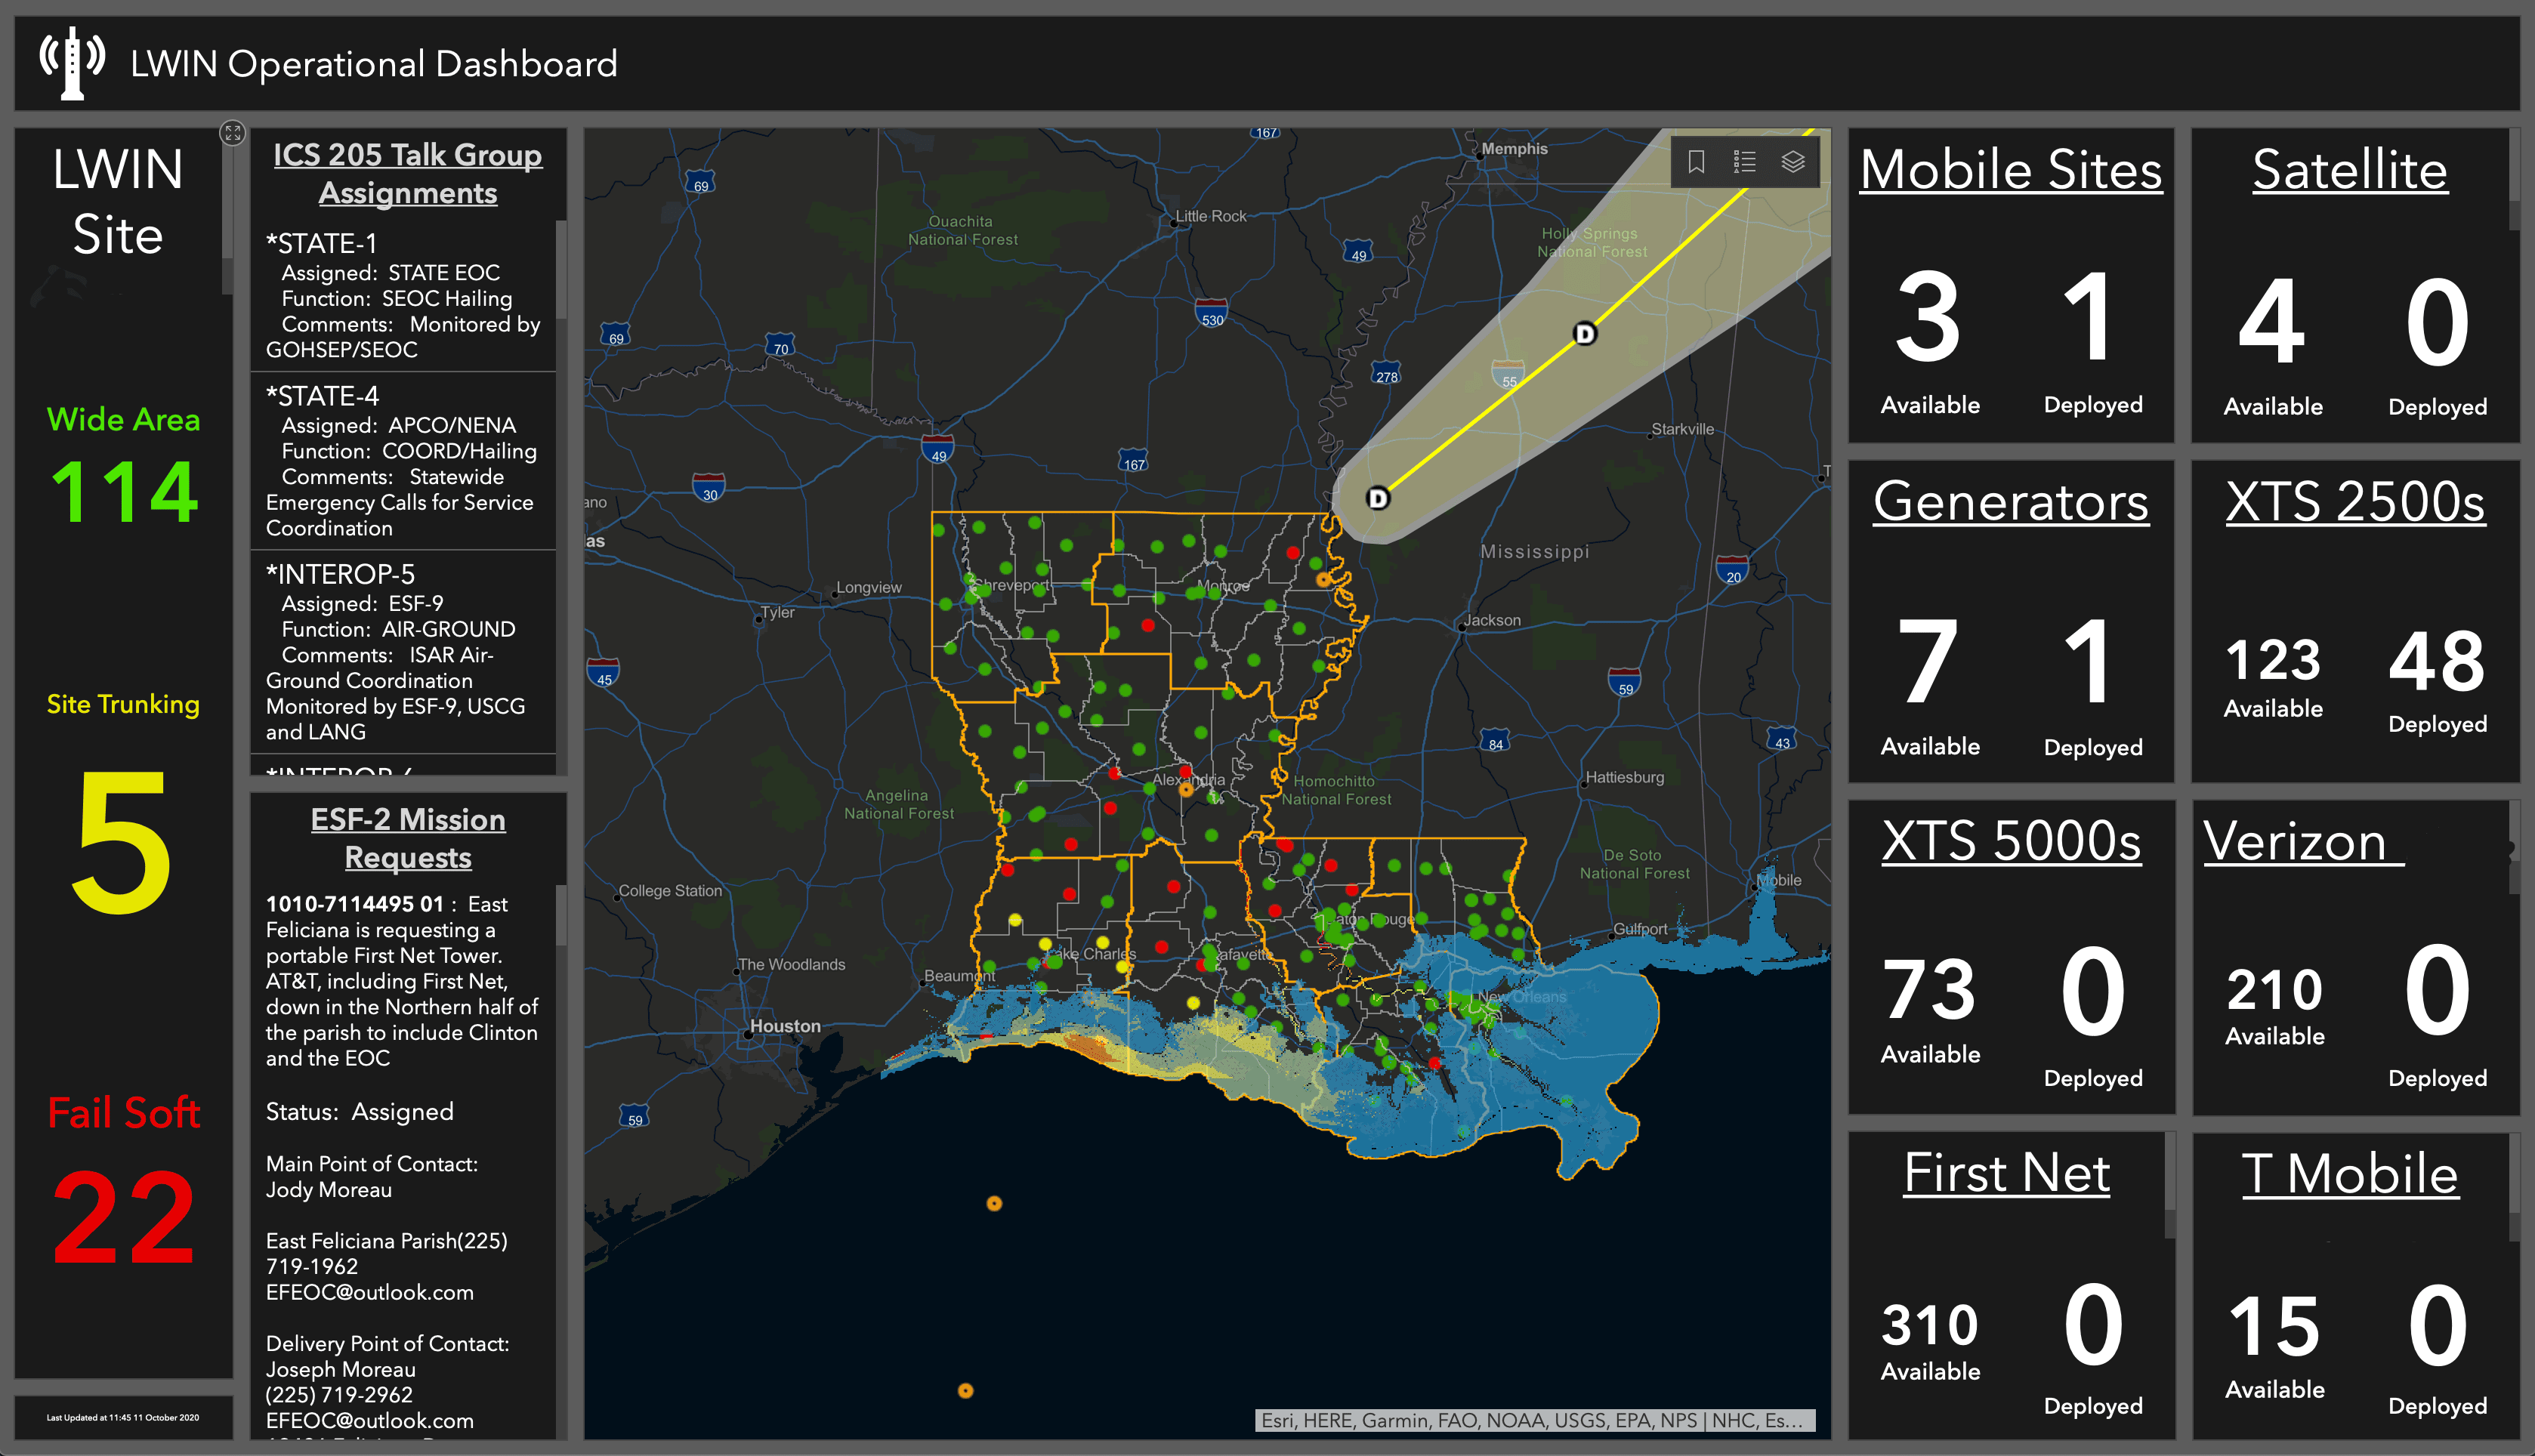
GIS outputs take the form of a real-time common operational picture (COP) within an emergency operation center (EOC) where both Mitchell and Liotta can be found during an emergency. Staff with phones or tablets in the field use apps to collect and sync much of the data that a COP displays. The team also uses GIS to plot outputs of the high-resolution model onto large maps for boots-on-the ground first responders who often work in off-the-grid areas without communication signals.
“I like having something printed in my hand when I leave the office and head to an impact area,” Colonel St. Romain said. “I can lay it on the hood of a vehicle and really study it and understand where I need things to be. I use it as a kind of sand table to maneuver our equipment and personnel.”
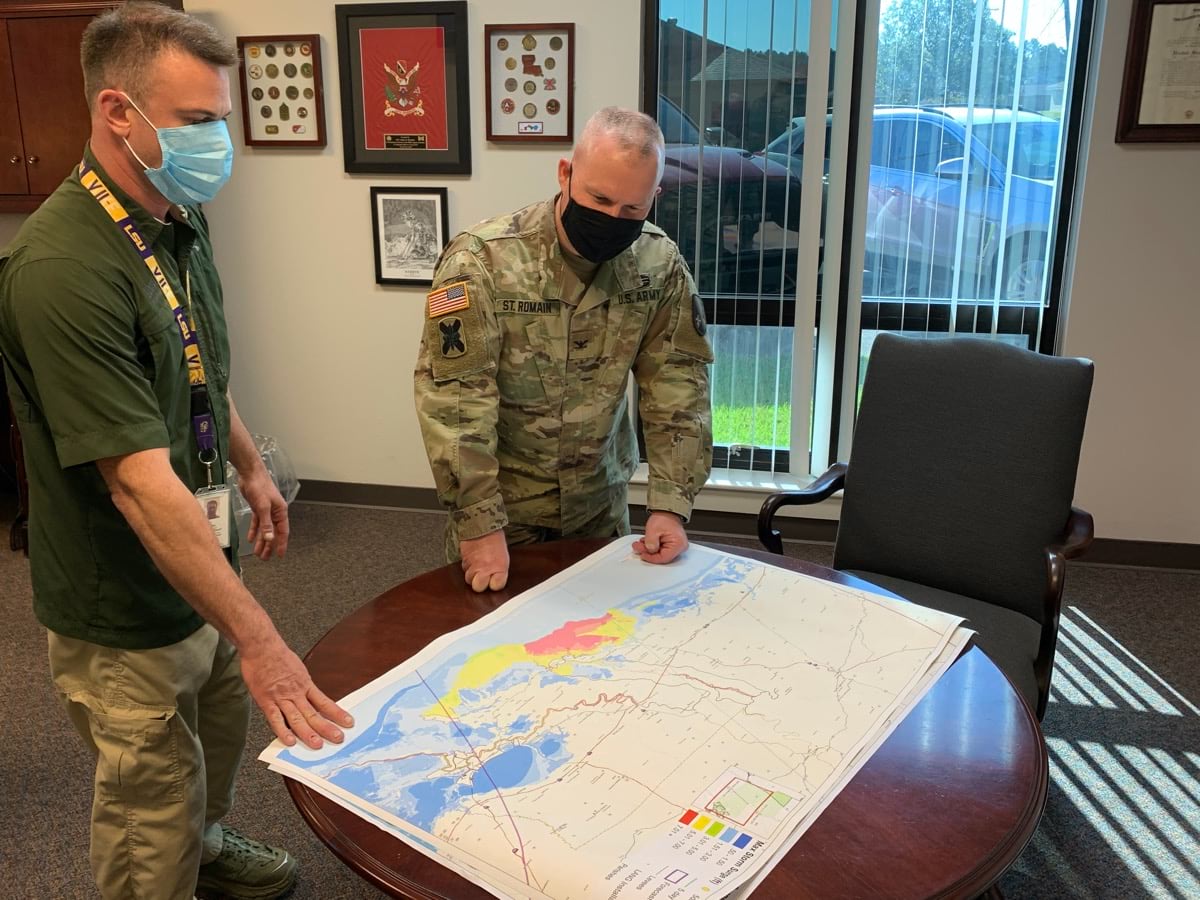
Huddling around the paper map with a pen in hand continues to be a great way to collaborate with a shared context. However, it’s never just one map and done.
Colonel St. Romain was an engineer officer within the ranks for many years, before taking command in May. “I’ve had opportunities to work with our GIS department in the past,” Colonel St. Romain said. “I know what Mike Liotta and his team are capable of delivering. If I’m not comfortable with the incoming information, I reach out to him to reinforce a decision or provide me with more details of an area I’m concerned about.”
After Hurricane Laura left considerable damages, Colonel St. Romain shifted his focus to a long-lasting and far-reaching debris removal exercise, and again relied on GIS.
“If I had an available vehicle, we were utilizing it throughout the event,” Colonel St. Romain said. “Our operations spanned from the southwest coast of Louisiana to the northern parishes.”
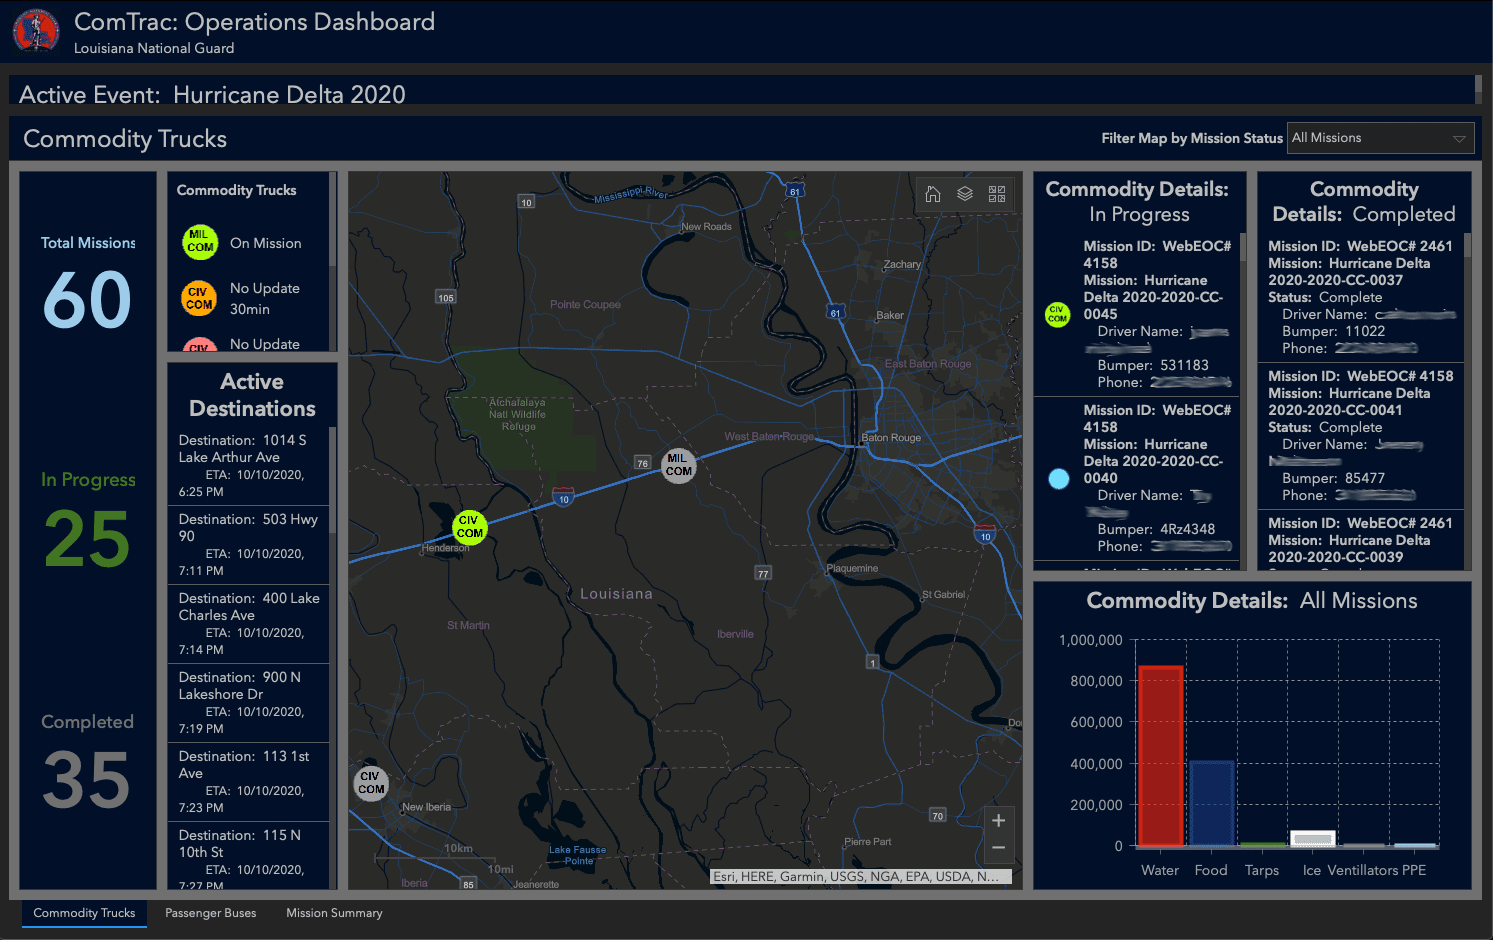
The team from SDMI deployed a real-time truck tracking dashboard at the state EOC to inform and reassure leaders that all equipment was where it needed to be. Mitchell, previously a member of the National Guard and currently a lieutenant colonel in the Army Reserves, designed what’s known as the ComTrac system to track resources as they move after a major disaster.
“The National Guard moves commodities, whether it be food, water, tarps, and other vital resources,” Mitchell said. “ComTrac gives everyone the ability to identify where each truck is located once it leaves the Regional Staging Area.”
The high-resolution confidence model and the ability to track resources in real-time have given the Louisiana National Guard new inputs for better understanding.
“It’s never a guessing game,” Colonel St. Romain said. “We rely on best available tools to make the most educated decisions. The consequence model definitely reinforced our decisions to readjust and pivot to certain parishes.”