
November 20, 2017 |
March 7, 2018
Collaboration Around UCI World Championships Leads to a Safer Community
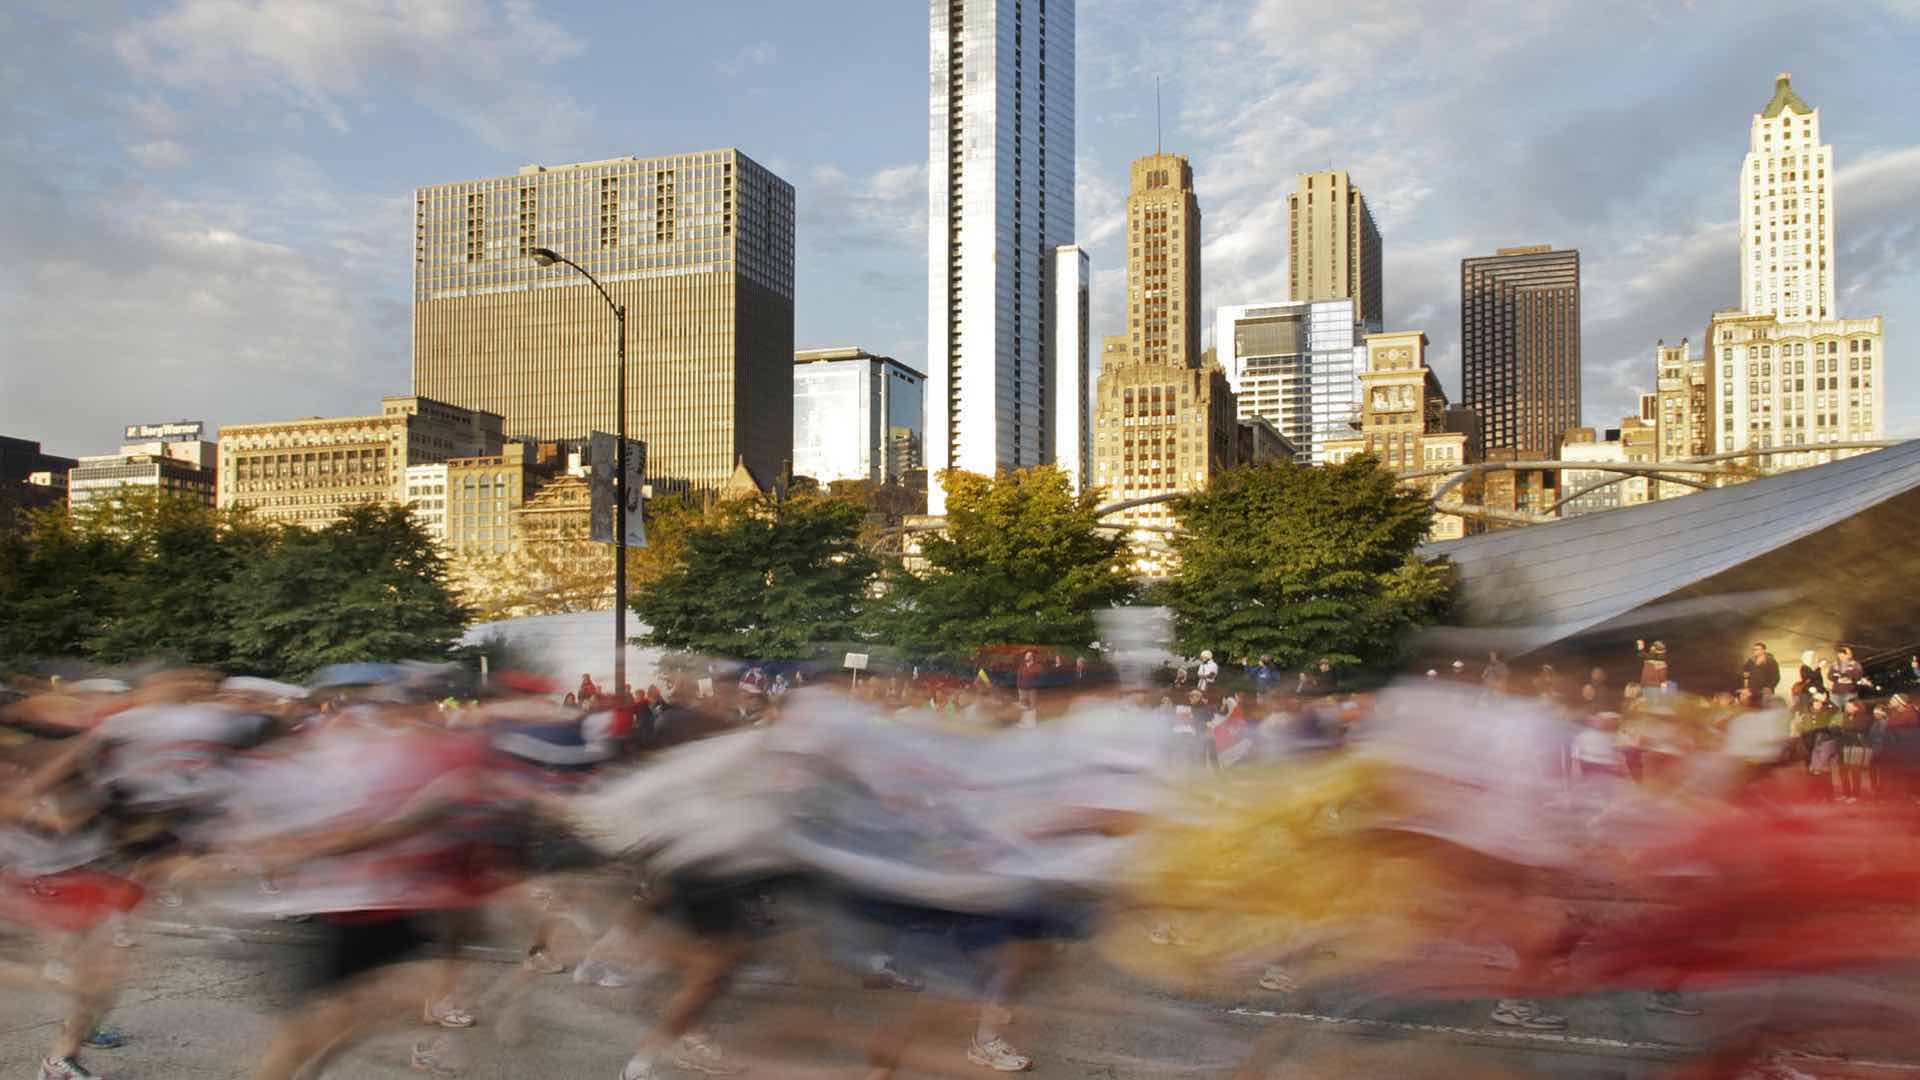
In September 2017, more than 500,000 spectators descended on Bergen, Norway, to experience one of cycling’s greatest annual events, the Union Cycliste International (UCI) Road World Championships. This nine-day event marks the final leg of the coveted Triple Crown of Cycling, alongside the Tour de France and the Giro d’Italia. Elite cyclists compete in 12 races from 3 disciplines: Individual Time Trial, Road Race, and Team Time Trial.
The 2017 UCI World Championships scored as the biggest summer sporting event ever held on Norwegian soil, the single biggest event organized in Western Norway, and the northernmost UCI World Championships. It also blazed the first race finish on top of a mountain, as the 31 km Men’s Elite Time Trial finished with a 3.4km climb up Bergen landmark Mount Fløyen.
To accommodate all 12 world championship races, Bergen’s compact city center shut down for nine days. Road and business closures posed challenges not only to visitors and participants, but also to the citizens of Bergen. How could citizens cross the race courses to access work, shops, and city services? How could emergency services navigate the crowds to quickly respond and resolve incidents like medical emergencies?
The stakes were high for the city as 300 million television viewers tuned in to watch the event live. All eyes focused on Bergen.
With the city in an international spotlight, public safety provided the overriding priority. The complexity of the event required greater cooperation than ever before for Bergen city departments, and highlighted the need to share common information in real time on a digital map. This shared real-time map proved instrumental in connecting city workers from all departments for the event and has helped Bergen become a smarter—and safer—city as a result.

Joint Cooperation
The City of Bergen has dozens of agencies charged with providing safety and security for the community. They all wanted to monitor the races and their own services (like waste management, police deployment, and ambulance locations) in real time during the UCI World Championships. To achieve this outcome for each agency, the city first assembled representatives into one central spot. And so, people from 31 departments gathered in Bergen’s town hall, and the Joint Cooperation Center (JCC) was born.
“All agencies monitored their own systems and reported episodes and incidents from their own organization,” said Snorre Halvorsen, chief of the Joint Cooperation Centre and special advisor for Bergen’s Public Safety and Emergency Response. “It was like the city in miniature within the room.”
The center accommodated 124 people from Norway’s emergency services, traffic control, civil defense, navy, telecommunications, national security, and more. They converged in one place with one goal: to collect and share information during the event. The room buzzed with activity with a huge map of the day’s race course up on a central screen. Police officers rubbed shoulders with power company personnel. With everyone in a single location, it was easier to find whomever they needed to help fix any problem—like finding a stolen car or dealing with a power outage.
Officials didn’t simply gather with each other in the JCC, they gathered around a map. Using geographic information systems (GIS), they worked with Esri distributor Geodata to create and infuse a map with the information needed to manage the event—such as the routes of each cycling race, city assets and services, and live tracking of personnel from each agency as well as the lead and rear cars in each race.
Mapping Plans
City departments used the map to plan for potential emergency scenarios like an injured racer or a bomb threat, allocating resources around rallying points and coordinating how each agency would respond. Traffic planners plotted race course crossing points, mapping out when and where to open and close surrounding roads. Waste management supervisors arranged the distribution of waste bins and public restrooms, coordinating their movement and cleaning as the race course shifted. The Police Department planned the allocation of officers.
Using a common map to plan for the event was new—in the past, each agency had made their own plans without knowing what other departments were doing.
GIS allows users to add each dataset as a layer to the map, and to turn those layers on or off as needed. During the UCI World Championships, this digital map contained over 100 layers of information ranging from emergency plans to the current weather. This multi-layer shared map is widely referred to as a Common Operating Picture or COP. All interested parties share and view information on the COP in real time, increasing situational awareness and enabling quick decision-making about the best way to respond to any problems.
“Every actor within the JCC had their own login to the map and a joint version of the map was shown on the big screen in the room,” Halvorsen explains. “If the waste management team had to add or empty waste bins and they had to cross the course, it was very easy for them to identify where, when and how to do that.”

Rapid Response
During the event, any problems appeared as points on the map. Yellow dots represented a breakdown in services, like a loss of power or a broken water pipe. Red would have represented more serious incidents involving loss of life, of which the city was happy to report there were none.
Halvorsen credits two years of cooperative planning along with risk mitigating measures taken before the event to this successful avoidance of “code red” incidents. During the event, these plans were available to all 31 agencies in the Joint Cooperation Centre and being in the same room provided a high level of situational awareness for any incident that occurred. No incidents escalated into more serious situations. Instead, they were quickly identified, communicated to the proper agency, and resolved. The collaborative efforts of the JCC, combined with accurate location data, extended the reach of law enforcement and enabled record-setting response times.
“We had several incidents involving missing persons, children and elderly people, as happens at any event,” Halvorsen said.
In one example, two children separated from their parents in a crowd of spectators. The parents flagged down an event worker who reported the lost kids to the JCC. The kids’ descriptions were shared in real time, and officers circled around the point on the map where they went missing.
“It normally takes hours to handle, but with so many actors within the room it took just 5 minutes on average,” added Halvorsen.
For those parents, and many other people who found themselves frantic after getting separated during the event, momentary panic turned to relief, quickly.
Public Communication
While the dynamic COP assisted municipal agencies in the JCC, public-facing maps guided Bergen’s general population. The city informed citizens about the businesses and facilities that were shut down and used maps to communicate the nearest open alternative. Paper maps were all that had been used for events before (and still are distributed to citizens without internet access). The interactive digital maps meant that citizens could find information on their own in a form they’re familiar with.
Event planners encouraged citizens to use public transportation during the event. However, if they were walking or had to use a vehicle, they could view a live map showing routes and road closures as well as the current status of the race every day.
As a result, the nine days of citywide shutdown were managed efficiently, and the event was deemed a success by racers, city dwellers, and spectators alike.
In a statement, the UCI reported that the 2017 UCI Road World Championships were the most-watched in history, and that an independent study showed 97% satisfaction with the event, with 80% of visitors likely to return to Bergen in the future.
Cycling initiatives that surrounded the event also put Bergen on track to improve cycling for all citizens. They added new bike paths, promoted cycling as a healthy lifestyle choice, and established a new youth education program.

A Smarter Bergen
Today, months after the event, the people who worked the event miss the close collaboration and the ease of communication around the digital map.
Cooperation between city agencies exponentially increased as city employees formed new working relationships. These relationships were strengthened by working together face to face in the JCC and sharing perspectives via the digital map. Digital connectedness helped city officials work more efficiently, and prepared Bergen for a smarter future.
“What we have created together enables Bergen to handle all types of events in the future,” Stine Skinnes, project manager at Geodata, said.
Lessons learned from the UCI World Championship continue to inspire lasting change. Halvorsen is currently working as project manager to establish a Regional Civil Protection Center that will include a Regional Joint Cooperation Center, a Regional Competence Center and a Regional Research Center for civil protection, risk and crisis management.
“The Regional Civil Protection Center will be the daily life version of the JCC with additional duties,” Halvorsen said. “In addition to being a watch guard of systems and services within the region, it will be a place to train people around the region, and to focus research and innovation on the topic of public safety.”
Listen to this recent Esri & The Science of Where Podcast about how smart cities drive efficiency and engagement using the Internet of Things. Learn more about Esri’s solutions for creating Safe Communities, and the ArcGIS GeoEvent Server that allows you to monitor your most valuable assets on a map in real time for better decision making at any moment.
Photos by Eivind Senneset, Bergen kommune
November 20, 2017 |
November 15, 2017 |

January 11, 2018 |