
June 27, 2018 |
May 30, 2019
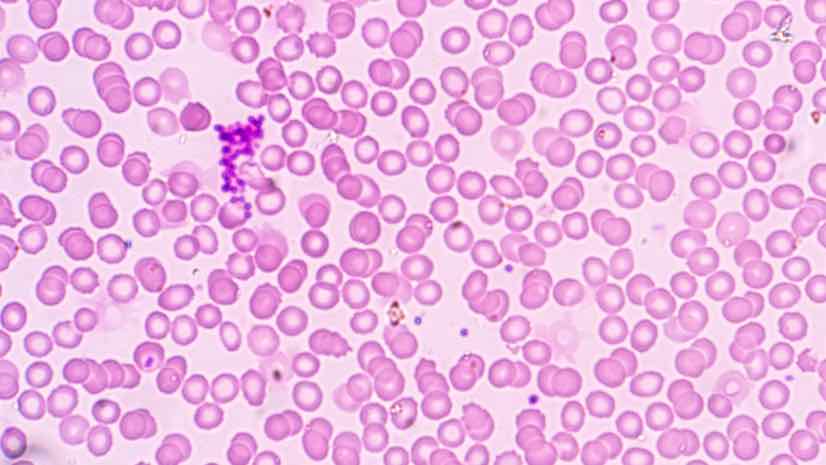
A deadly pandemic could arguably pose one of humanity’s greatest threats. Regular reports from major news agencies detail new lethal flu strains breaking out around the world. Polio and other diseases once nearly eradicated are re-emerging at an alarming rate. Measles cases in the US and elsewhere are skyrocketing to numbers not seen in almost 20 years, according to the Centers for Disease Control (CDC).
Such risks raise the question: What can be done to protect people from dangerous, infectious diseases?
Mapping Outbreaks to Guide Response
With today’s smart mapping technologies, authorities can track outbreaks, decide where to make resources and aid available, and ultimately help prevent pandemics—seeing what others can’t see.
The CDC tracks disease by focusing on place and space—the geographic location of the problem. Officials use maps to visualize and analyze where and why outbreaks occur and where people are seeking healthcare. By using a geographic information system (GIS), they can store, analyze, model, and display all relevant data.
The medical community has long relied on GIS as a framework for analyzing data related to disease trends and understanding public health. For instance, the CDC’s Division of Bacterial Diseases uses it to identify resources needed to detect symptoms and then prioritize response.
Beyond planning the right place to locate healthcare resources and facilities, policymakers use GIS maps, layered with key data, to assess potential disease risk factors, according to the US National Library of Medicine.
Measuring and Responding as Measles Cases Climb
Reports of measles infections are spiking to record numbers in the US this year. Since its declared elimination in the US in 2000, at least 764 cases in 23 states have been reported by the CDC.
The Washington Post mapped the spread of measles, reporting that most who contracted the disease were unvaccinated, but 10 percent who had been vaccinated became infected. While GIS-based analysis reveals that measles cases tend to break out in geographic pockets linked with unvaccinated children, 17 states currently allow parents to opt out of vaccinating their children. Officials identify these regions as high-risk areas for disease spread.
Another group identified as high-risk includes public health officers, airport travelers, and flight crews. If awareness and security dips, outbreaks can spread to highly unvaccinated areas by susceptible hosts through air travel. Medical authorities are using GIS as one safety measure to monitor measles cases and trace outbreaks to the original source.
Faced with the growing measles dilemma, decision makers are working to reduce gaps in services by mapping factors like the time period of the outbreak, the number of people affected and their location. This data and analysis helps scout underserved populations and determine the best placement for new health services.
Stopping the Spread at Borders
Cases of polio, a paralytic and sometimes fatal disease, have decreased by over 99% since 1988 in part because healthcare officials have fine-tuned their response to threats.
When a poliovirus outbreak hit the African country of Cameroon, from October 2013 to April 2015, the Ministry of Public Health’s Expanded Program on Immunization (EPI) mobilized right away.
According to the Journal of Infectious Diseases, EPI workers sought technical support from GIS professionals to improve maps of district boundaries and health facility locations. They wanted to get a clear picture of the disease’s reach and determine where to safeguard against further spread. Since polio is transmitted through contaminated water and food or contact with an infected person, officials feared it could spread to Cameroon’s six bordering countries.
To approach response to polio inside the country, EPI field workers first collected data on Cameroon settlements, hospitals or clinics, and population. EPI staff also set up high-tech polio surveillance using satellite imagery. They added the imagery to their GIS maps so they could visualize the data in its geographic context.
As a result of improved mapping, EPI staff realized previous maps had shown inaccurate boundaries of where the outbreaks were happening. Using GIS for visualization and analysis, the team was able to locate people in need of vaccine or treatment.
For continued vigilance, a Ministry of Public Health team in Cameroon trained on the use of GIS. They will use the technology in response to future health threats.

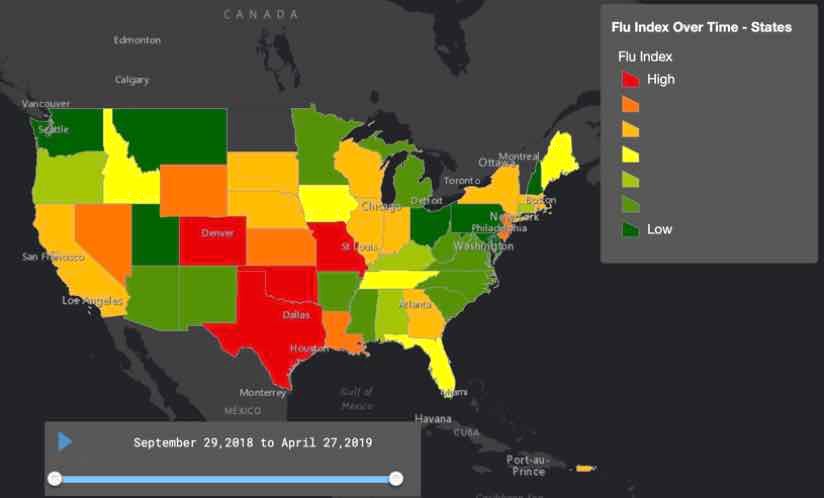
Supporting Yearly Flu Intervention Efforts
Each year when influenza, or the flu, makes its nasty rounds, it causes new complications for medical professionals. Flu virus genes can change at an alarming rate, a phenomenon known as an “antigenic drift.” Because of the flu’s rapid replication, scientists find searching for a cure to be a difficult task.
Knowledge and preparedness tend to be the best defense against this morphing disease. Public health authorities use GIS maps and analysis to study how much or how little an area is affected by flu. They monitor how spread of the virus changes over time and investigate what’s inside or nearby an infected area.
GIS also supports a series of outbreak interventions including: choosing sites for community influenza clinics and vaccination stations; monitoring and evaluating the impact of vaccination clinics and stations on the spread of disease; determining where to cancel gatherings or close schools, public places, and public transportation to prevent wider spread; and identifying groups to quarantine or facilities to enforce isolation.
The Science Behind Disease Prevention and Intervention
Though news stories stream warnings of measles, flu, and other frightening outbreaks, the threats are not going unanswered. Both medical professionals and social scientists are actively working to understand infectious diseases and prevent pandemics. They are using GIS to monitor and map events as they unfold. And they are using the technology to collaborate—a move that provides situational awareness, clear communication, disease detection, surveillance, response and containment.

June 27, 2018 |

April 18, 2019 |

May 23, 2019 |