


April 7, 2020 | Multiple Authors |
August 4, 2020
The international lure of Colorado ski resorts made the state’s remote communities some of the nation’s earliest hotspots for coronavirus cases. Medical centers became overwhelmed as growing case numbers threatened their capacity. In these resort towns, case rates were more than eight times higher than the state average before the ski season was canceled on March 14. It wasn’t long before the virus spread to population centers.
As health organizations around the world continue to struggle to identify, isolate, track, and extinguish the virus, one health department in the Metro Denver area has decided to modernize its approach to contact tracing using a geographic information system (GIS). In the absence of a clear federal or state plan, Tri-County Health Department embraced location technology to investigate with whom an infected person has come into contact, where cases are occurring, and where contacts spent time, as well as introduce automation to speed the response.
“Public health isn’t used to having to report out data on a daily basis,” said Adam Anderson, GIS and data manager at Tri-County Health. “The only thing that’s come even close to this has been fentanyl overdoses where we needed to get the data out as quickly as possible. But even then, it was within a week and not within hours. People need this information immediately. If the data is 24 hours old, it means an infected person could have contact with a lot more people.”
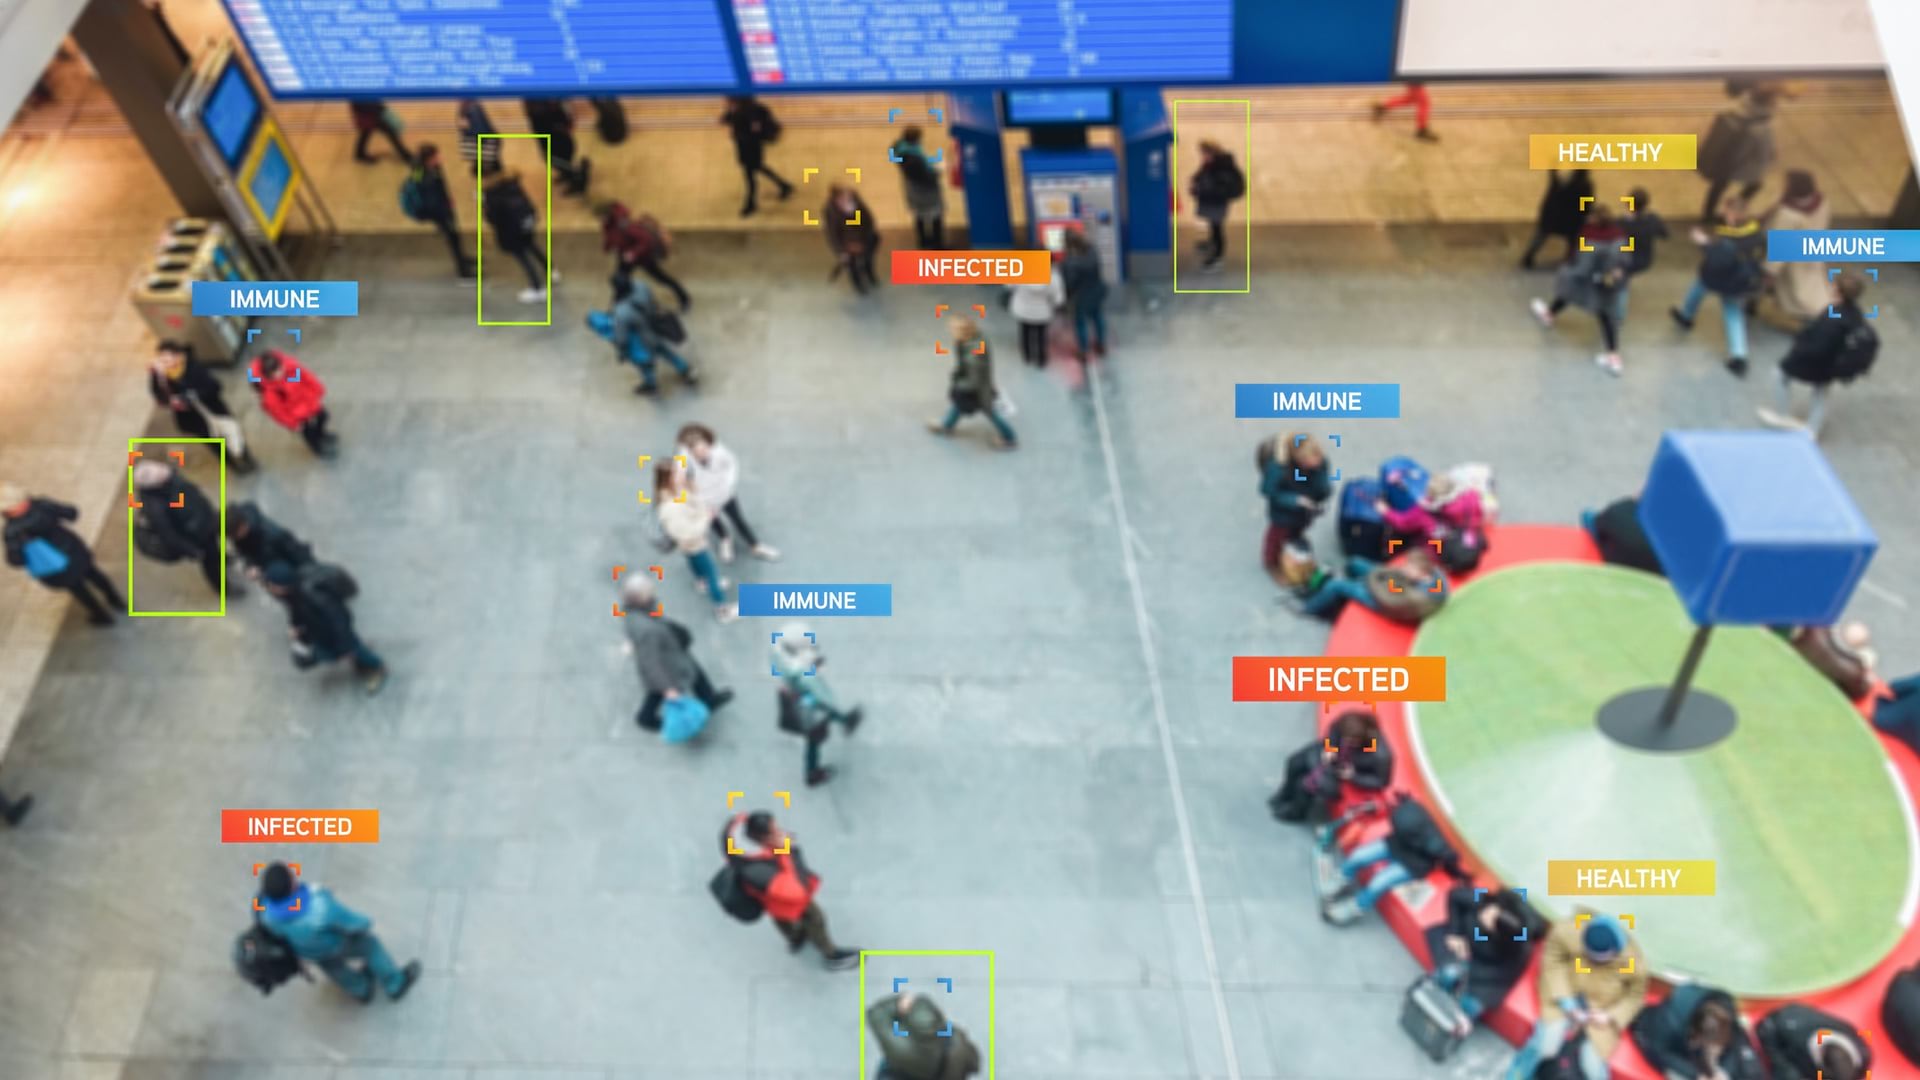
COVID-19 spreads quickly, with a current reproductive number (R0 or R-Naught to professionals) of 2-3. That means one infectious person is infecting two or three people. A more streamlined contact tracing process aims at reducing R-Naught—by finding and informing contacts to self-quarantine to reduce the spread.
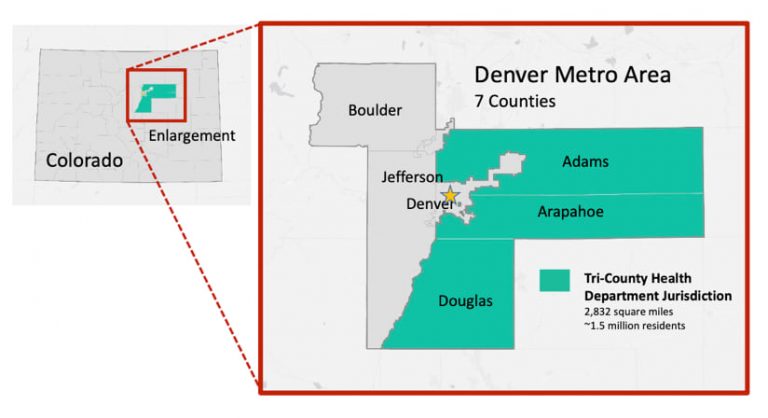
Tri-County Health serves Adams, Arapahoe, and Douglas Counties, which include 26 municipalities. With a population of 1.5 million people within its jurisdiction, it serves half of Denver Metro’s population and roughly a third of Colorado’s population.
Like most health departments, Tri-County Health had not previously undergone a digital transformation for its contact tracing capabilities.
“In the past we’ve worked to trace one or two measles cases or a single case of tuberculosis,” Anderson said. “With just a few really small events, we haven’t had the need for a full-blown contact tracing system.”
Early on, the Colorado state health department created a shared spreadsheet for case investigation. Before long, the spreadsheet contained an unwieldy number of records, and was slowed by the large number of investigators who had simultaneous access to it. The state is now evaluating other options.
“Rather than wait for the state, we decided to build something on our own,” Anderson said. “I advocated for using our GIS because we have a way to collect case data, automate the collection of a very important component—the location—and analyze it. We also wanted to match the speed at which people need information.”
Tri-County Health had a vision for closely integrated workflows to fit the structure of its operations. The solution includes defined roles for everyone who needs access to the information with oversight mechanisms for supervisors, security to adhere to privacy laws, and a shared geographic awareness of cases and hotspots.
“We worked together so tightly as a team,” Anderson said. “Our data group got together with our disease surveillance epidemiologists and laid out what questions need to be asked and what happens to the data when a case comes in.”
The team was made up of contact tracers, case investigators, program planners, data managers, and IT managers who worked to architect a solution using the Esri Geospatial Cloud. Technology components include ArcGIS Survey123 to create smart form-centric workflows and ArcGIS Dashboards to share and visualize case data. Esri Professional Services supported the development through an Esri Disaster Response Program deployment.
With cases still failing to flatten, Tri-County Health was motivated to rapidly pioneer a solution others can build from.
“We tested it as we went along, so it all happened simultaneously or in parallel,” Anderson said. “We’d be working through workflow processes, building it out, they’d be testing it, and then changes would get made all at the same time. There were instances where I was finishing up parts of the functionality five minutes before they did the training.”
Working from home, and with two young children out of school and without day care, Anderson made use of quiet nighttime hours to get the job done. “I looked at my watch, and it said I had an average of 3 hours and 15 minutes of sleep a day last month, but I don’t think that accounted for the nap I took when I put my kids to bed.”
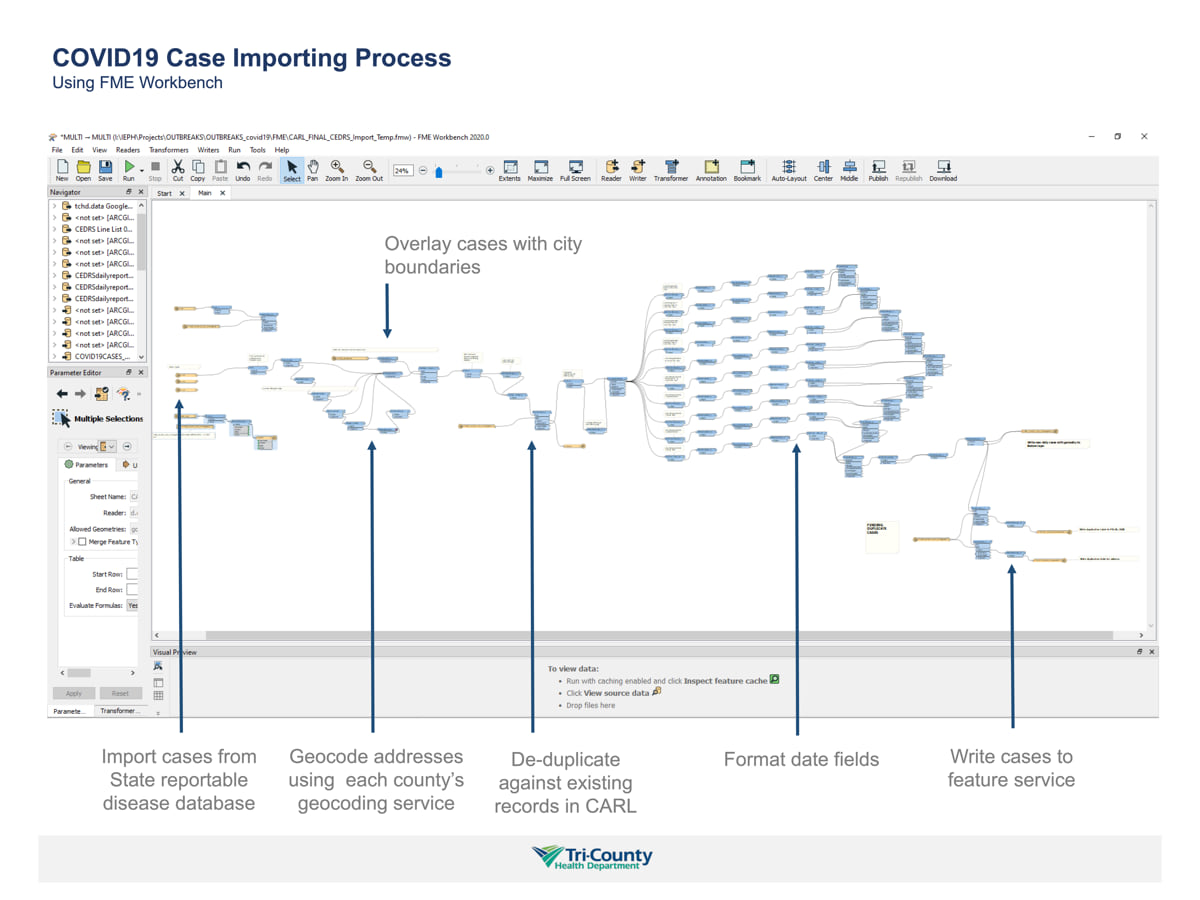
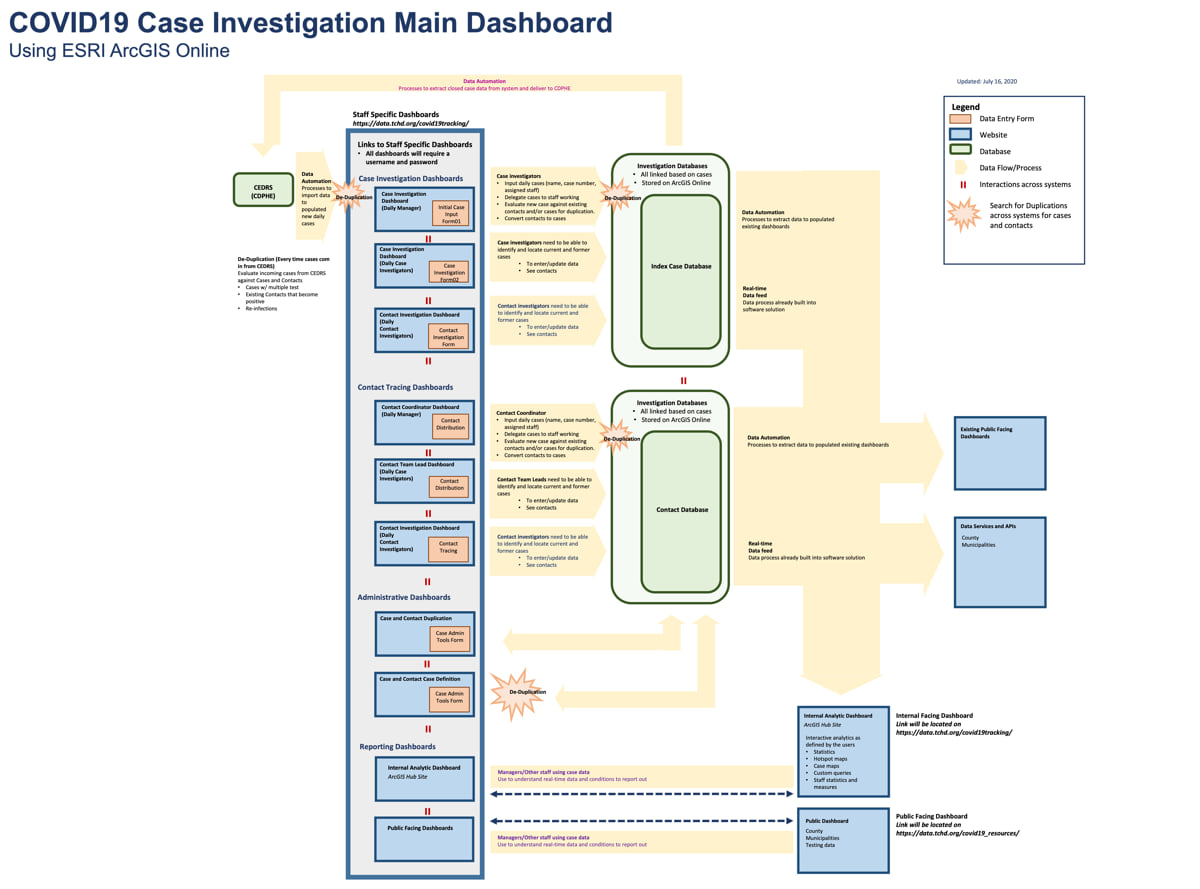
The solution focuses on case investigation and contact tracing with workflow integration for data collection, storage, and dissemination. Keeping all the data in one system was important to Tri-County Health from an efficiency and reliability standpoint. It eliminated parallel systems that can duplicate work or report different totals, leading to misinformation. Having one source of truth for data also means there’s just one system to harden and protect to comply with health data privacy regulations.
Automating data pulls from the state database eliminated the need to retype case information daily within Tri-County Health Department’s own system. Automated workflows check for accurate reporting of every case. For instance, early in the crisis, multiple tests were offered to those displaying symptoms, and Tri-County Health Department found that some people received as many as eight different tests. This prompted safeguards within the system to make sure each repeat positive test aligns with just one individual.
“We’re now having to deal with the issue of duplication across cases and contacts,” Anderson said. “A person that tested positive in March might recover and then get a resurgence of symptoms and get retested or individuals may be getting tested multiple times due to the more widespread availability of tests. We had to work through all of these scenarios on the front end.”
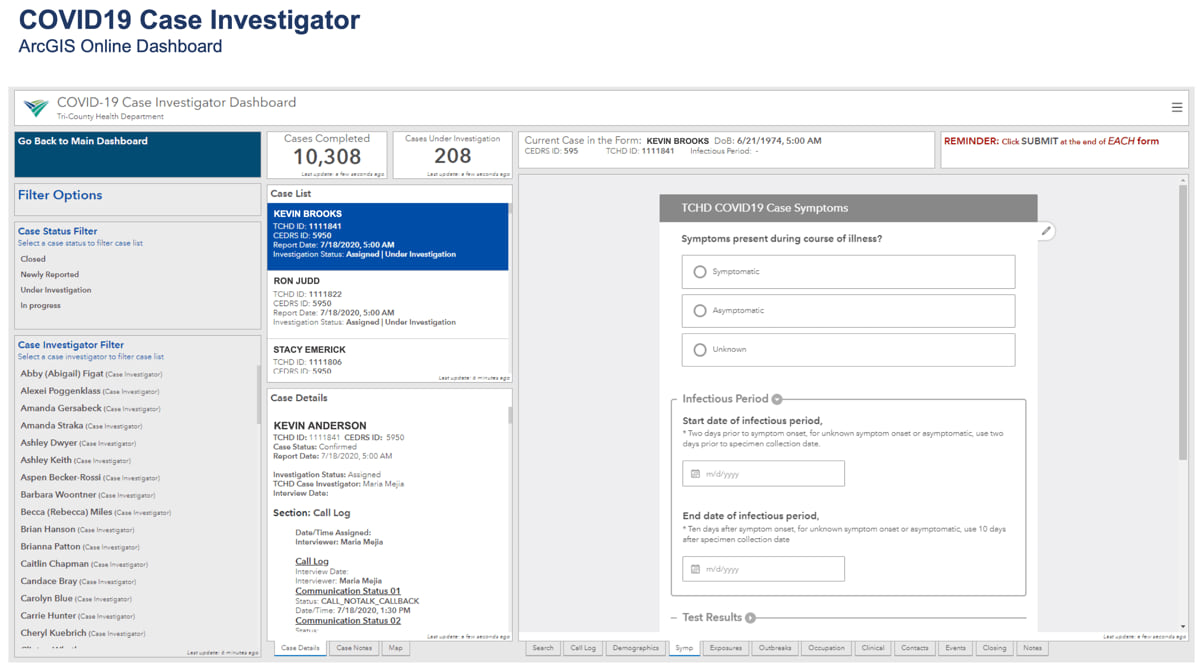
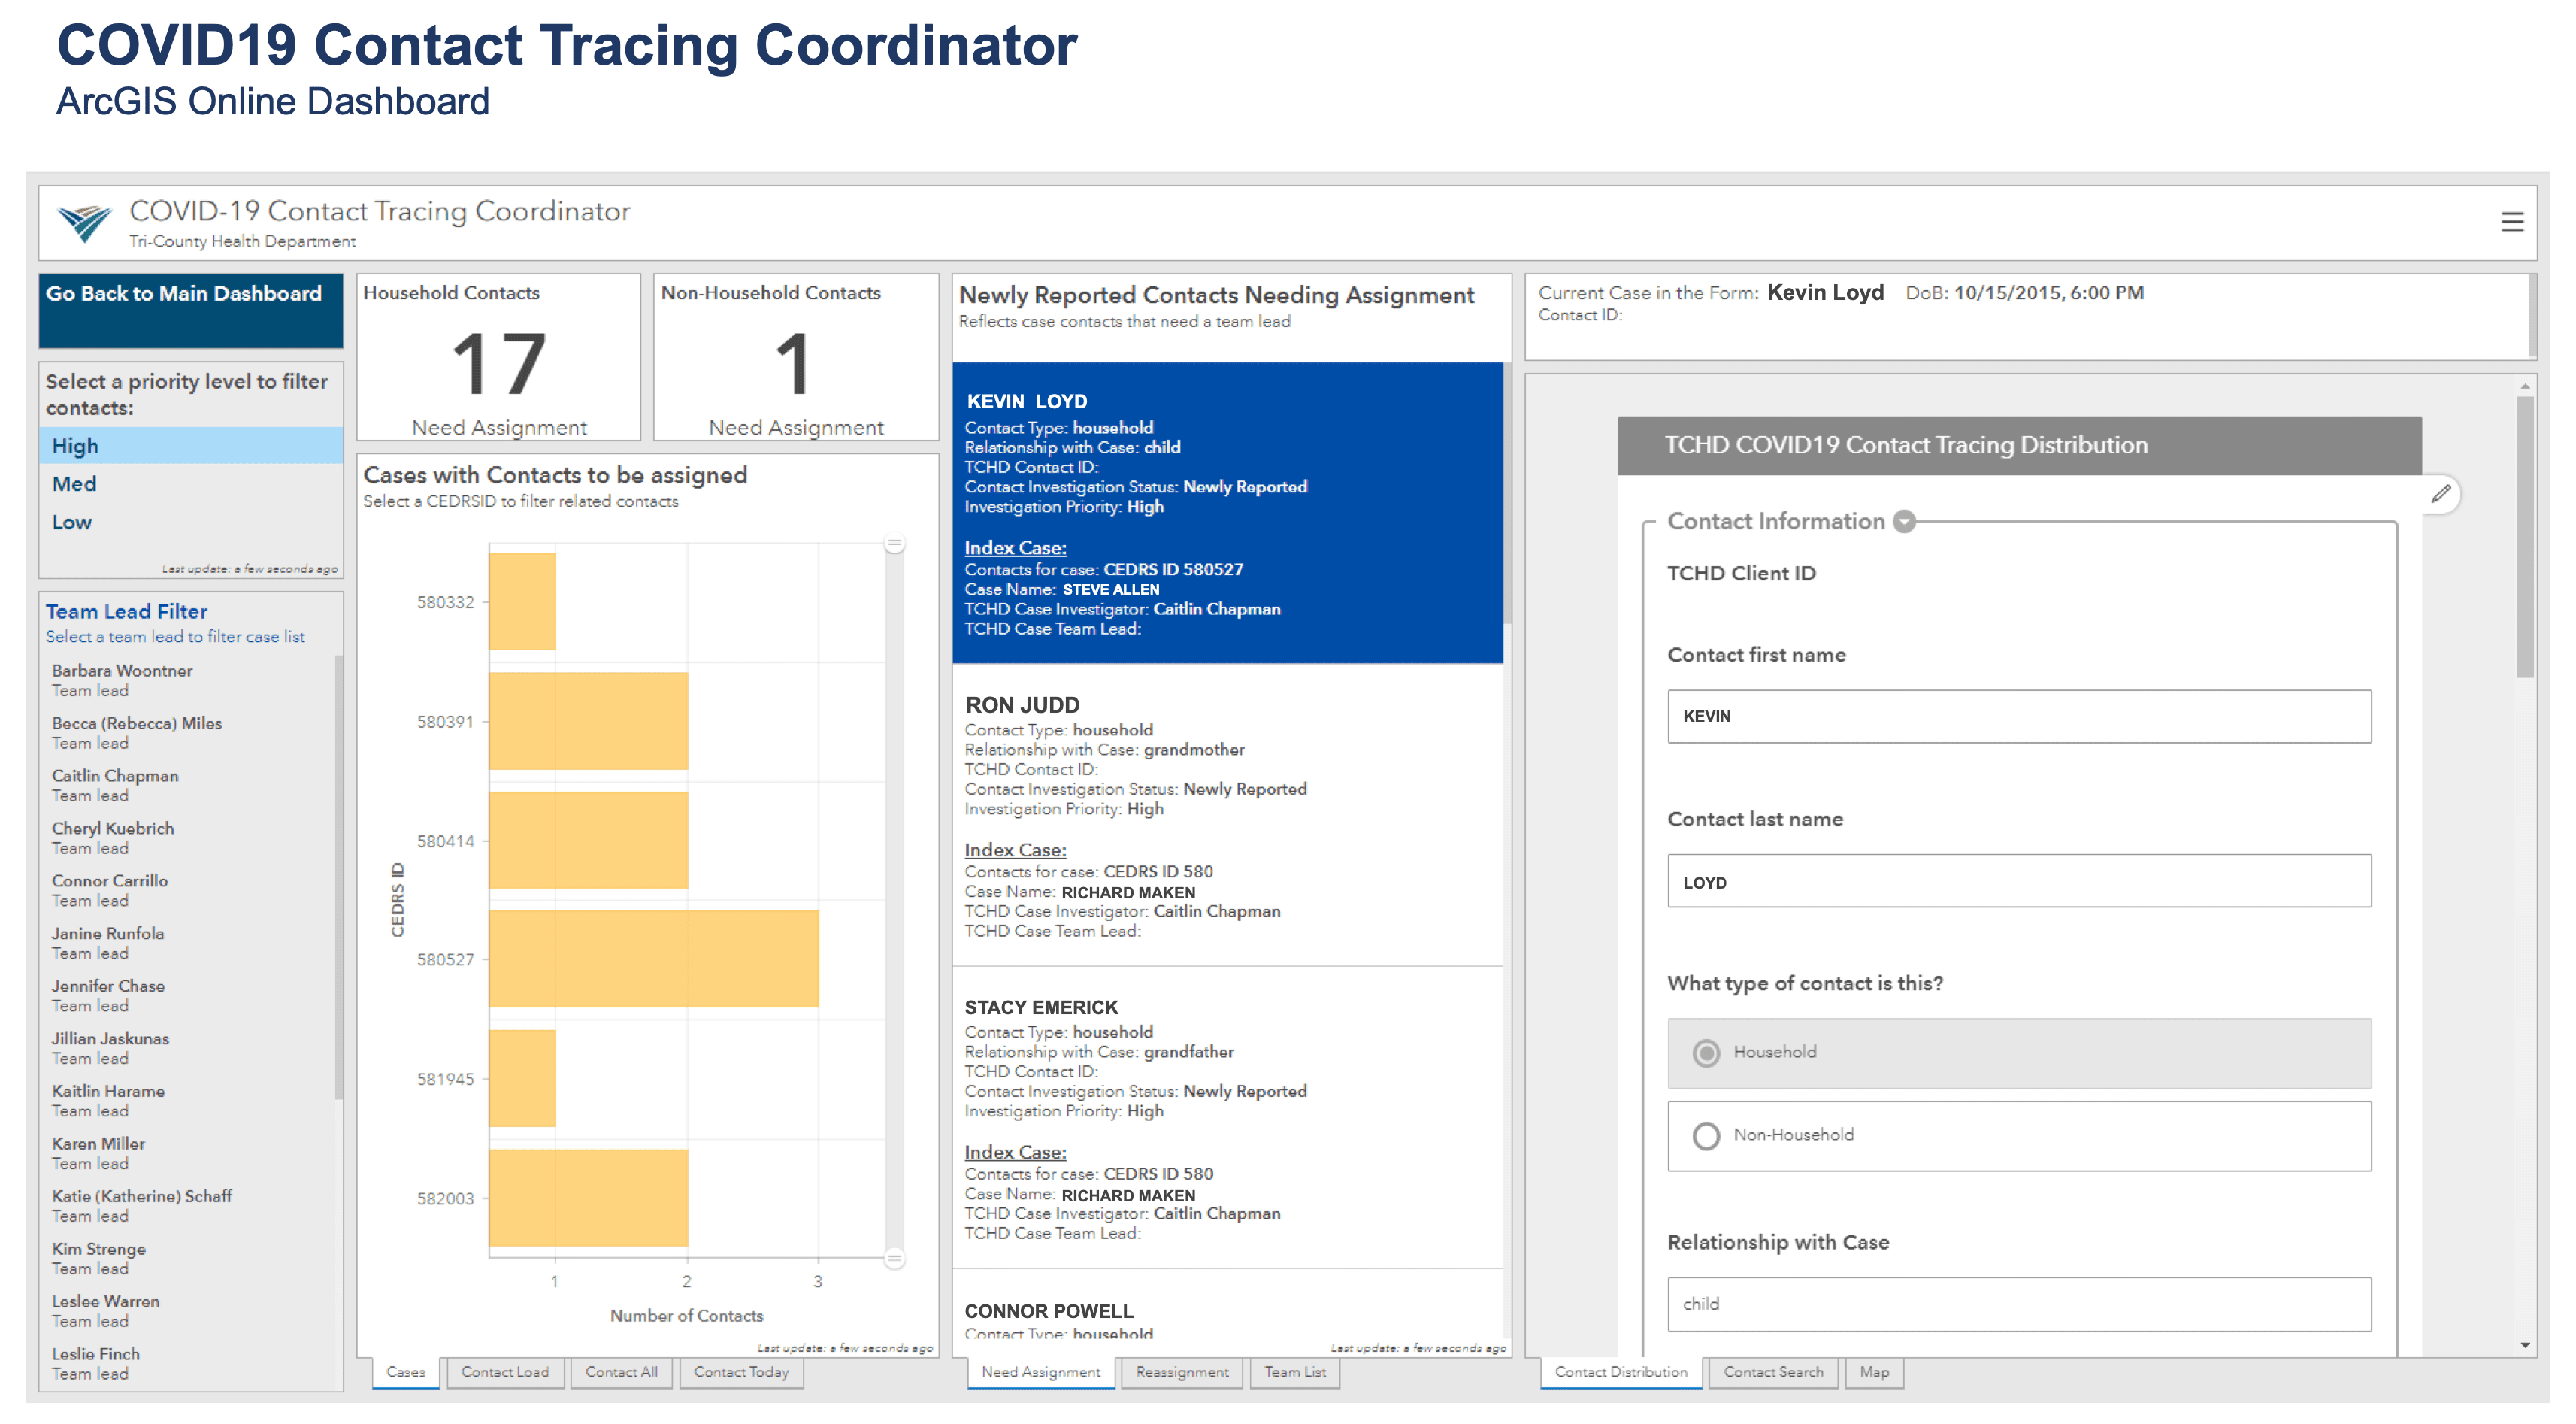
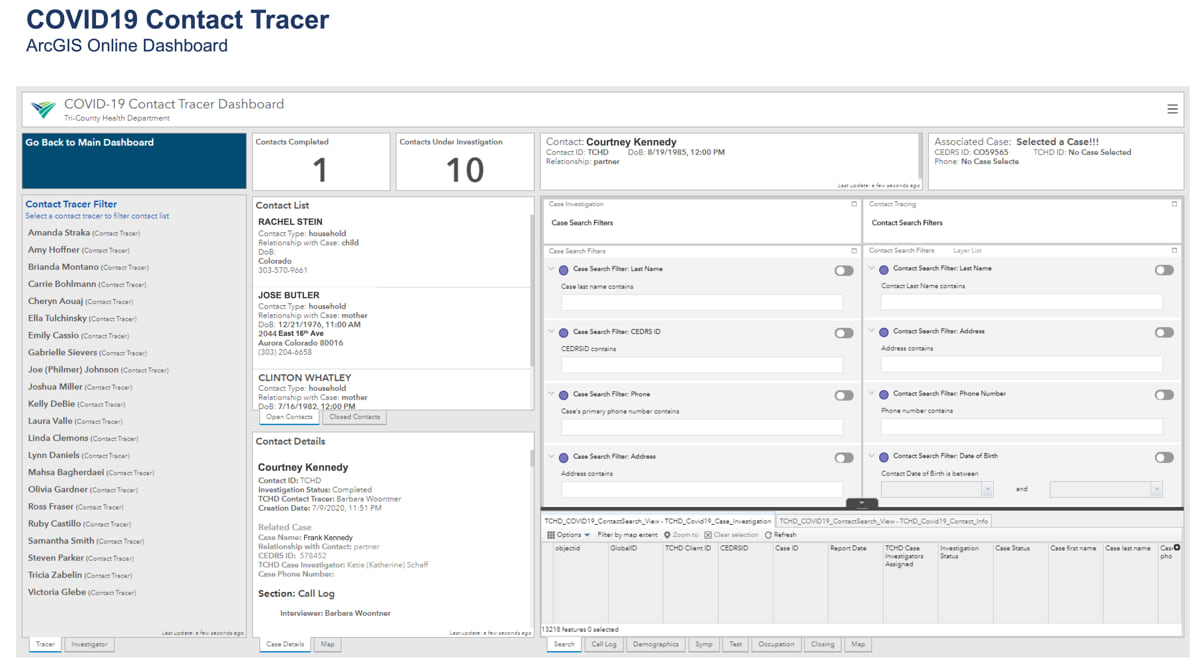
The gallery below displays many of the different views specific to the roles of both case investigators and contact tracers. Personal identifiable information has been removed and the records displayed in these tables and maps have been altered to protect patient privacy.

The workflows are spread across nine different forms with 280 data fields. Case investigators fill in details on demographics, symptoms, possible location of exposure, the people the infected individual might have exposed, the person’s relevant medical history, and testing information.
Contact tracing gets complex. If six people live in a house with a person who is infected, the contacts for each exposed person must be gathered and called. Each person is likely to list some of the same contacts. The system needed a way to surface shared contacts so that investigators don’t call the same shared contact multiple times. Deduplication is needed at every touch point where data is updated or brought in, with each change checked against data in the databases for case investigation, contacts, and testing.
It can be confusing to deduplicate contacts. If somebody asks, “who was at a dinner party?” for instance, the infected person may know their friends and friends’ phone numbers but may not know the names and contact information for acquaintances at the same event. Incomplete information for each contact takes time to sort out.
“It’s just never standard in terms of what details we’re able to collect at one time from each contact,” Anderson said. “In smaller outbreaks of measles or hepatitis A, an epidemiologist got really familiar with each case, the family, the contacts—there just wasn’t a lot of overlap. Nothing in the past even comes close to the scale of this.”
Investigators can flag aspects of cases that require more attention or mark trends, such as cases requiring a translator or involving an outbreak in a long-term care facility.
“We have a team of four people dedicated to investigating long-term care facilities, knowing that they contain one of our most vulnerable populations,” Anderson said. “We’ve also been reporting race and ethnicities to understand if there’s a disproportionate burden for specific populations.”
A local picture of disease spread is a key component of Tri-County Health Department’s efforts. In addition to daily dashboard updates for its whole jurisdiction, the team compiles 15 separate municipal dashboards.
“The dashboards let you see individual cases, along with testing data, aggregated for every neighborhood in our jurisdiction,” Anderson said.
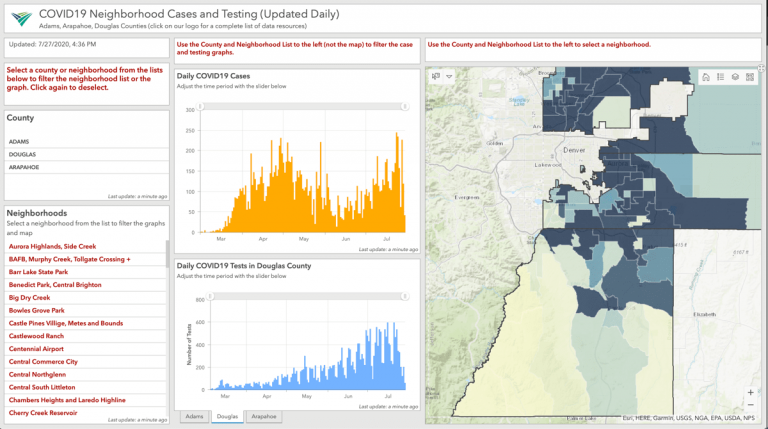
Seeing the spread at the neighborhood level adds context and helps guide the response. It has allowed epidemiologists to see that the spread isn’t random and it happens in waves even across a small geographic area.
“Maps are essential to our reporting,” Anderson said. “All details have to go into a map to quantify and contextualize what’s going on.”
Maps also cut through data complexity, which can otherwise be overwhelming.
“We had a request the other day to create a much simpler dashboard with just the totals of cases, hospitalizations, and deaths,” Anderson said. “But that doesn’t give you information about what’s going on now, what’s happened prior, or allow you to compare cases to policies such as shutting things down, or bringing things back online, or school closings, or masking. As a data person, I assume that people want as much data as is understandable.”
To date, Tri-County Health Department analyzes the data to simply see infection rates at different scales of geography—for its full jurisdiction, a municipality, or a neighborhood.
“The data leads to more complex analysis,” Anderson said. “There are a lot of questions about the relationships between cases, contacts, and the distances between them. Understanding the size of networks for urban and rural cases will help improve our recommendations to deal with the spread in a more effective way.”
Epidemiologists and researchers are starting to have conversations about how this data could be used to predict emerging hotspots to get ahead of an outbreak.
“Understanding where flare-ups will occur is going to be critical,” Anderson said. “The implications of gatherings such as a protest, a political rally, a party, or at a reopened workplace are another thing we’d like to work on.”
Tri-County Health Department has captured disease progression for each case, including details about when symptoms started, when the person was tested, when the test results were returned, when tests resolved or when a case led to hospitalization. Having these details and the capabilities to analyze cases across both space and time is of great interest within Tri-County Health Department, the region, and the nation. All health departments are working in uncharted territory with new volumes of data that promise to shed light on how viruses spread.
“The whole thing has been pretty energizing,” Anderson said. “The pandemic helped us improve data collection and create a workflow process from start to finish. The mental gymnastics of that has been pretty exciting.”
View the video below for a short demonstration regarding the community contact tracing capability of ArcGIS. A more detailed video demo can be found here.

April 7, 2020 | Multiple Authors |
June 25, 2020 |