It’s in the Wastewater: How UC San Diego Senses and Maps COVID-19
By Este Geraghty, MD, MS, MPH, GISP
Before the Delta variant became commonplace, toppling any optimism that the COVID-19 pandemic might soon be over, a team at the University of California (UC) San Diego got an early glimpse at the new threat. There it was, the virus’s RNA sequence, in their wastewater samples.
Rather than cause alarm, the presence of the more infectious COVID-19 variant offered the team hope. Here was evidence that their epidemiological strategy could detect the Delta variant and likely any future mutations.
To communicate cases, effluent testing results are tied to a live map created with a geographic information system (GIS) to relate which buildings have had a positive reading. The virus sensing effort has driven early testing and helped curb campus spread.
It’s also enabled UC San Diego to offer on-campus housing and in-person classes and research opportunities throughout most of the pandemic.
Although other campuses have attempted similar screening programs, few have reached UC San Diego’s scale or efficiency. To be successful, the system must provide near real-time information. Now, the same team has been tapped to monitor wastewater for the entire city of San Diego’s 2.3 million residents using the same innovative process.
The Return to Learn collaboration expanded to academic researchers, students, and campus staff, including facilities management, planning, emergency health, dining and hospitality, and other departments. (Wastewater testing images courtesy of UC San Diego)
...
...
How UCSD Led its Return to Learn
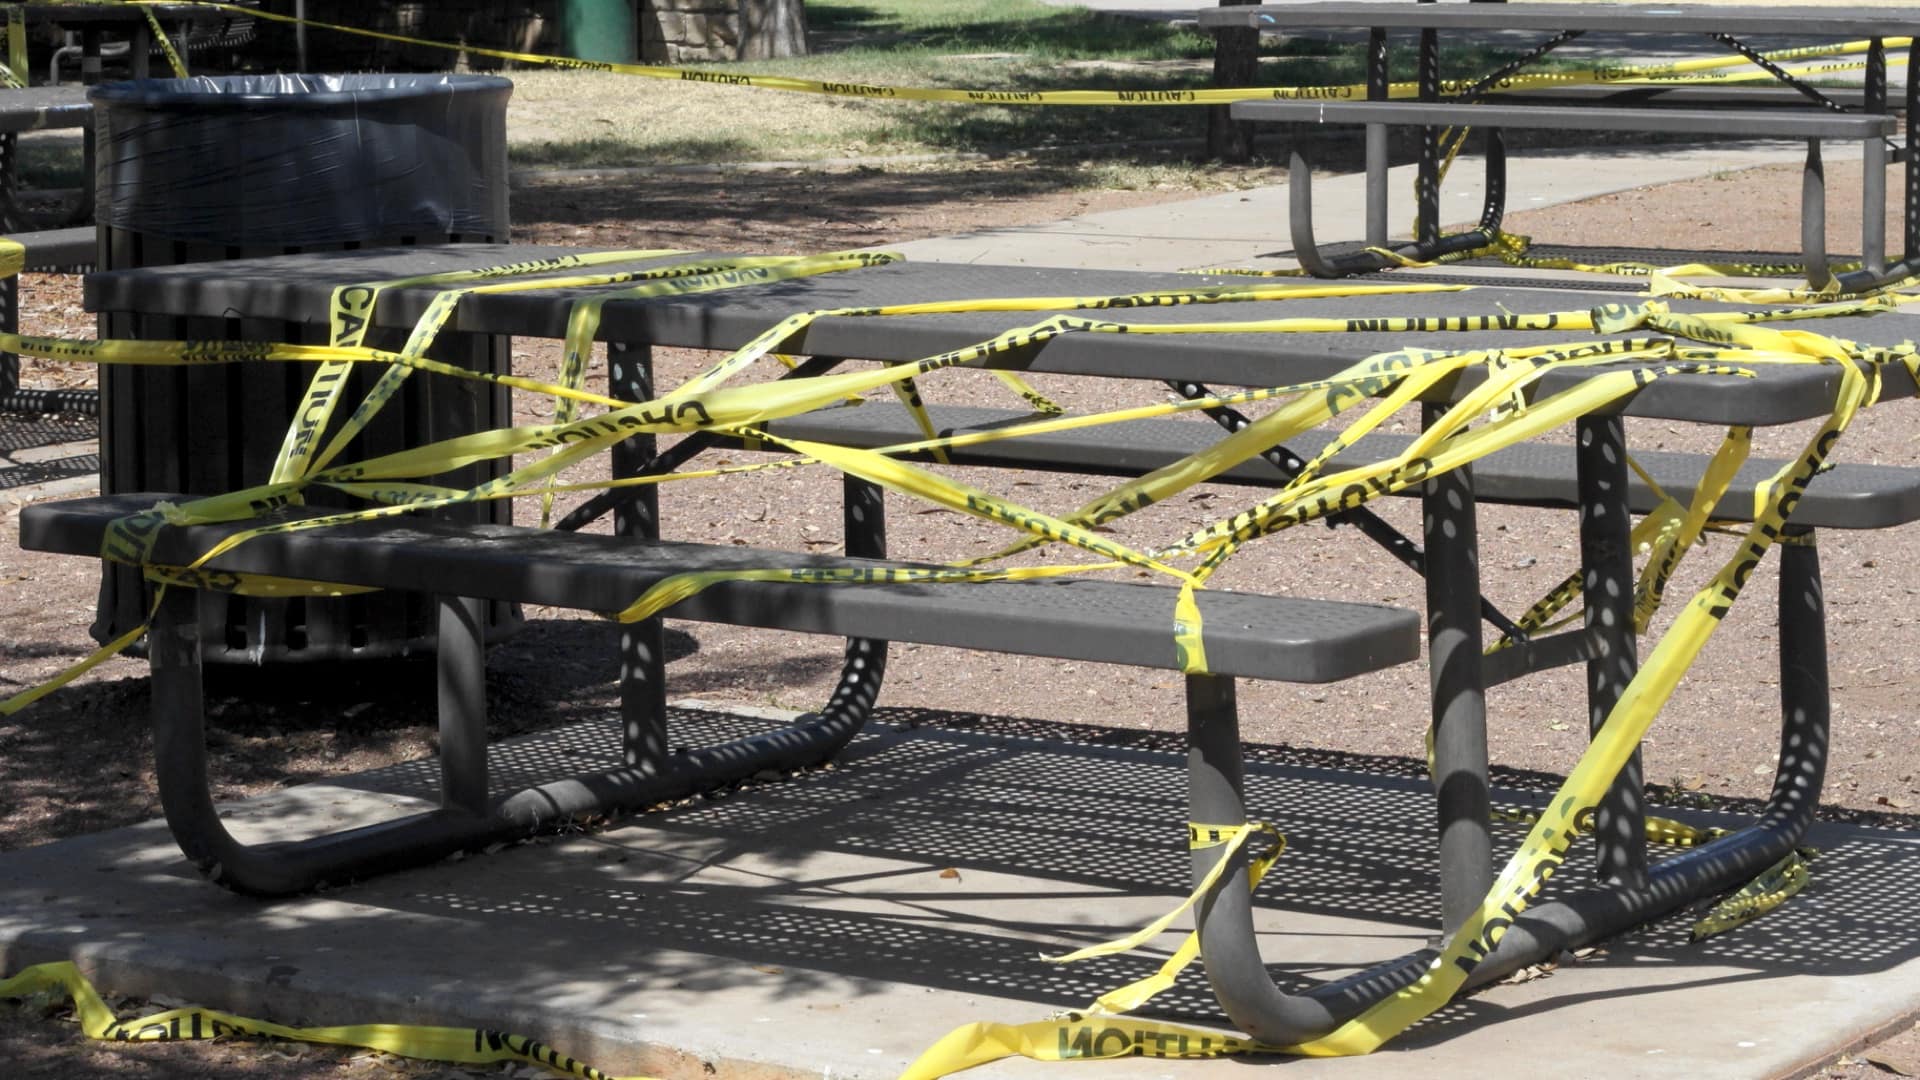
The campus setting has proven to be an ideal place to devise disease surveillance systems and curb the spread of COVID-19 despite people living and working in close quarters.
UC San Diego’s Return to Learn program was initiated with three pillars in mind: risk mitigation, viral detection, and intervention. The university’s Operational Strategic Initiatives department spearheaded the effort, with Rob Knight, professor and director of the Center for Microbiome Innovation, as the chief laboratory investigator.
Concerned that outbreaks could occur and quickly spread in highly occupied buildings, Knight and his team initiated wastewater testing as a way to safely maintain campus population during the pandemic and take early action when needed.
Often, infected students weren’t aware they had the virus. In the summer of 2020, the system detected a positive case one Friday afternoon. Notifications went out within 14 hours, and that weekend more than 650 people were tested.
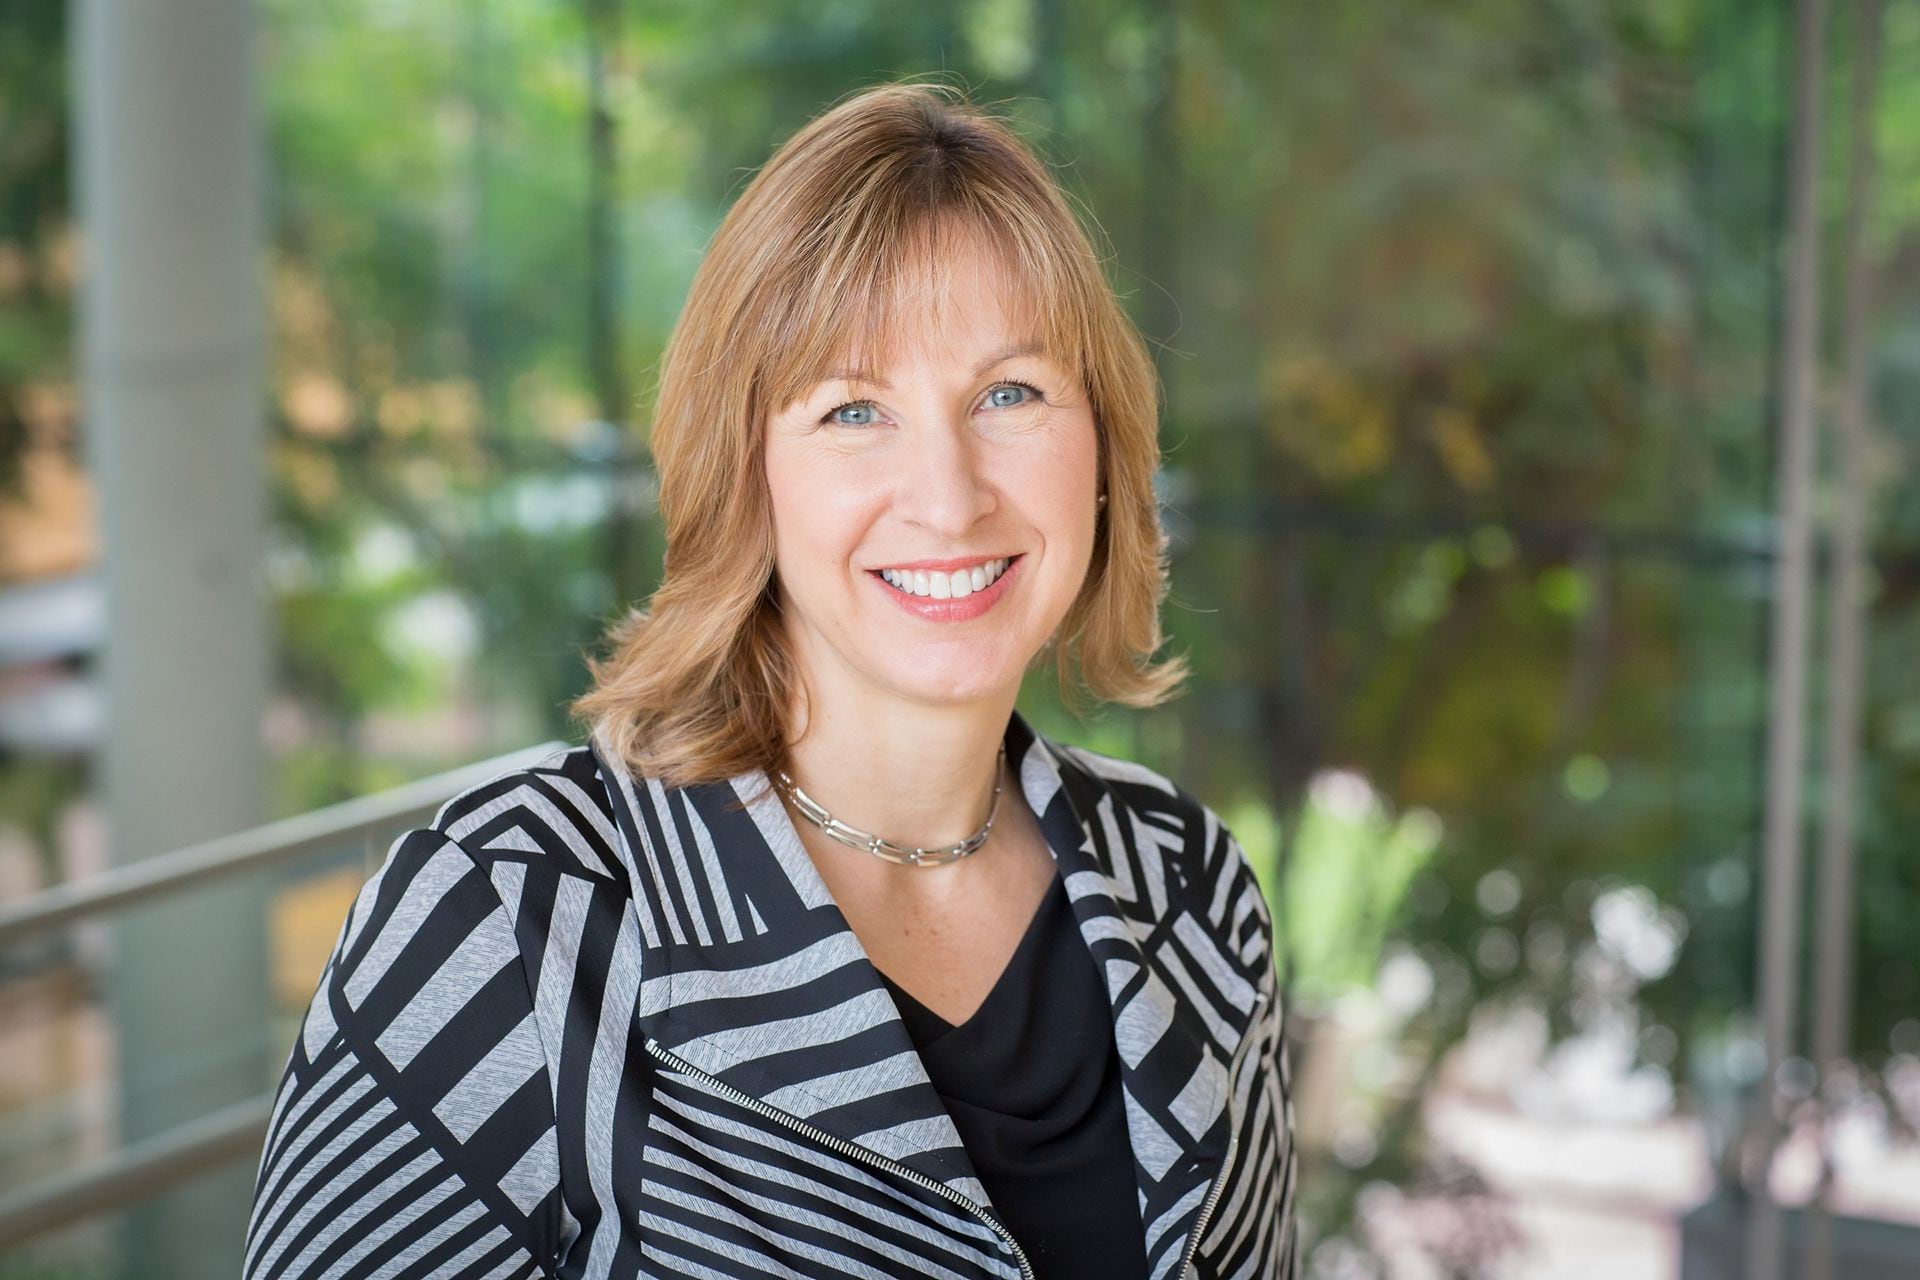
We had several examples where we could see that it was a single infected individual in a building of several hundred students. When we found that person and moved them to isolation, the wastewater was negative the next day.
associate professor, Global Public Health, UC San Diego
Natasha Martin
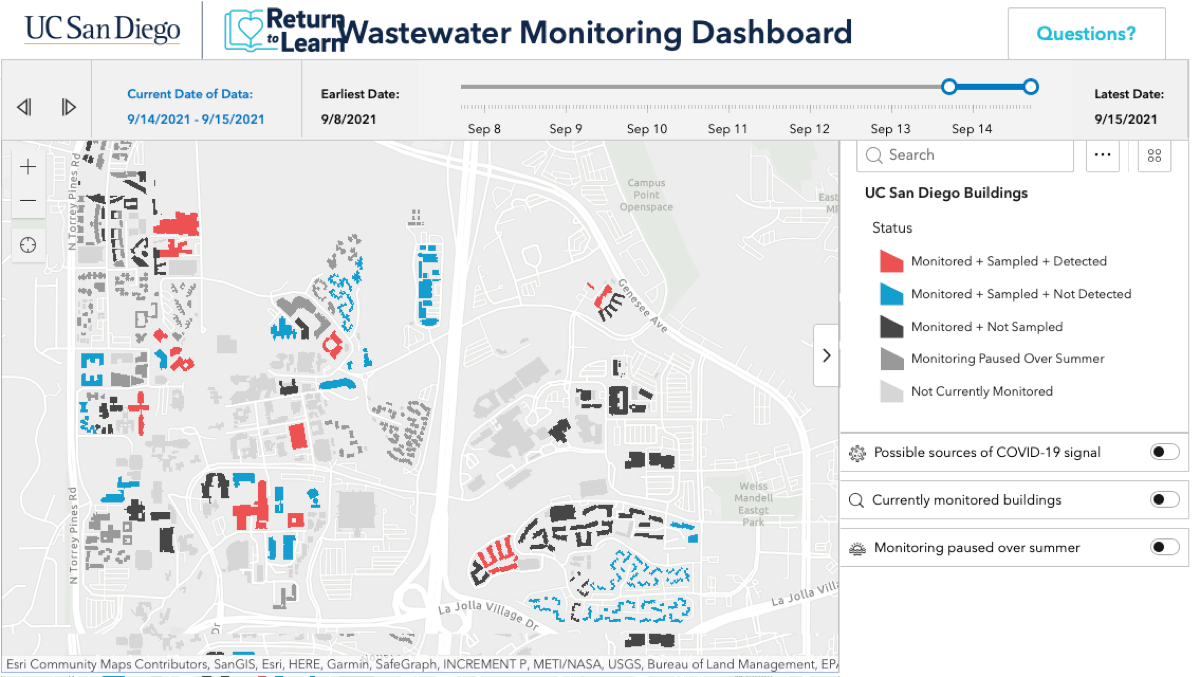
The Return to Learn team credits transparency as the key to participation. Detailed maps of every building, pipe, and sewage access point form the basemap. A public GIS dashboard shows daily updates of buildings that have been monitored, sampled, and detected. This keeps the entire campus community abreast of the university’s viral infection status.
“It’s not just our processing of the data but being able to share that data out to everyone and the public,” said Natasha Martin, an associate professor in the Department of Medicine, Division of Infectious Diseases and Global Public Health at UCSD. “Even now, we have people that visit, and they can check on the public dashboard and see if a particular building was positive on that day.”
Despite early uncertainty about how well the system would detect cases, it proved to be, “incredibly sensitive,” Martin said. More than 85 percent of the university’s residential cases were detected in the wastewater.
Showing Students, Staff Where the Virus Is
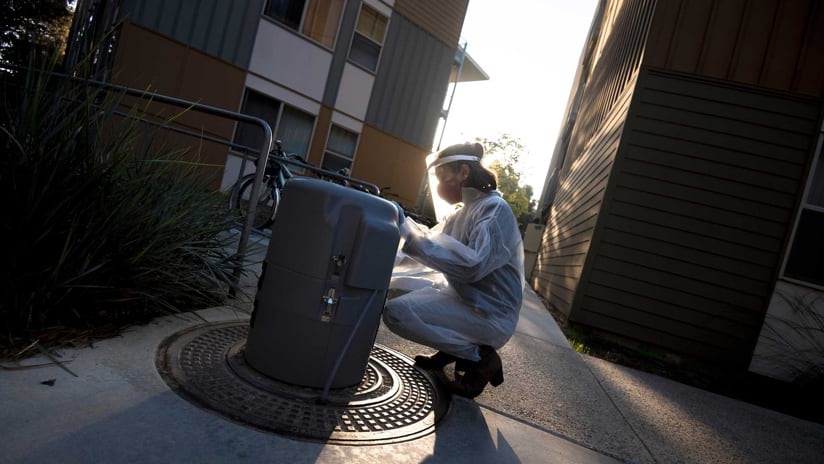
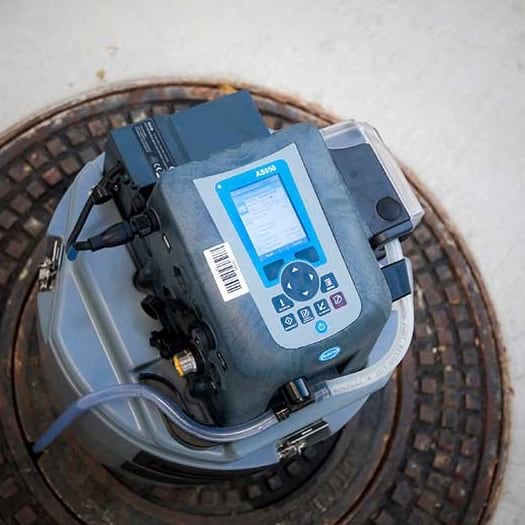
At the outset, UC San Diego had just six wastewater autosamplers that captured effluent for laboratory testing. The results were recorded in a spreadsheet manually. Now, UC San Diego samples the wastewater in 350 buildings every day and the results automatically get added to the map.
To achieve automation, UC San Diego had to make a better map that included the pathways of the sewer systems so they could correlate wastewater samples collected in pipes to the buildings they served. Once a particular building was identified, they could trace the virus to individual people through the standard nasal-swab testing.
During the summer of 2020, the Return to Learn team began issuing notifications to on-campus residents and staff by email, lobby fliers , and even door-to-door knocking to compel further testing. To the surprise of Martin and others, it worked. When people received notifications of positive wastewater samples, individual testing rates jumped as much as 13-fold. The testing prompted a quick start of isolation and contact tracing.
Automation Involves Robots, Dashboards, Maps, and Listservs
To alert people on campus of a positive result, the team couldn’t rely on a time-consuming multi-step lab process. Backlogs and delays would have derailed the promise of wastewater testing. To speed up the process, UC San Diego introduced robots to the lab and automated the notification systems.
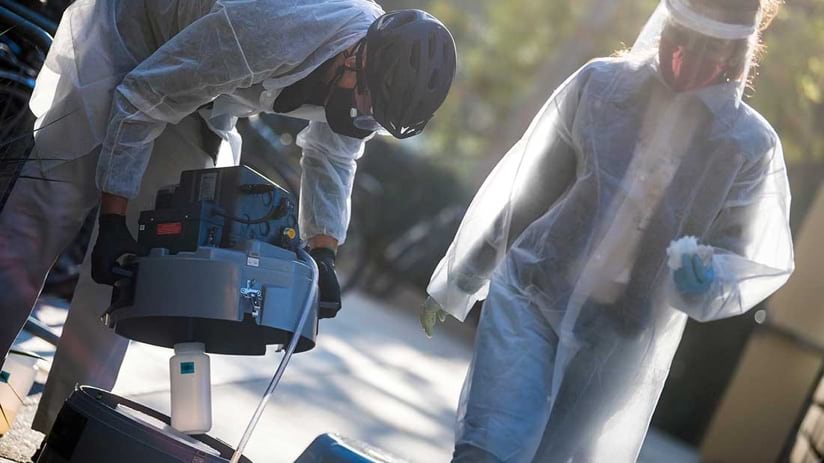
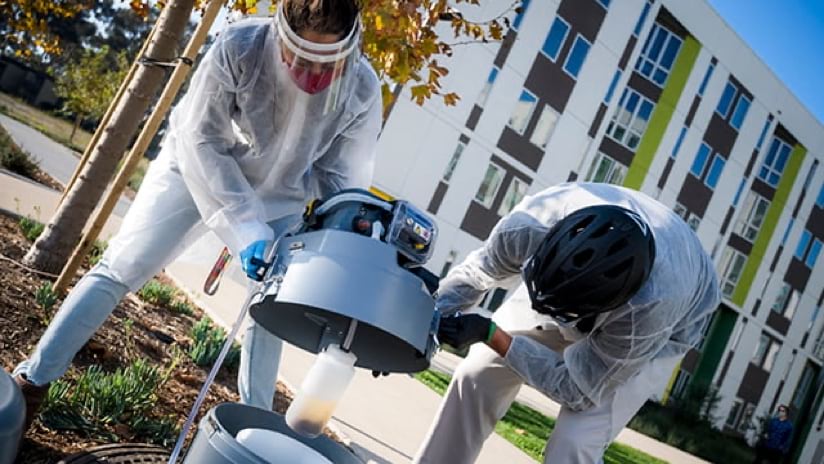
A group of students and staff gather every morning to collect sewage samples using liquid-handling collection robots across 350 campus buildings. Then, they return to the lab for processing. In the lab, robots concentrate the virus using magnetic nanoparticles, and then extract RNA—the genetic material that makes up the genomes of viruses such as SARS-CoV-2—from the samples. Polymerase chain reaction testing is then used to search for the virus’s signature genes.
The automated, high-throughput system can process 24 samples every 40 minutes. Data is then added to a digital dashboard and map that tracks new positive cases building by building.
If Martin knows a student is already isolating in the building in which a positive sample comes back, she doesn’t issue a notification.
The notification process is otherwise fully automated. Martin provides the dates of positivity and the sampler number, and that automatically issues emails to everyone residing or working in the building.
She estimated that automation initially saved her two to three hours per day. Without automation, it would have been hard to expand the scale of the wastewater testing effort.
Expanding Beyond the Campus
With the promise of curtailing future epidemics and pandemics, wastewater surveillance could be a university’s or community’s greatest defense without the need for more intrusive methods of surveillance. The US Centers for Disease Control and Prevention has recognized its efficacy, which has been validated and refined during the pandemic, and a new National Wastewater Surveillance System was launched.
“As the barrier to entry and operate continues to drop, we hope wastewater-based epidemiology will become more widely adopted,” Knight said in a press release. “Rapid, large-scale infectious disease early alert systems could be particularly useful for community surveillance in vulnerable populations and communities with less access to diagnostic testing and fewer opportunities to distance and isolate—during this pandemic, and the next.”
Dr. Este Geraghty, the chief medical officer at Esri, leads strategy and messaging for the health and human services sector. With Esri since 2014, she leads business and solution development and has helped organizations around the world use location intelligence to meet a range of health challenges, including enhancing strategic planning and optimizing health-care access during the COVID-19 pandemic. She is a former deputy director of the Center for Health Statistics and Informatics with the California Department of Public Health and an associate professor of clinical internal medicine at the University of California at Davis. Geraghty holds advanced degrees in medicine, medical informatics, and public health and is also a board-certified public health (CPH) professional and a geographic information systems professional (GISP).
Related articles
August 19, 2021 |Este Geraghty, MD, MS, MPH, GISP | Public Health