


June 16, 2022 |
Linda Peters | Resilience
The United Arab Emirates has grown extraordinarily in the 50 years since it was formed in 1971, particularly in Abu Dhabi and Dubai, where the bulk of the country’s population lives. Abu Dhabi has seen the most dramatic urban growth of the seven emirates. It’s now a modern city with gleaming office towers, a complex multimodal transportation network, utility-scale renewable energy, and an education system that ranks in the top 20 in the world.
The UAE also stands out for diversifying its economy beyond oil, which required careful planning and great discipline.
In advance of the 50th anniversary of the country’s founding, the UAE’s Federal Competitiveness and Statistics Centre (FCSC) mapped the country and its people, using geographic information system (GIS) technology to quantify how far it has come.

FCSC adopted GIS to modernize workflows and visualize the statistical indicators it gathers for such sectors as health, education, environment, and the economy. GIS data feeds 1Map, which isn’t one map, but rather the mapping capacity for the nation, with a collection of map layers such as roads, facilities, and demographics about people. The information allows residents to see how the UAE is faring, and each ministry to see its strengths and weaknesses so investments can be made in the right places to improve quality of life for all residents.
“We launched our Geo-Stat geostatistical initiative four years ago,” said Marwa Elkabbany, the GIS expert with FCSC. “We started by collecting detailed facilities datasets from ministries, like health and education facilities, and geo-enabling statistics to map more than 70 national indicators”
The discovery of oil in the 1950s fueled growth in the UAE, displacing pearls, fishing, and agriculture as key industries. Two decades ago, almost all the country’s economy was oil based. Now oil makes up less than 30 percent of gross domestic product (GDP). A series of plans have guided national investments away from oil dependency.
His Highness Sheikh Mohamed bin Zayed Al Nahyan, the third president of UAE, spoke in 2015 about this effort and the steady focus toward a future without oil. “In 50 years, when we might have the last barrel of oil, the question is, when it is shipped abroad, will we be sad?” he asked. “If we are investing today in the right sectors, I can tell you we will celebrate.”
UAE has diversified with investments in infrastructure, hospitality and tourism, and technology. There are three sovereign wealth funds in UAE that invest on behalf of the government, including Abu Dhabi Investment Authority with assets of nearly $700 billion. This strategy of investment outside of oil aims to provide long-term returns from this nonrenewable resource.
Many of the investments are tied to both revenue diversification and improvements in quality of life, including the goal of being a destination for world-class health care, which illustrates how statistics drive societal advancements. First, the UAE needed to know the health of its people, and then it needed to compile details on healthcare facilities.
“We started the UAE Facilities Catalog by collecting the health facilities datasets along with the indicators such as how many are publicly owned, how many beds they have, and the number of medical staff and physicians,” Elkabbany said. “We mapped it to feed our geostatistical platform, then we overlaid facilities with our population and administrative maps to understand and evaluate their geographic distribution.”

FCSC has been mandated by the Ministry of Cabinet Affairs to collect data from federal government entities in a seamless manner, including location data where applicable, while fostering best practices regarding data quality and standards. The 1Map name and branding by FCSC matches the country’s data integration goal, which fits the capabilities of modern GIS to tackle challenges across sectors.
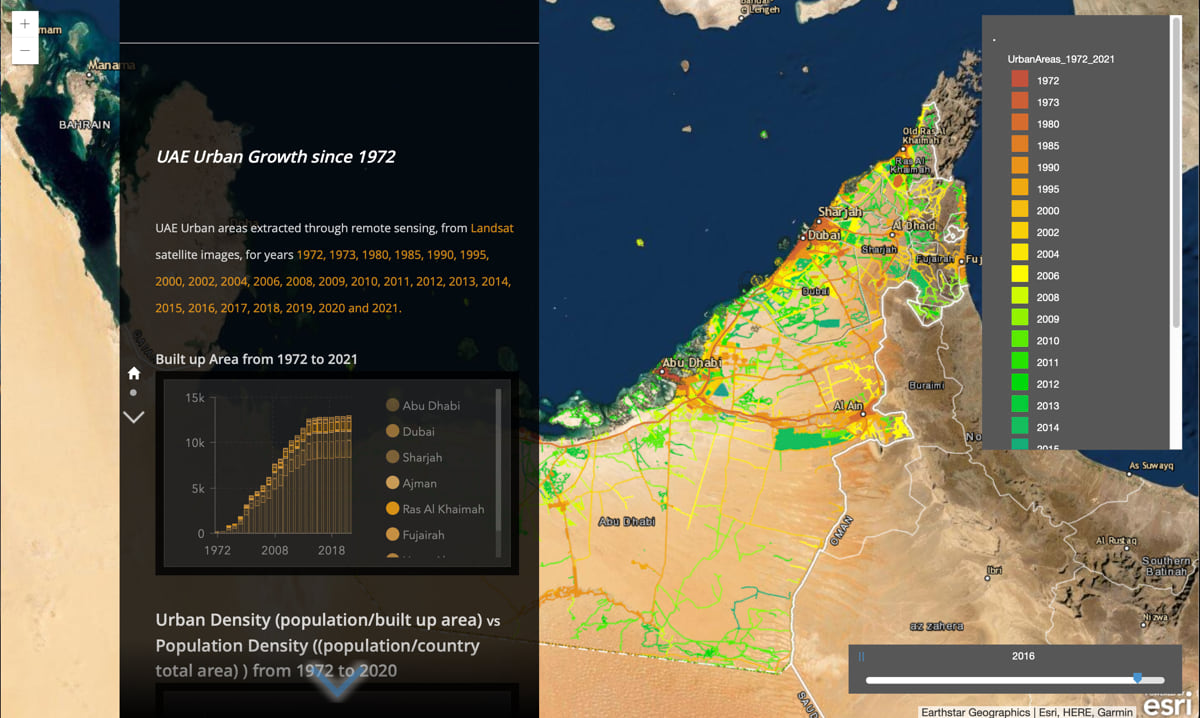
The FCSC team has come a long way in four years. It started by developing national foundational administrative maps for districts and subdistrict levels in addition to defining national urban areas. The process included setting national standards and data harmonization tasks to produce an up-to-date, authoritative geodatabase.
The FCSC GIS team has been working with federal and local partners to implement a national collaborative geographic information portal that collects geospatial data from partners, processing the data to harmonize and standardize it, and then creating different applications and sites to serve the community and governmental partners through the one-stop 1Map portal.
The creation of the National Digital Data Ecosystem is a key priority for the UAE Government. FCSC has been working on a variety of projects as the lead federal entity for this effort, such as the Data Maturity Index, which aims to enable agencies to manage and administer their data in accordance with international standards and best practices to ensure accessibility and data flow, governance, and quality. Another example is the Emirates Data Network project which supports the data exchange of federal administrative data contributing to a national knowledge hub.
At FCSC, the move to GIS started slowly with licenses for ArcGIS Pro and ArcGIS Online but soon expanded to ArcGIS Enterprise to enable integration across each ministry’s ArcGIS implementation through the portal-to-portal collaboration capability. 1Map provides the foundational maps that each ministry builds on with its own data that it can share through ArcGIS Enterprise to maintain authority and security over the data it creates.
1Map datasets include population distribution; land use and housing; public facilities such as hospitals, schools, and cultural and religious destinations; and preserved natural areas and parks. This data is further broken down into component parts. For example, with population data, there are added demographic details such as gender, citizenship, and age at different scales. Maps show each of these indicators as well as population density across the country.
Much of the 1Map data is sensitive and restricted, so while some datasets are public, others are controlled with access only given to certain ministries or approved researchers.
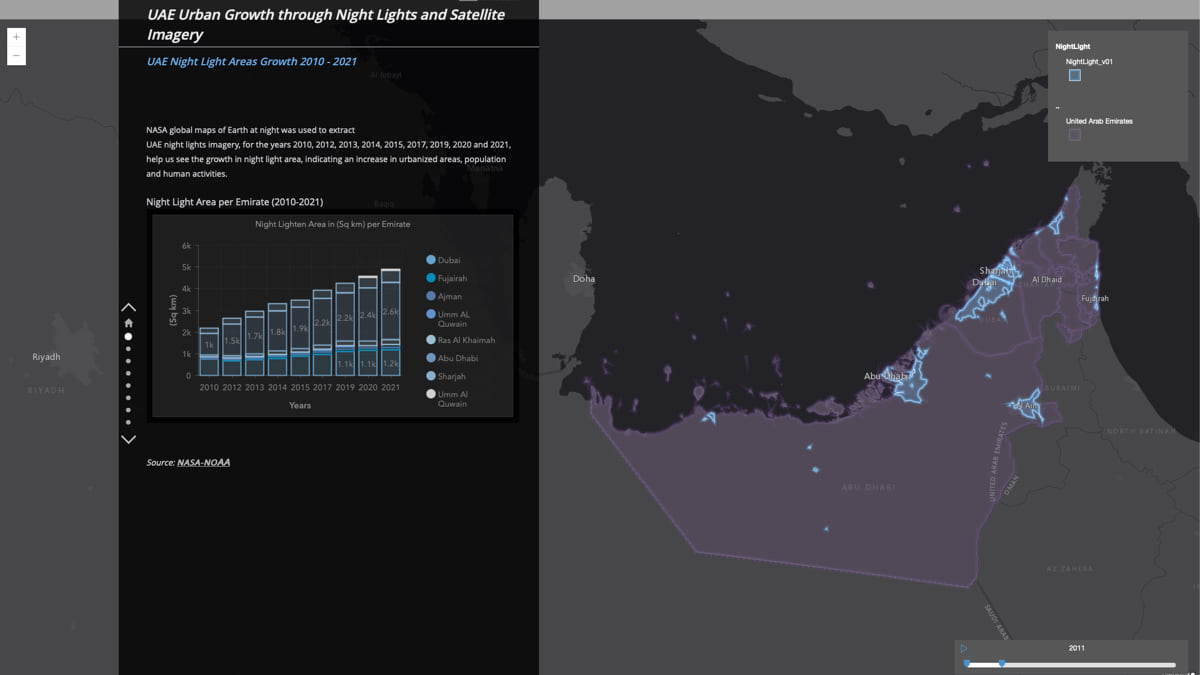
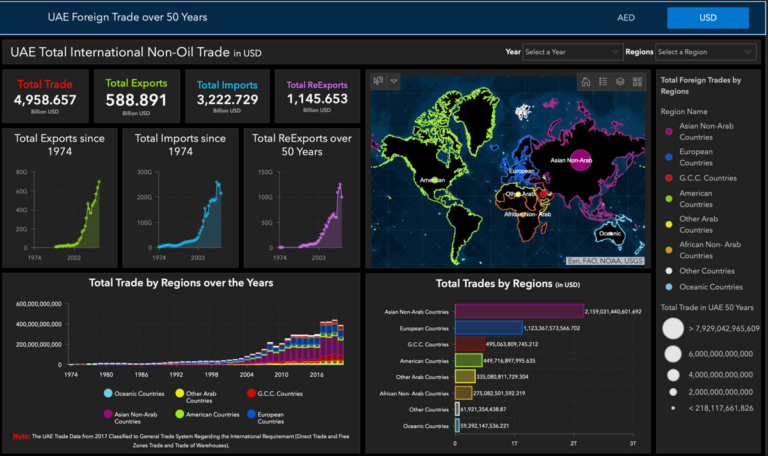
The data is displayed in dashboards built with ArcGIS Dashboards to show progress on issues that are specific to a ministry’s objectives and others for the nation. For instance, a public-facing dashboard gathers total international nonoil trade for the country. Narrative maps have been built with ArcGIS StoryMaps to better communicate with the public, such as a story that uses satellite images of Earth at night to illustrate urban growth in the country. Data is organized using ArcGIS Hub to indicate progress, including the 50 Years of Prosperity project. And data is further analyzed by experts to inform leaders and check on progress of policies—and to craft new ones—all focused on moving the country forward.
Competitiveness on quality-of-life issues is central to the way FCSC operates. For instance, an initial calculation by international organizations about rural access to roads showed that just 76 percent of people living in rural areas had access to an all-season road within two kilometers.
“The roads in UAE are amazing, so it didn’t make sense,” Elkabbany said, relating how the World Economic Forum report in 2019 ranked UAE seventh in the world for quality of road infrastructure and the Legatum Institute ranked UAE as first in the world for satisfaction of roads and highways in its Prosperity Index Report.
“We looked at the dataset the international organization used to understand it, then we consolidated rural and urban boundaries from local municipalities, built a national population grid reflecting local statistics for population estimates, and overlaid all this data with the roads network according to the World Bank methodology,” Elkabbany said. “Now when we run this indicator, it shows 99.54 percent of rural-area residents have access to a road within two kilometers.”
This was one of many ways that the map helped verify the accuracy of the data and how the data helps verify the accuracy of the map. The road access indicator showed how rural and urban area delineation wasn’t right and how population estimates were off. As Elkabbany notes, the climate and geographic conditions in the country favor urban development where housing is weather controlled and there’s easy access to healthcare, schools, and other services.
Official statistics for the UAE, like many nations, have long been maintained in spreadsheets, but there’s a growing move to put these measurements on a map, thanks to the United Nations Sustainable Development Goals (SDGs) that were adopted in 2017. The SDGs recognize intertwining issues, such as how alleviating poverty goes hand in hand with improving health and education and spurring economic growth. Putting indicators on the map provides a crucial view to address inequalities and pinpoint where to limit the impacts of climate change.
When the COVID-19 pandemic hit, FCSC had just launched maps of health facilities and population distribution. That data became critical to identify areas of risk and helped leaders understand the critical importance of maps and geostatistics for crisis management.
“Government stakeholders are endorsing the use of GIS and geospatial intelligence capabilities across different sectors, with growing demand for map-driven meetings where geospatial dashboards are used as a decision support tool,” Elkabbany said.

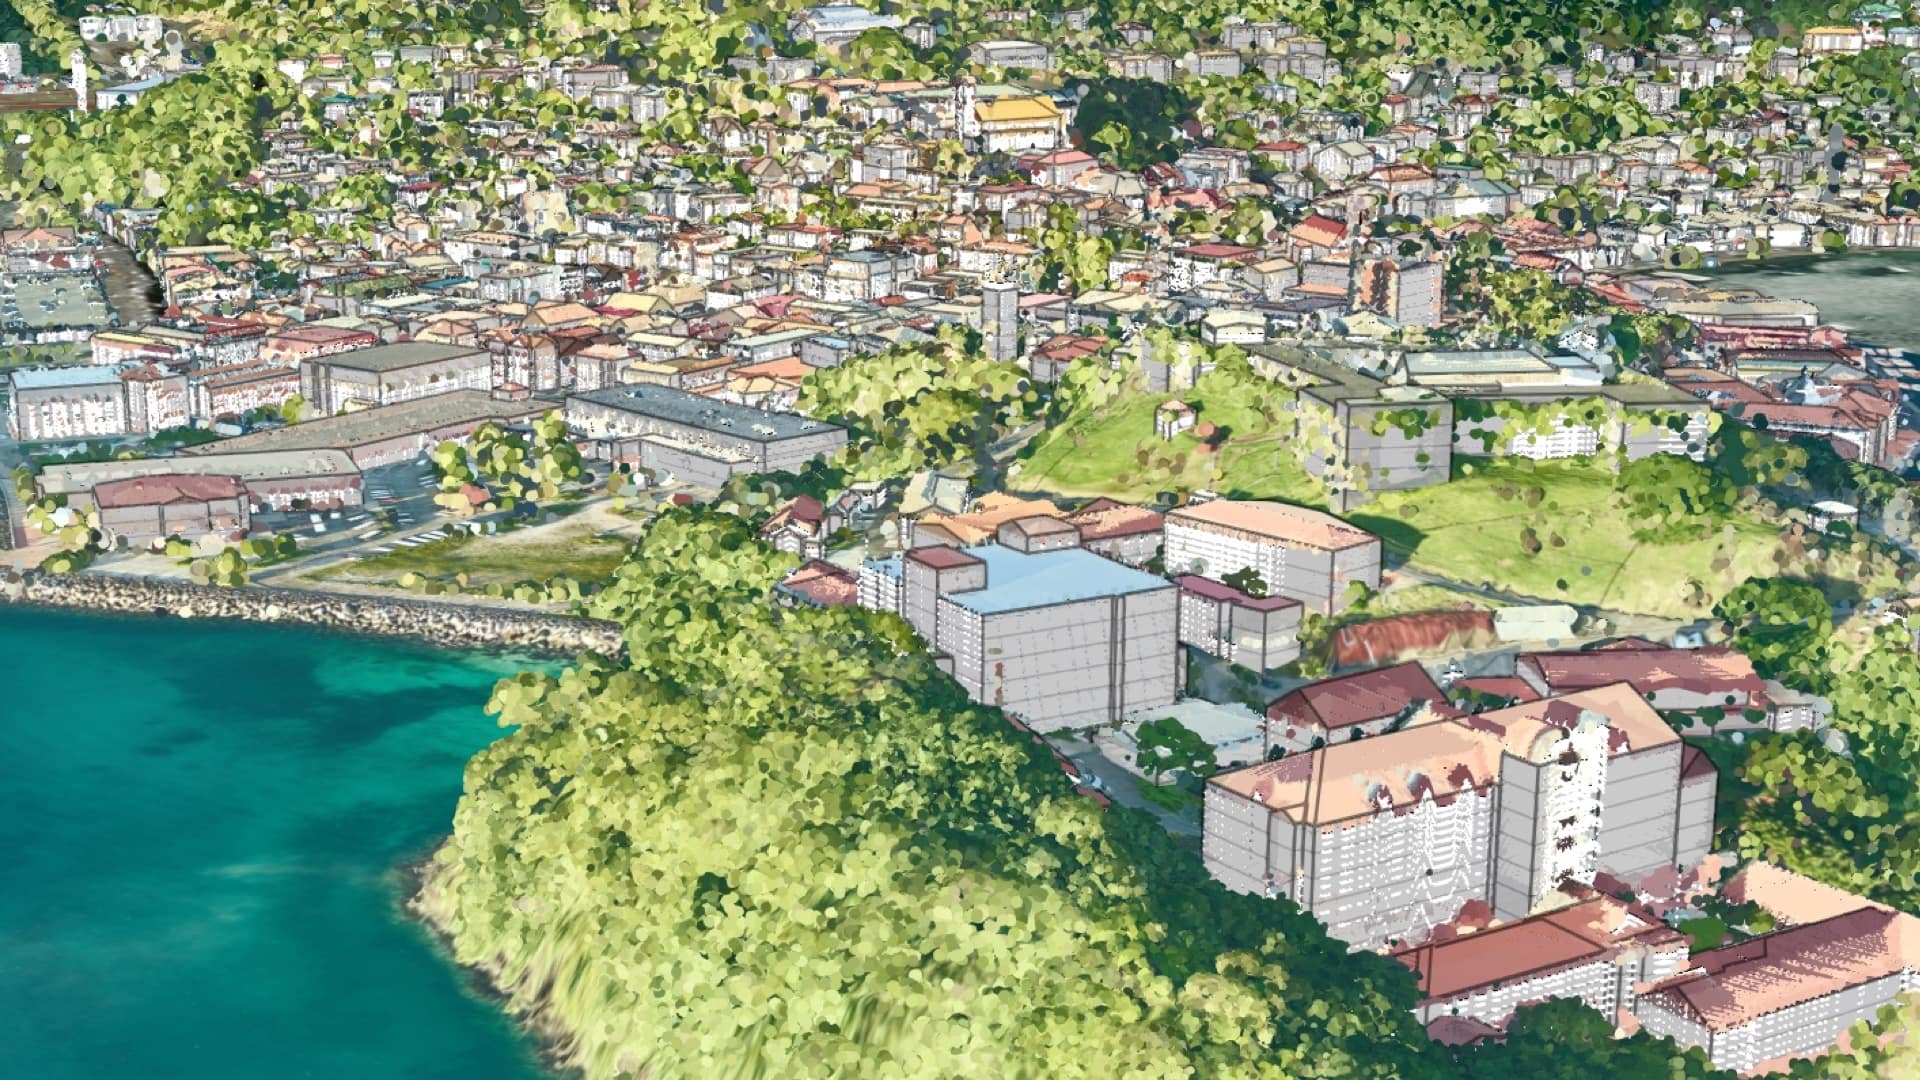
Lately, FCSC has been using satellite imagery and machine learning to fill in data gaps. The team has collected all building footprints across the country and used smart meter data about electricity and gas consumption to derive population estimates for where people live and work. FCSC continuously looks at non-traditional data sources such as anonymized phone location data to understand the movement patterns of people. Analysis of movement patterns helps compare facilities and opportunities across different geographic areas, which is a great input for planning processes.
“We have to be ready. We must prepare our data, and we need to measure prosperity and competitiveness to ensure high quality-of-life standards are maintained and elevated,” Elkabbany said.
Learn more about how GIS enables official statistics organizations to create smarter nations.