

June 6, 2023 |
Carrie Speranza | Public Safety
March 12, 2026
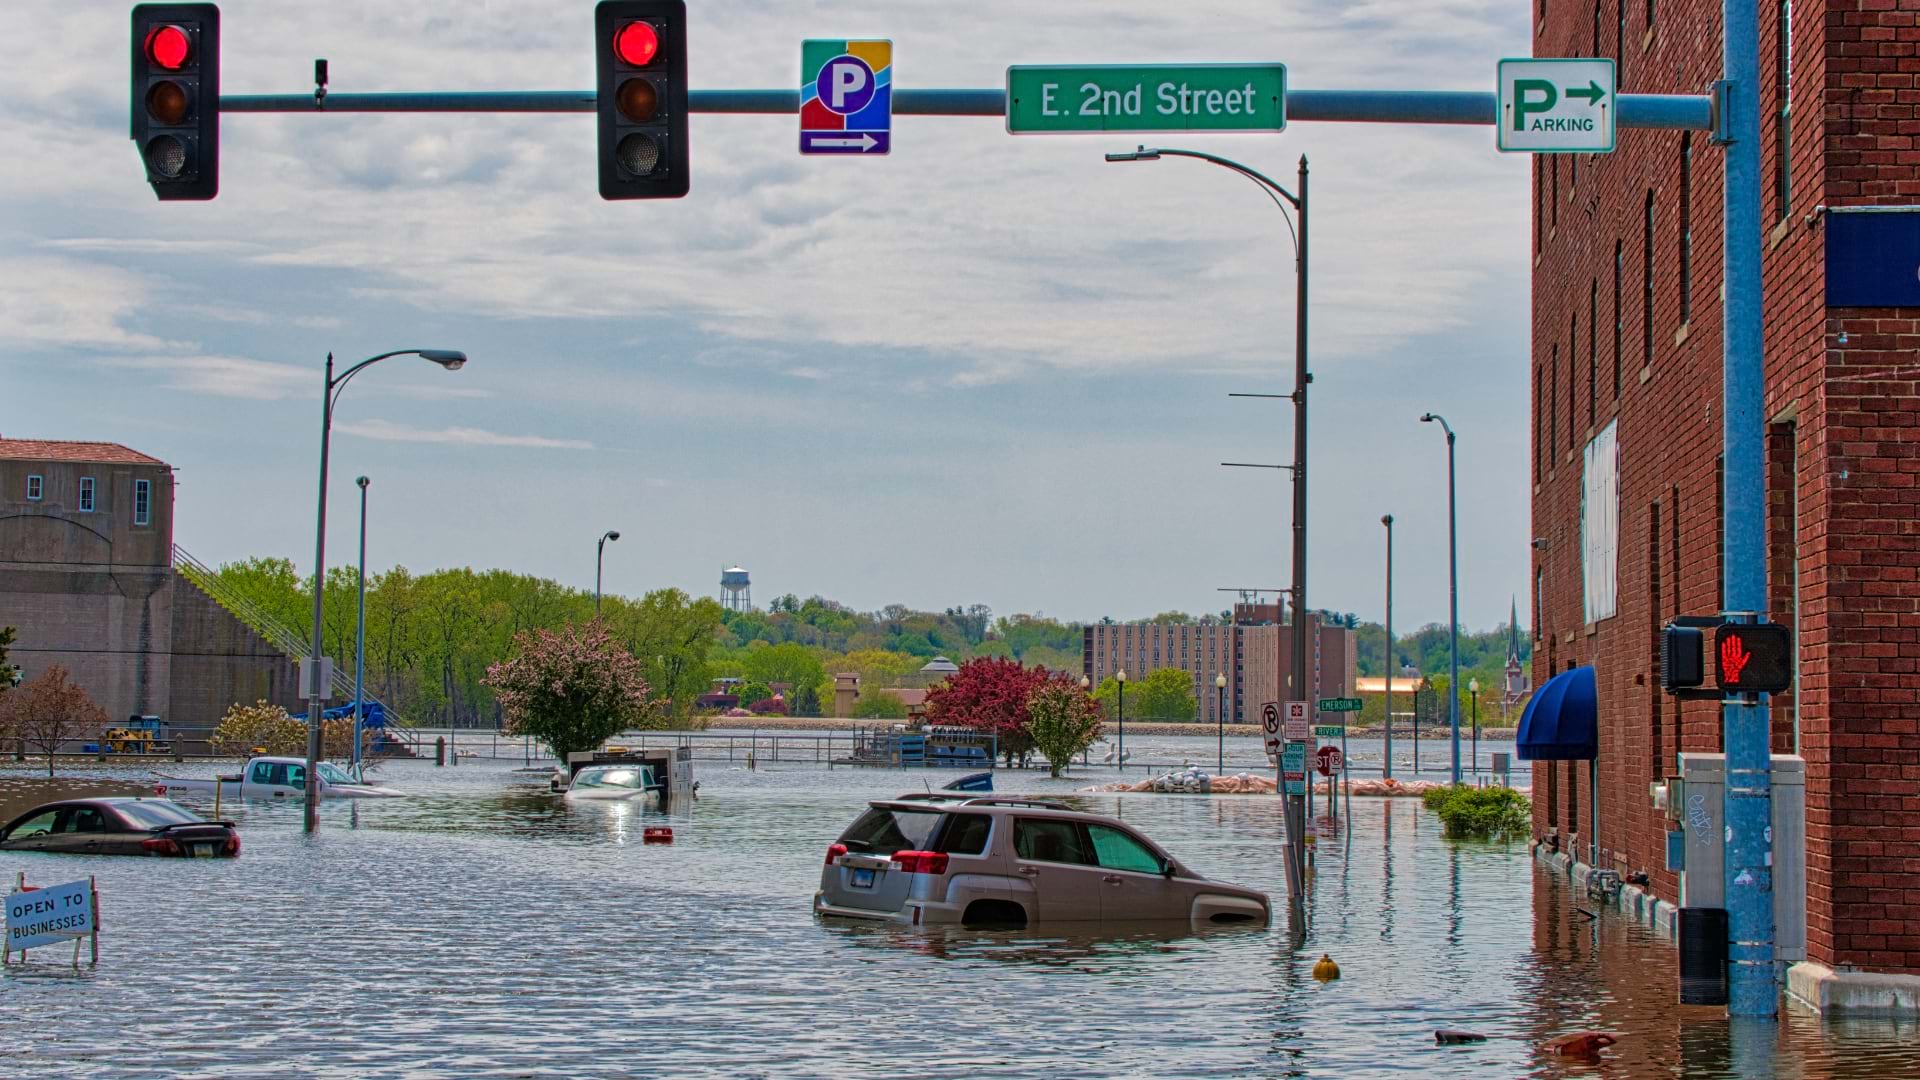
The Something in the Water music festival weekend brought more than 60,000 people to Virginia Beach’s oceanfront over three days in April 2023. Friday’s performances were delayed by weather. Saturday went as planned. But Sunday’s severe weather forced organizers to cancel around 6 p.m.—just as the National Weather Service issued a tornado warning. Minutes later, Virginia’s second-ever EF3 tornado touched down. Emergency responders managed traffic from departing crowds while coordinating disaster response.
The twister carved a 4.7-mile path through a residential neighborhood north of the festival grounds, damaging 115 homes and destroying 12 before tearing through a military base and state park. Dave Topczynski, Virginia Beach’s director of emergency management, compiled damage reports from multiple city systems using paper notes. This is when everyone knew it was time for change.
“We were already gathering requirements for a modern system and looking for funds,” Topczynski said. “The tornado provided the perfect example of why we were asking, and the reason the investment was needed.”
Topczynski and his team had known for years that managing Virginia Beach required a single, integrated view of what was happening across a coastal city with major military installations, over 450,000 residents, and millions of annual visitors. Capabilities their existing systems couldn’t provide them.
Managing Virginia Beach meant monitoring multiple computer-aided dispatch (CAD) systems for individual departments. Add 311 calls, flood sensors, traffic cameras, panic buttons, and coordination with federal partners at major US Navy installations, including Naval Air Station (NAS) Oceana, the East Coast’s master jet base.
“I had 14 different logins to see what was happening in the city,” Topczynski said. “I don’t have enough screens in the EOC [emergency operations center] to show everything we needed to see from the different, individual systems.”
The information silos prevented anyone from compiling a complete picture. Situation reports during incidents required more than four hours of manual collection: Staff gathered details from different departments, copied and pasted from various systems, and checked facts before distribution. Danielle Spach, the city’s mitigation program manager, spent her time on process instead of analyzing conditions and guiding decisions.
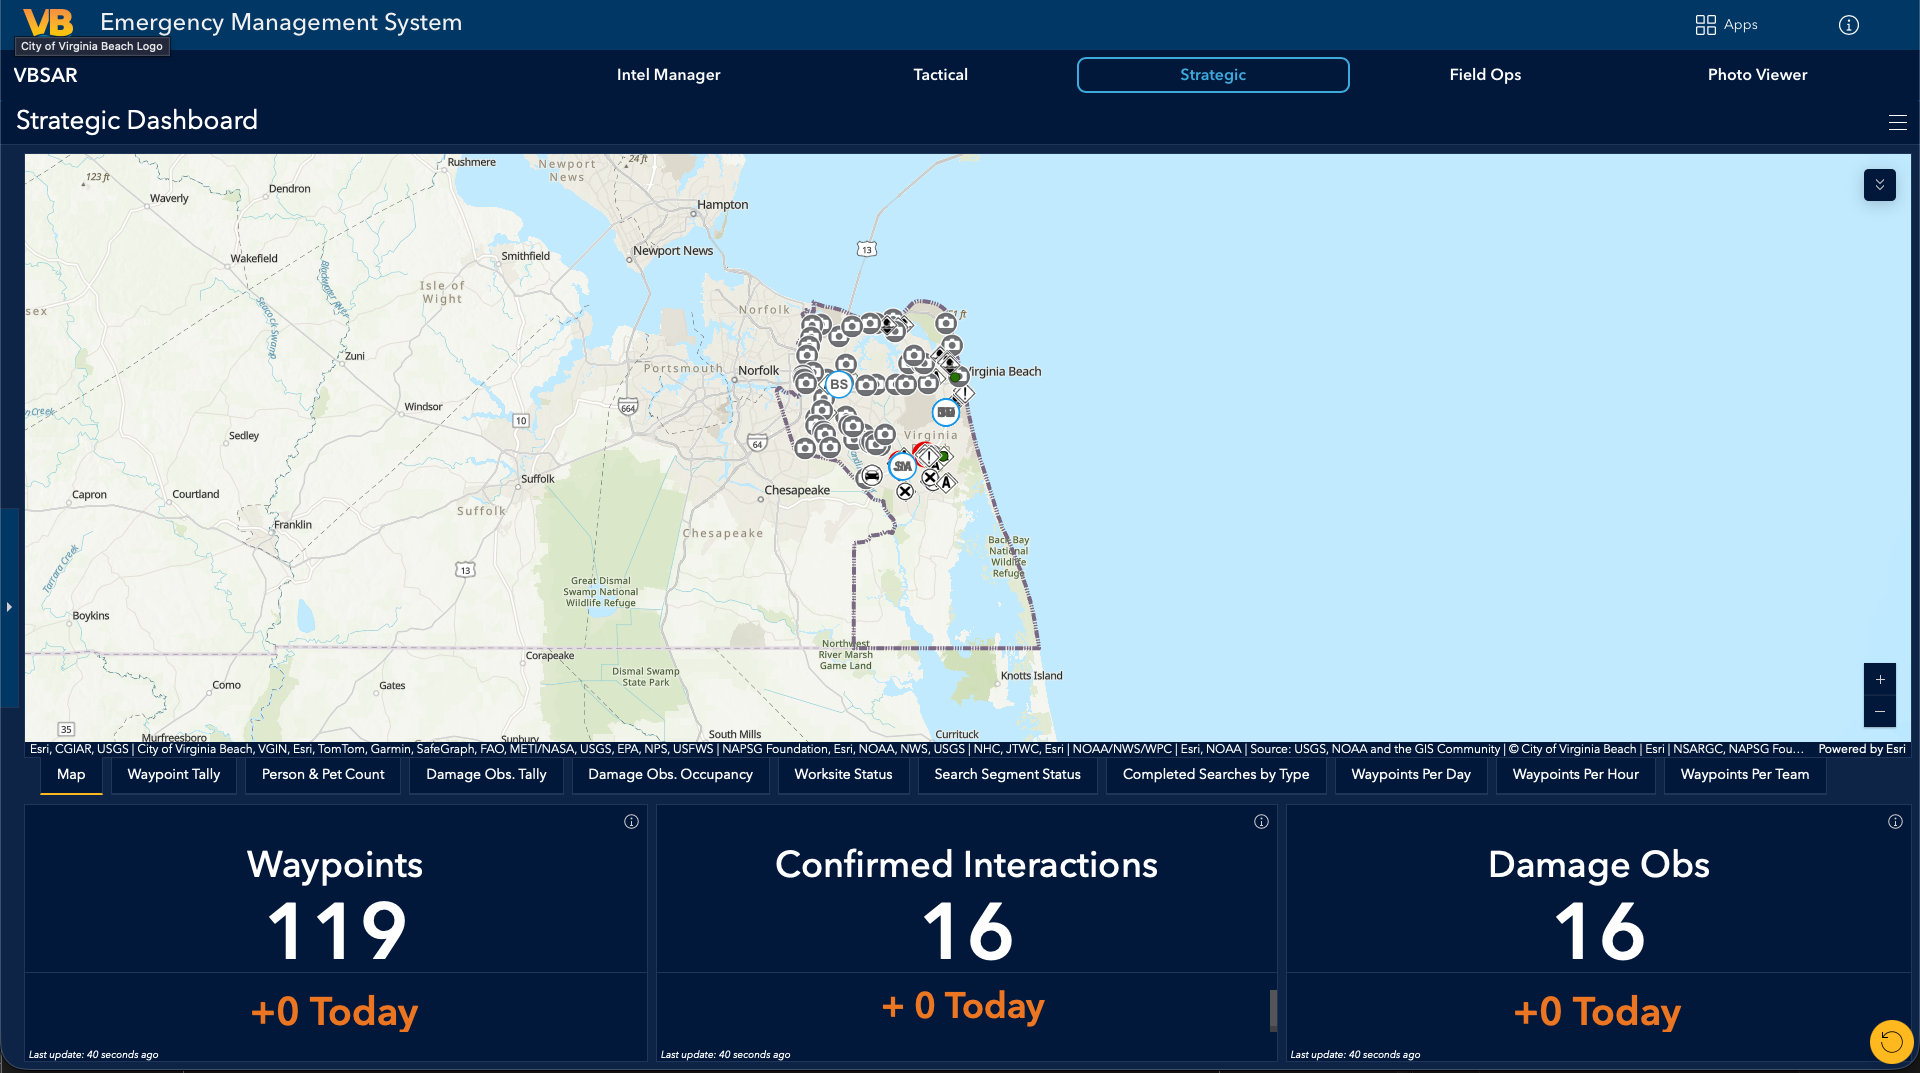
Steve Adams, a captain in the Virginia Beach Fire Department who also serves with Virginia Task Force 2, had seen federal disaster operations display response details on shared maps. “When the tornado happened, we knew right away that we needed to do what we do for federal disaster events, which is to use GIS [geographic information system] apps to collect data in the field,” he said.
He contacted Paul Doherty at the Federal Emergency Management Agency (FEMA) and used their tools to create a dashboard showing real-time conditions. “The department heads had never seen anything like that,” Adams said. His office still conducted daily building inspections using paper forms.
Virginia Beach built its emergency management solution using ArcGIS Solutions, a collection of configurable applications designed for public safety organizations. Working with Esri solution engineers, they customized a single platform integrating data from existing systems.
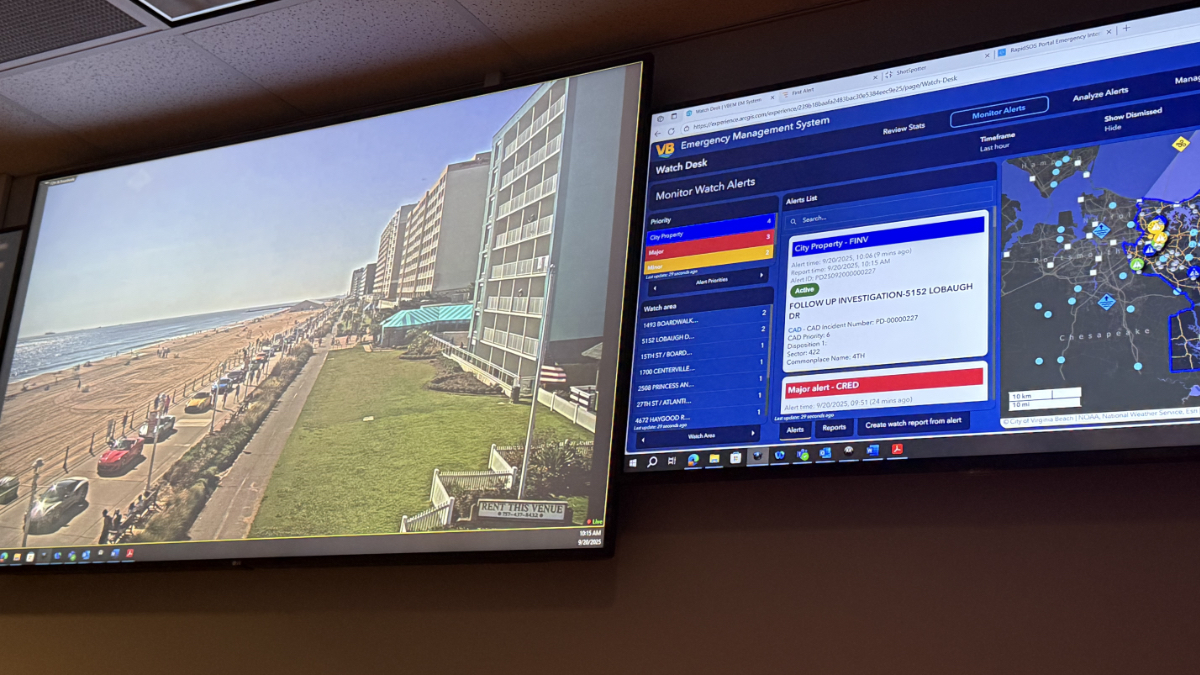
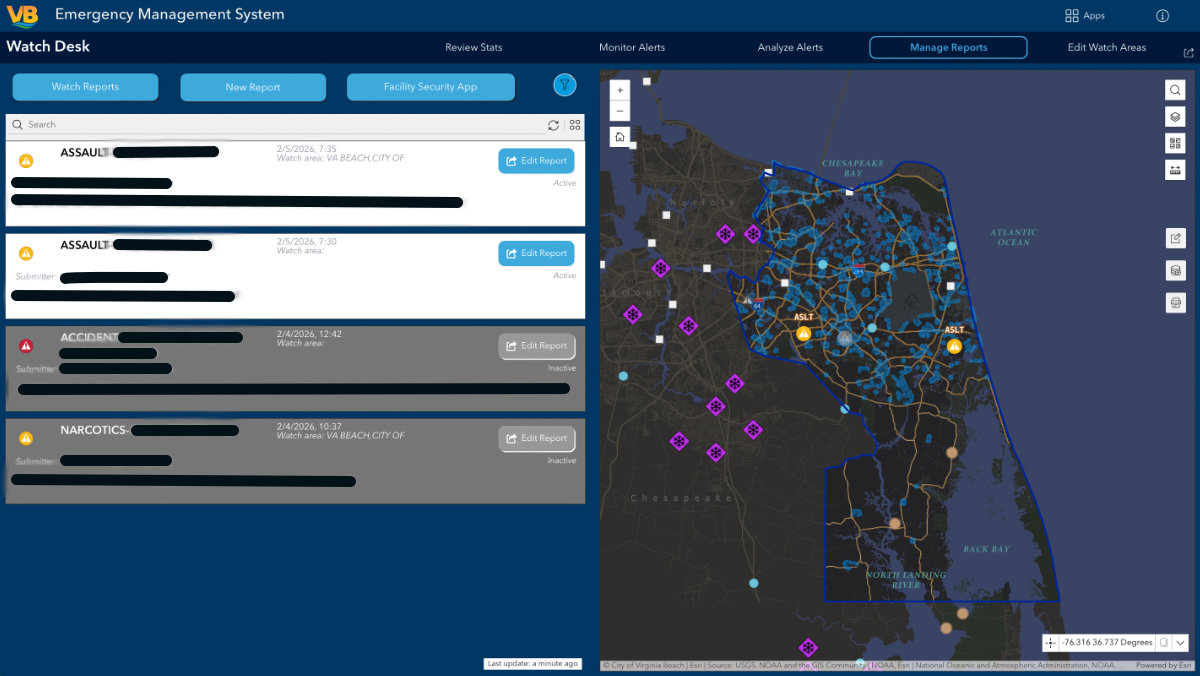
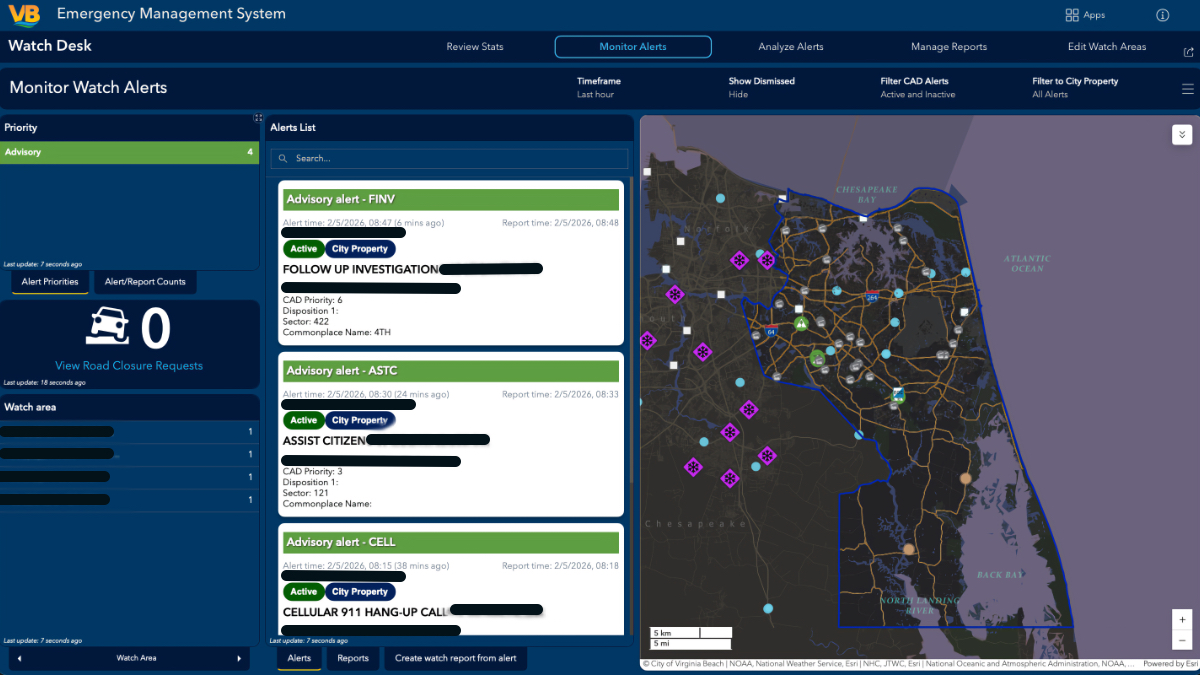
The solution pulled information rather than forcing departments to change workflows. Departments continued using their individual CAD and work order systems. The Watch Center solution aggregated those systems automatically, prioritizing alerts by incident type and presenting information on a single screen.
“Departments keep working like normal,” Topczynski said. “In the heat of the moment when something catches you off guard, you don’t have to figure out how to change workflows.”

When the fire department responds to a call, it appears in their CAD. When public works opens a work order, it enters their system. The solution pulls it all together into a single view for emergency managers—without requiring new processes and without disrupting operations or compromising privacy.
The city started working with an Esri Professional Services team in May 2025 and had working prototypes by July. The improvements were noticed immediately. Multiple logins were eliminated. Staff now logged in using their Active Directory credentials. When a panic button activates in any city facility or school, it appears immediately as an alert. When a fire alarm escalates to a working fire, the watch desk sees it and records it while responders take action.
Situation report creation changed immediately. What previously took Spach more than four hours now takes 17 minutes. She shifted from manual compilation to analyzing risk and supporting decision-makers.
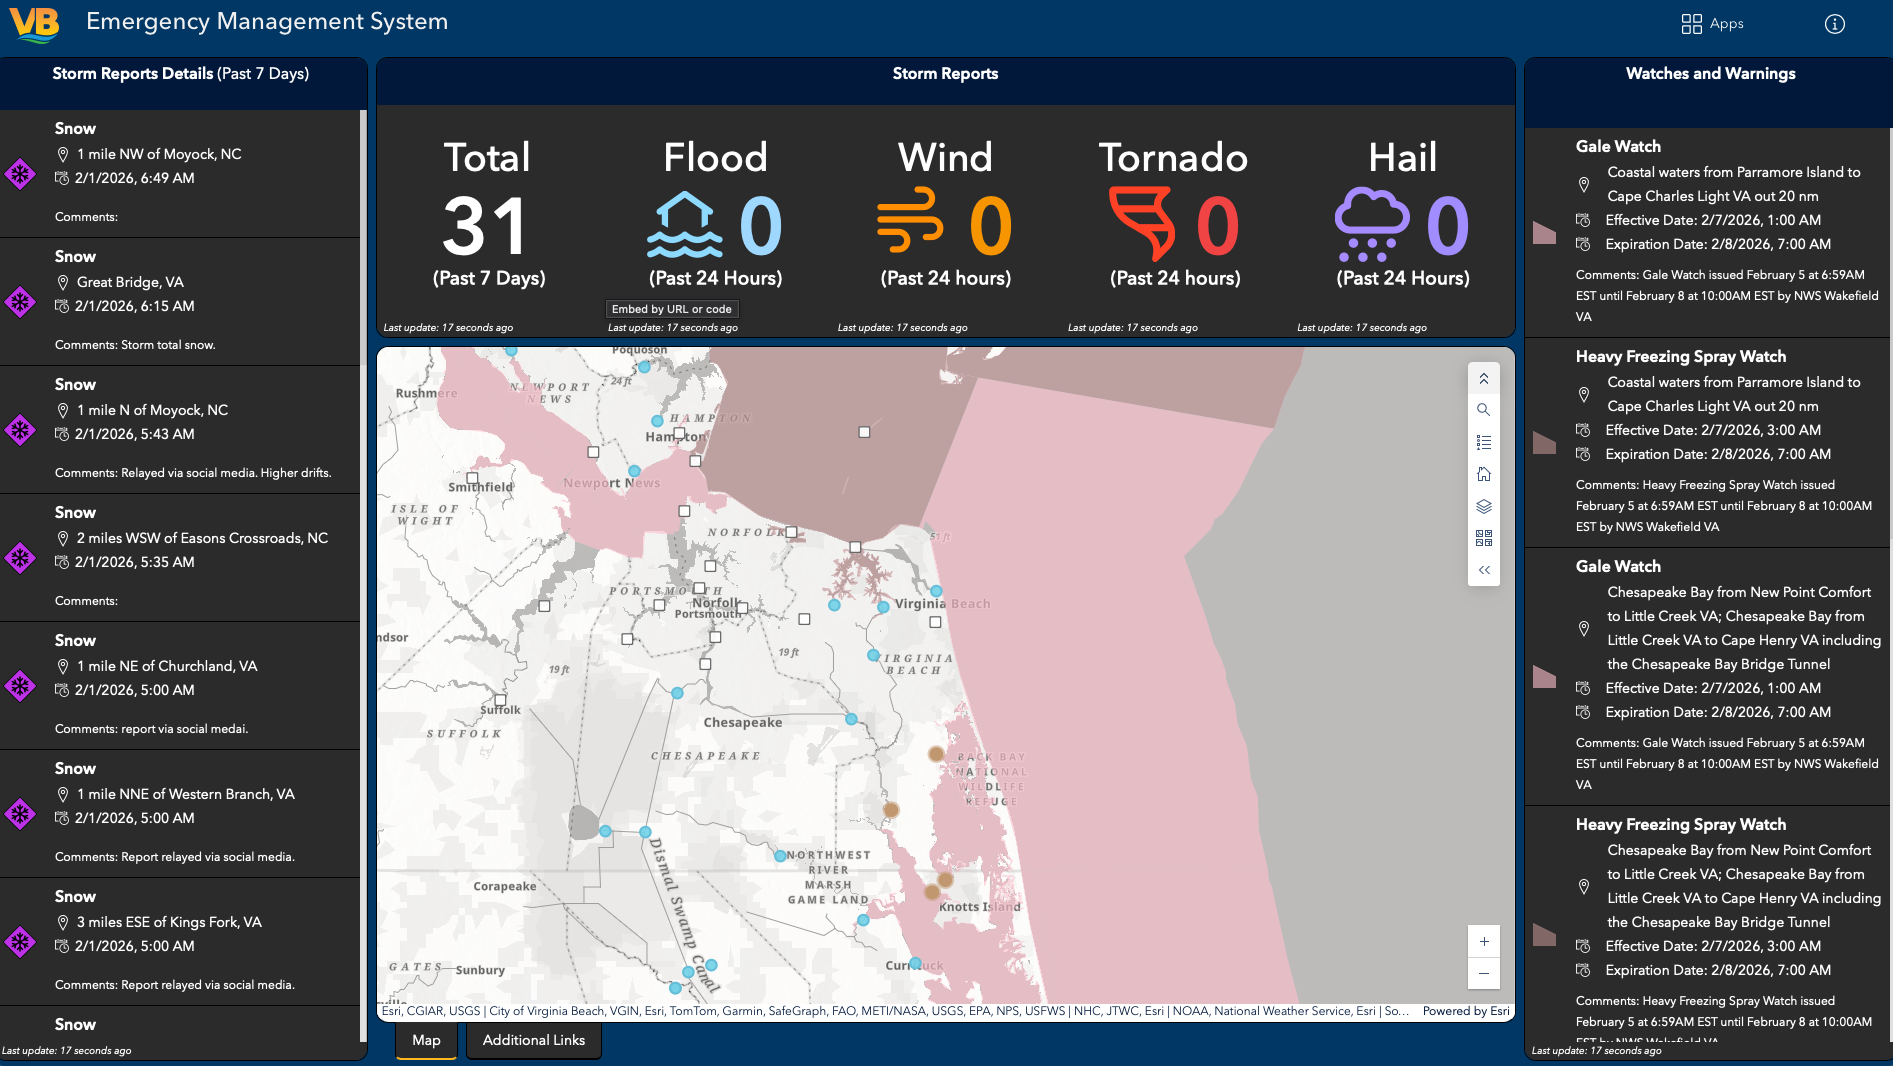
Each successful integration prompted requests for more. The public information tool was developed to feed real-time alerts to residents who can enter their address and see emergency notifications, road closures, and shelter information within a set radius. A planning tool incorporating census and demographic data allowed staff to click any map point and instantly see population by age, daytime versus nighttime population, pets per household, vehicles per household—information needed for shelter and evacuation decisions.
“The are multiple calls for a flooding roadway, but because we have one awareness solution, I can see we have a water main break,” Topczynski said. “Now, from the first calls, we’re already putting together how to manage it—providing information in real time that’s validated and accurate, in minutes instead of hours.”
The momentum continued to the Fire Marshal’s Office. Adams tested digital inspection forms with four inspectors who ran paper and digital side by side for six months. Digital proved better: clearer data, mapped locations, built-in error checking. Within months, all 18 inspectors switched.
“The people who were most reluctant to change love it,” Adams said.
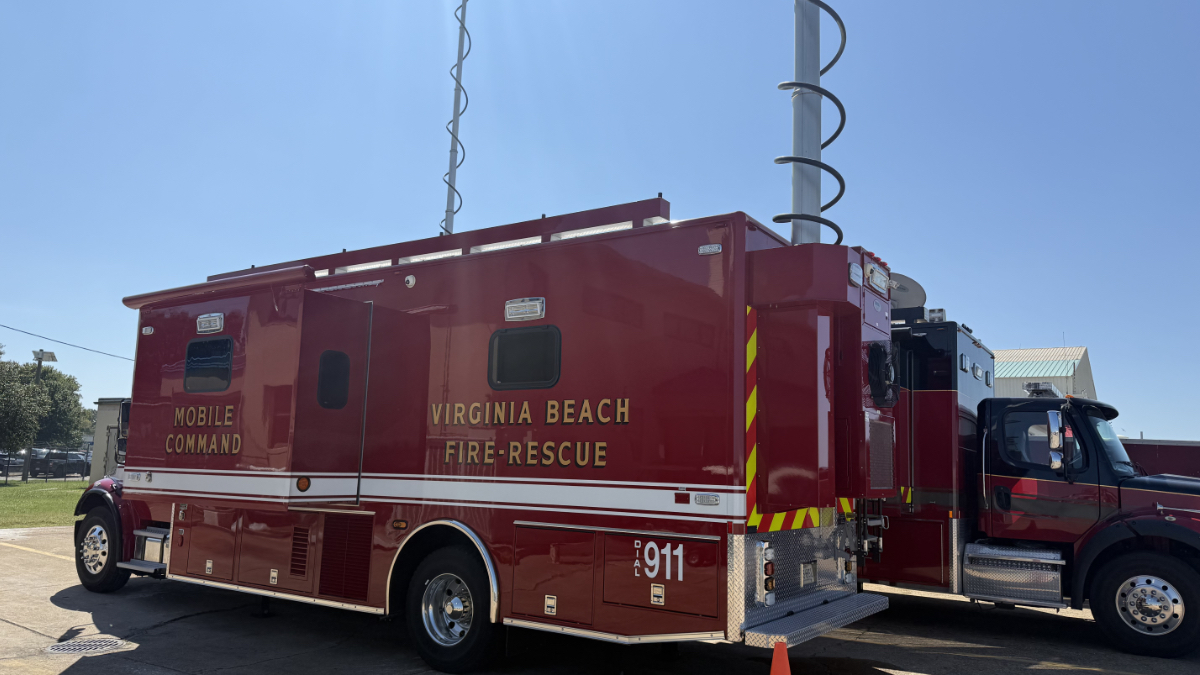
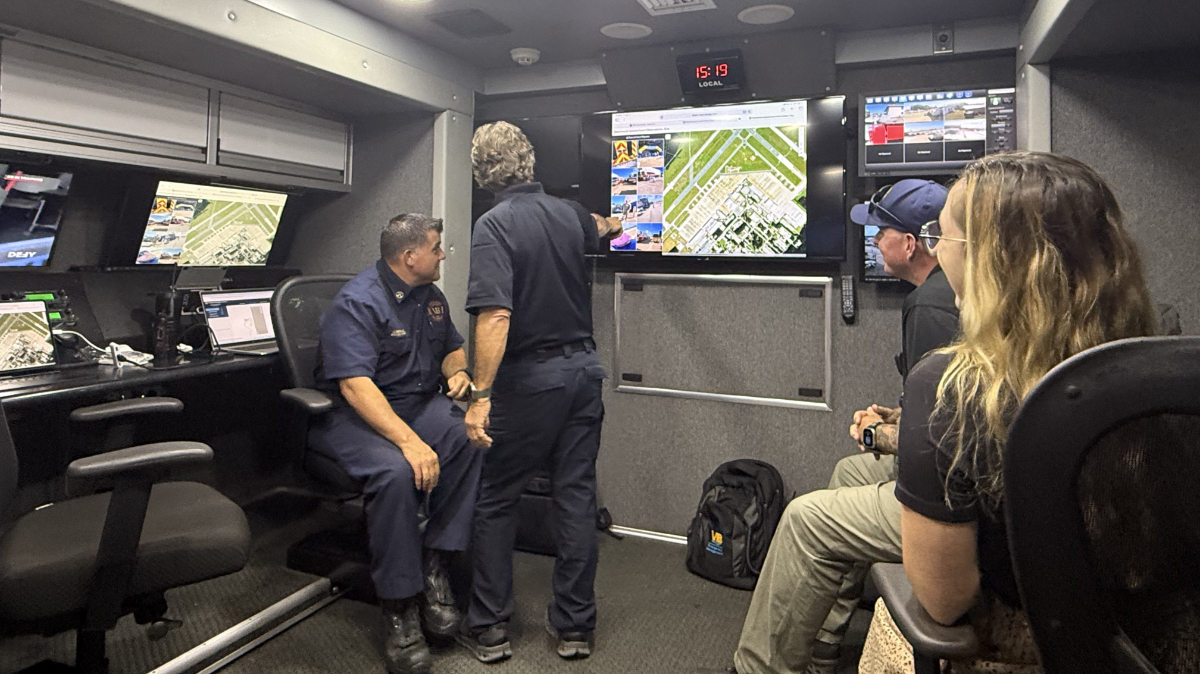
By September 2025, Virginia Beach was ready to test at scale. The NAS Oceana Air Show draws more than 300,000 people over three days to watch aerial demonstrations and see military aircraft. Esri Professional Services consultants Payten Jarnagin and Grace Fernandez deployed alongside Virginia Beach teams, bringing the flexibility that had defined the entire project. Teams described needed workflows—tracking personnel across the airfield, logging incidents as they occurred—and consultants configured applications in hours. Each app fed data back to the solution, building shared awareness that let emergency managers coordinate response across the event.
“We weren’t running the air show with the app,” Topczynski said. “We tested our applications at the air show, with our previous platform still in use so that we could test the new system safely. The Navy ran operations like they normally do. We sat there with computer screens next to their large charts and boards, validating whether our solution worked in real time.”
Over three days, the system tracked 88 medical calls, a hazmat diesel spill, and numerous other incidents outside of the air show perimeter, while Navy personnel continued established protocols. Adams, working with solution engineers during downtime, described his need to track responders across the venue. Within hours, they had built a personnel tracking capability. At the emergency operations center, the watch desk maintained routine citywide monitoring—traffic, 311 calls, flood sensors—while monitoring air show incidents. Everyone noticed.
The air show validated the system. The return on investment shows in daily operations: When the watch desk is staffed, emergency managers issue 93 percent more alerts to city departments—not because there are more incidents, but because they catch incidents they would have missed.
Reflecting on the tornado moment, Topczynski said, “I was managing the event, but I didn’t have the capability to manage a fully declared disaster at the same time. I couldn’t turn my eyes away from 60,000 people relying on shuttles while teams are searching destroyed homes. I needed one tool that could handle both.”
Since going live, Topczynski has fielded calls from emergency managers across Virginia and beyond—Oklahoma, Delaware, Florida. Smaller jurisdictions assume Virginia Beach’s approach required extensive IT resources. But when a smaller jurisdiction’s lone GIS coordinator sees what’s possible through integration, the conversation shifts from “We can’t afford this” to “We can actually do this.”
Now, Virginia Beach is testing new damage assessment tools for public utilities and real estate assessors. They’ve developed evacuation tools for health and human services to manage reunification or evacuation centers. Staff previously dedicated to password resets in the old systems are now deploying as emergency management liaisons to command posts.
From paper notes to integrated awareness in 18 months—without replacing a single department system. The technology to unify response already exists. The transformation isn’t about budget. It’s about integration.
Learn more about how GIS provides real-time solutions to modernize emergency response operations.