Any analyst who has briefed an executive knows that sharing one piece of data—say, consumer spending trends in key markets—inevitably elicits requests for more data, along with questions like, “How does that spending correlate with our customer segments?”
To create business intelligence that’s readily available, analysts must tap data stored in data lakes, data warehouses, GIS databases, spreadsheets, even websites.
Good analytics tools don’t discriminate—they make sense of data wherever it lives. Top companies use geographic information system (GIS) software to analyze diverse sources of data and view business impacts through a geospatial lens.
A No-Code Dashboard of National Sales Data
The video below illustrates how a sales executive overseeing a national network of insurance agents can access location intelligence through a rich, responsive dashboard.
Starting with a basemap displaying agents’ locations and territories, an analyst links to a Snowflake database and an Amazon storage service, adding detailed policy records and agent metrics to the map. Locating the data and displaying it in a visually appealing dashboard is a drag-and-drop process.
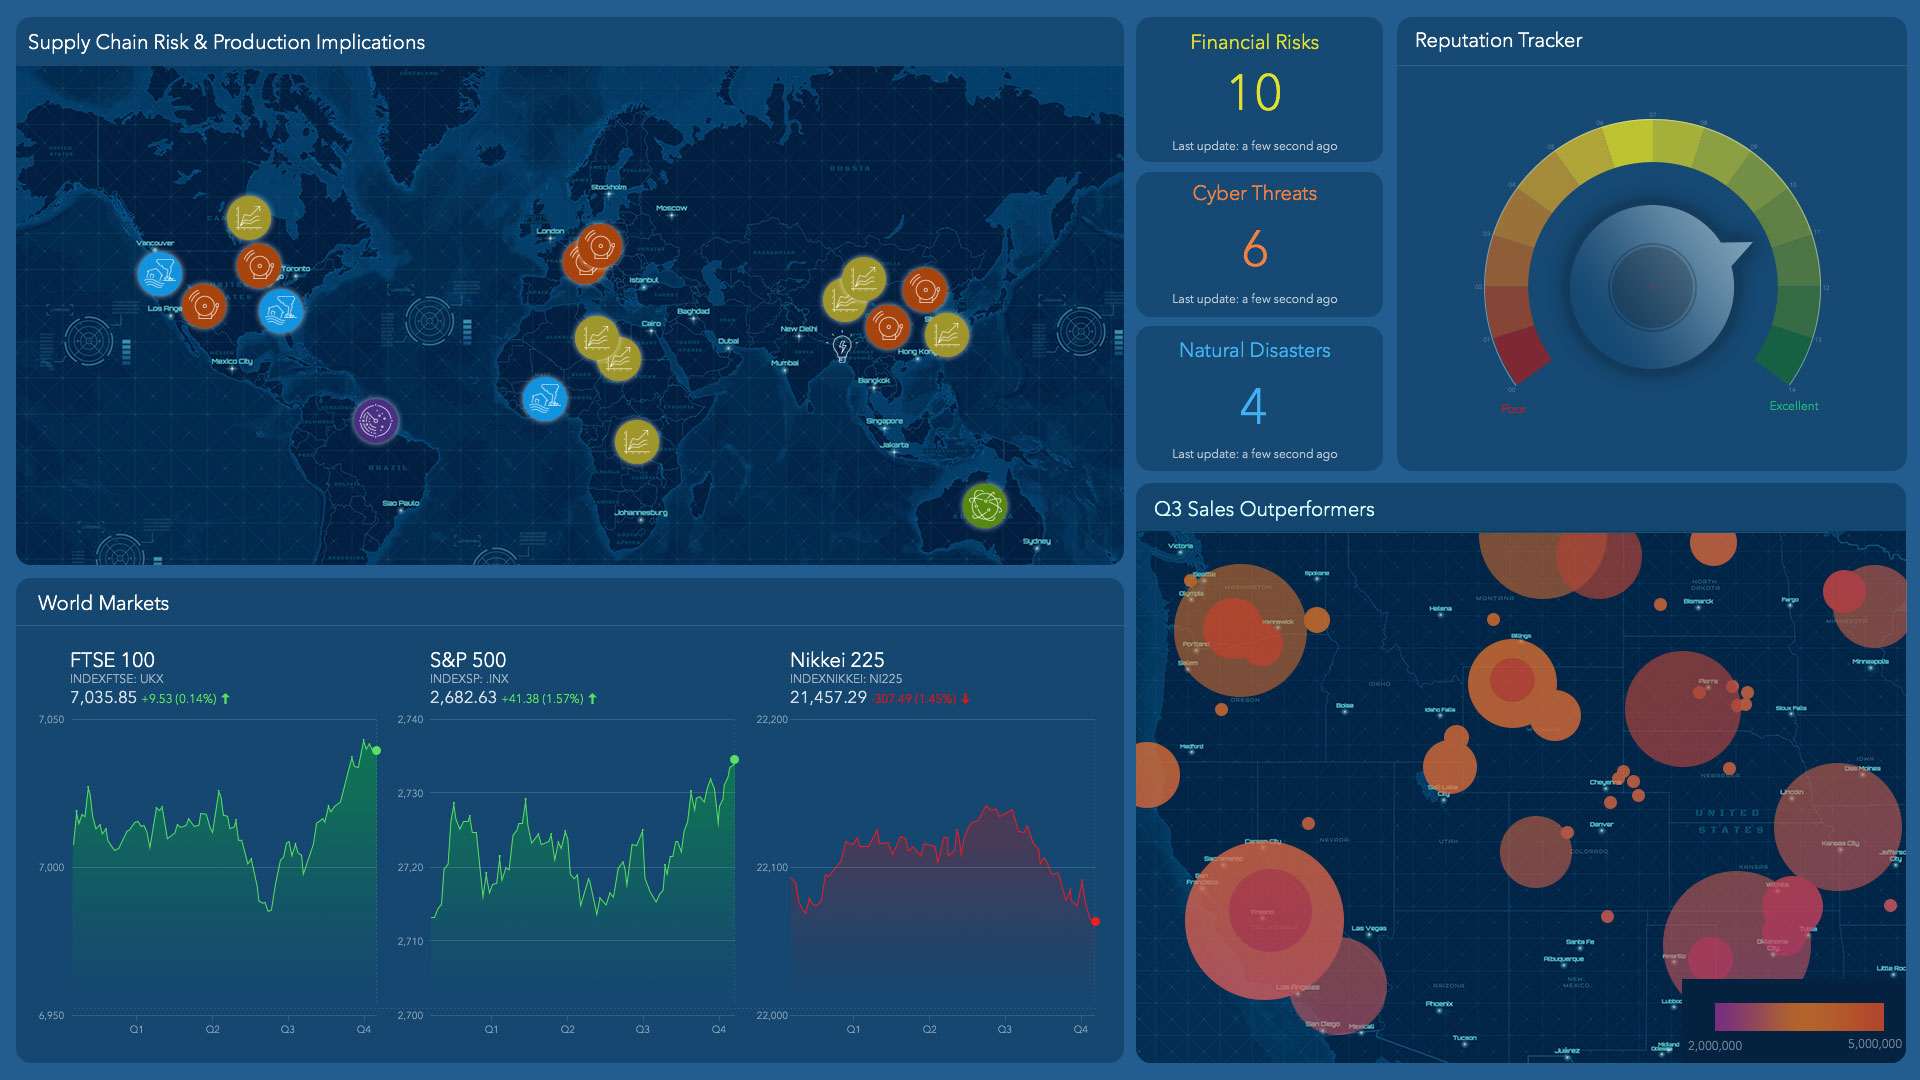
The result is a no-code dashboard of agents, sales territories, claims statistics, and hazard data. As an executive asks questions, the analyst can zoom in for the most relevant view, revealing the distribution of policies in a single county or an overview of national trends.
Indicators on the dashboard help sales executives see revenue and risk patterns across portfolios. They can check which hazards are more prevalent for commercial or residential buildings, or gauge how concrete buildings perform against certain risks compared with wood frame structures.
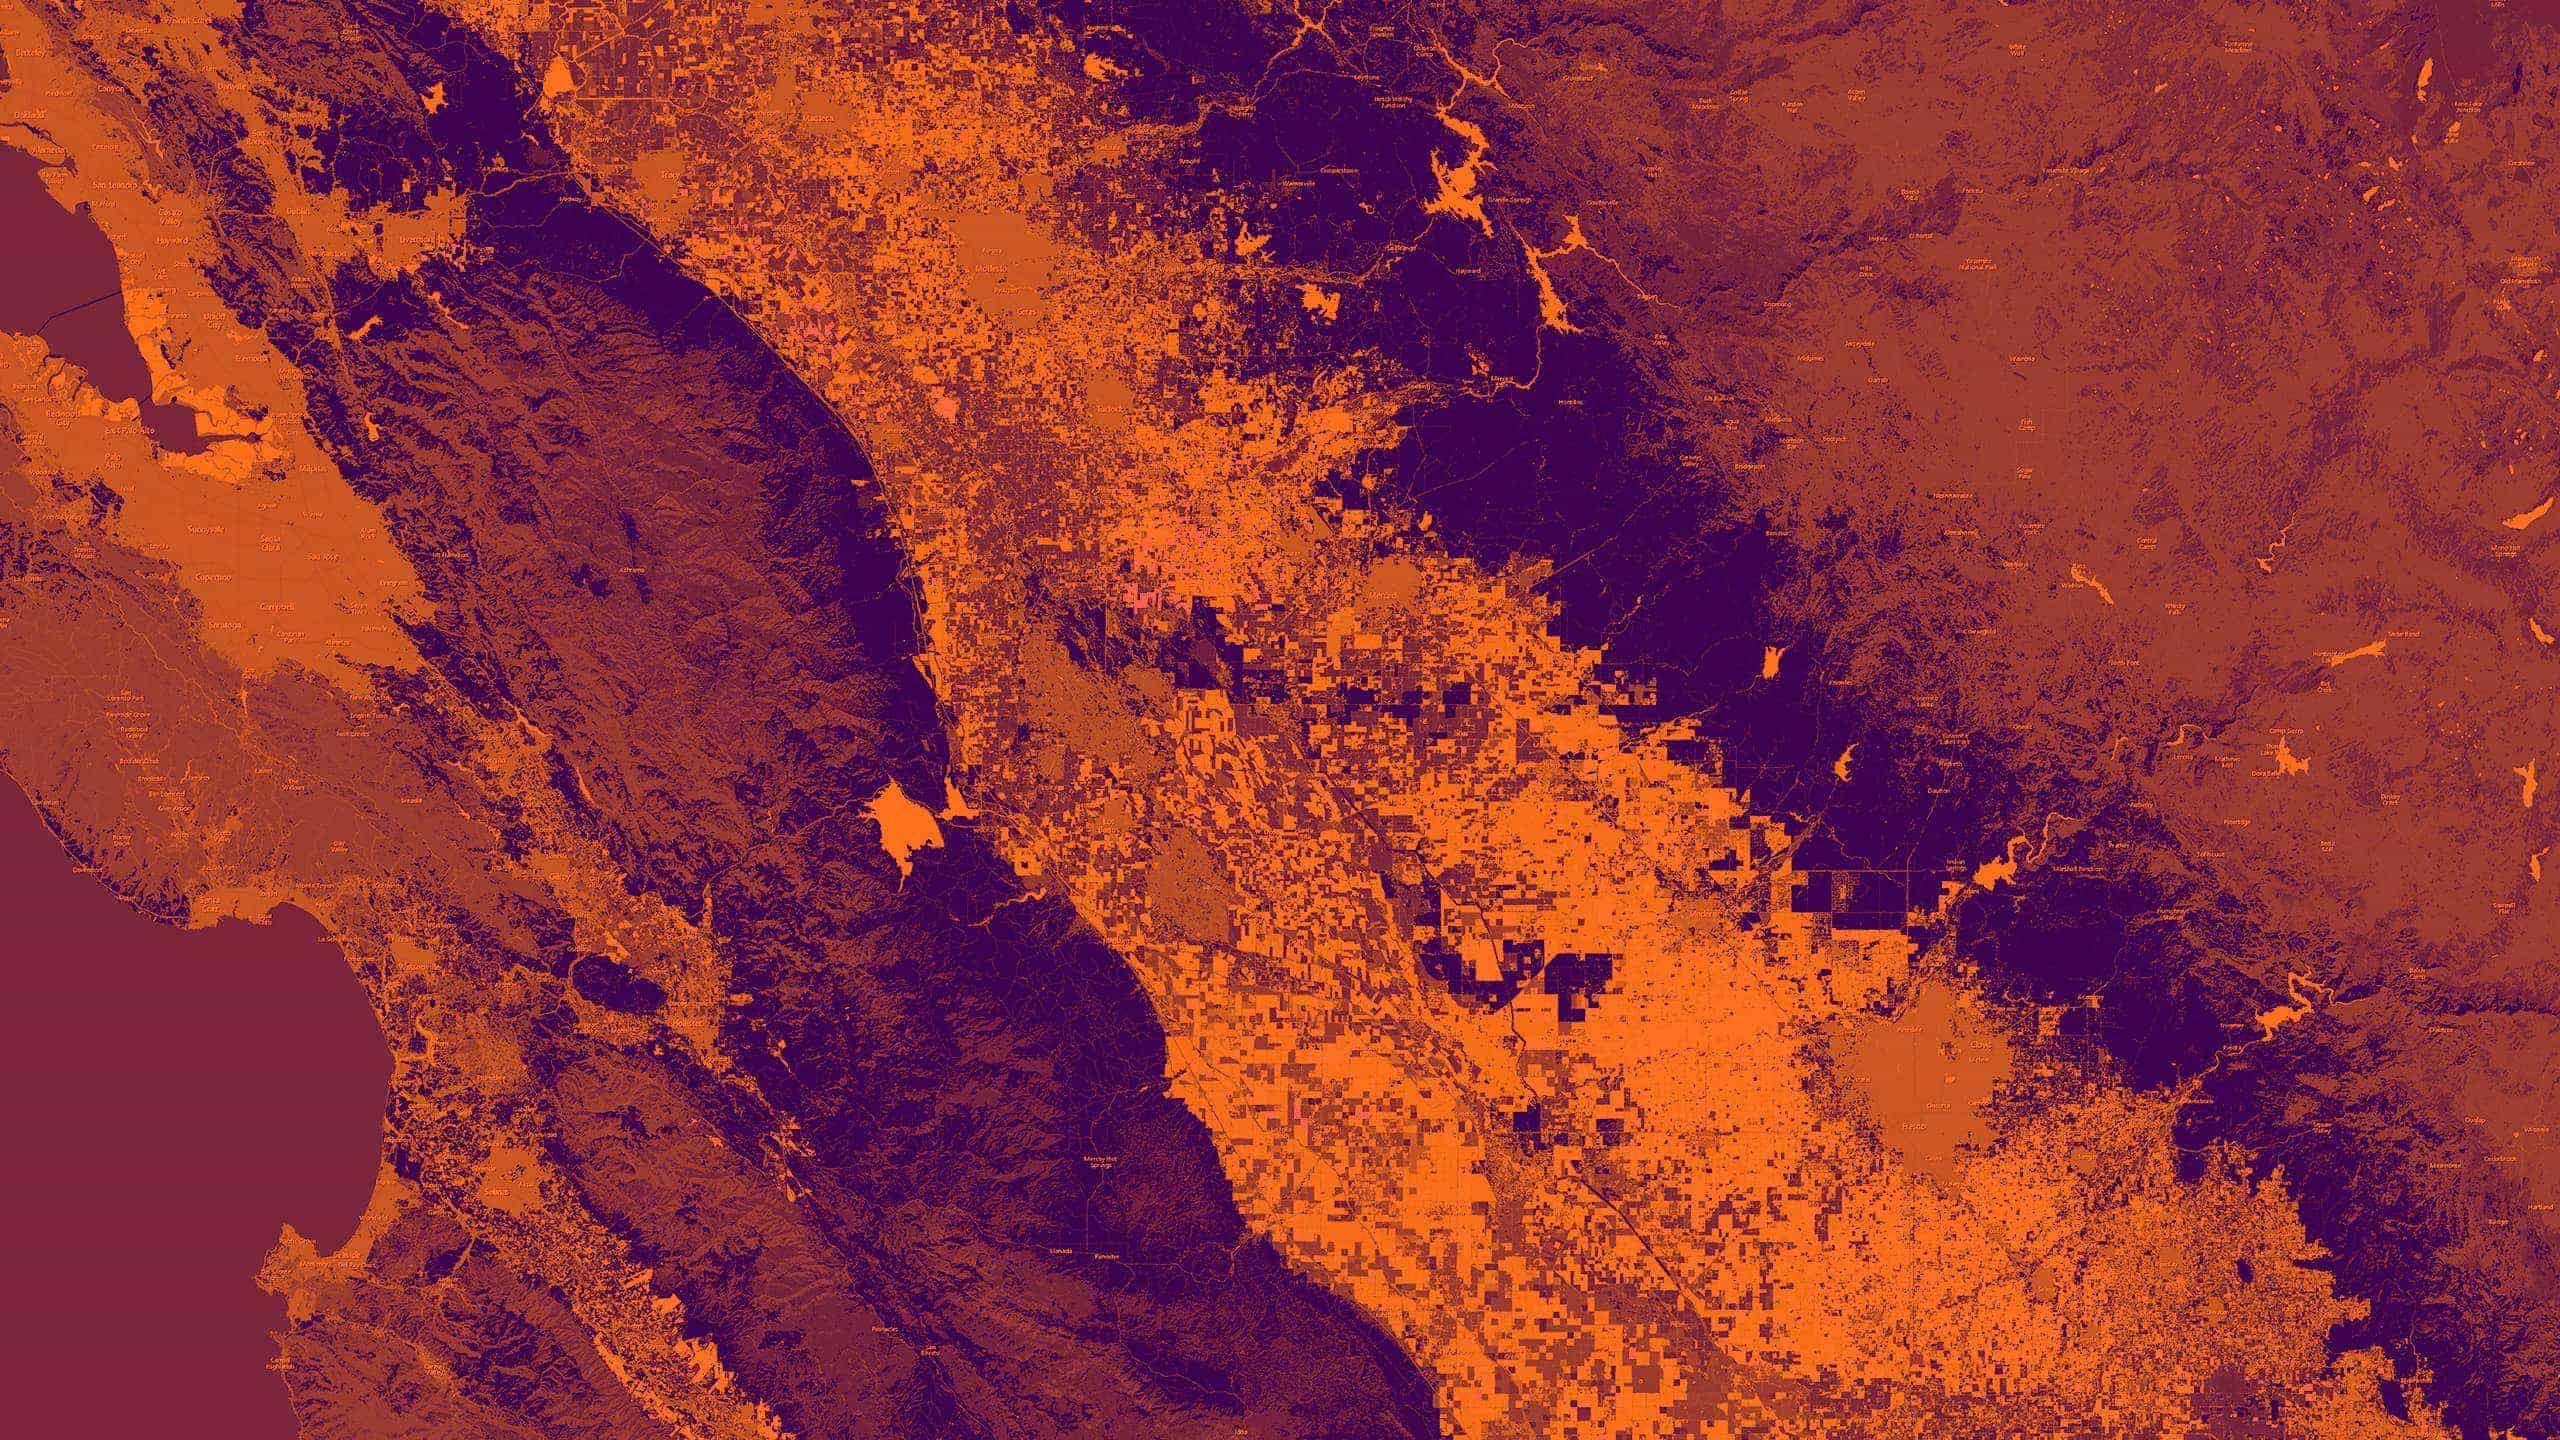
Clicking on a name brings up an agent’s territory and policies, symbolized by dots on the map. The color and size of the dot convey the status and size of the policy, offering a snapshot of the local market.
From Questions to Insights, in a Few Clicks
This example examines applications for an insurance firm, but any sales organization can use location software to integrate a range of data sources and access insight through a no-code dashboard.
A telecommunications company that has expanded through acquisition might have some customer data stored in an Azure cloud data warehouse and other records in Databricks tables. A GIS analyst can weave those sources onto a map or dashboard that a sales team can use to target potential growth areas.
For an auto parts wholesaler, a dashboard that combines data on its national network of stores, the location of competitors, and consumer psychographics could inform decisions on how to reach customers in regions targeted for growth.
Business leaders today are eager to interrogate data. With a no-code dashboard that integrates information from disparate data sources, the answer to the next question is often just a few clicks away.
The Esri Brief
Trending insights from WhereNext and other leading publicationsTrending articles

December 5, 2024 |

June 23, 2026 |

June 2, 2026 |

May 26, 2026 |

April 7, 2026 |

March 3, 2026 |