One of America’s most famous writers once observed, “Everybody talks about the weather, but nobody ever does anything about it.” While it’s anyone’s guess what Mark Twain would think of big data and predictive analytics, he might have been pleased to see companies using these tools to do something about the weather.
One Fortune 200 food and beverage chain, for example, has learned to correlate weather to its customers’ buying behavior and now uses that insight to anticipate their needs and boost sales.
The company’s analysts have studied the impact of weather on various buying habits, including the temperatures at which customers switch from ordering hot drinks to cold drinks and vice versa. The analysts also know how many loyal customers will visit on rainy or cold days and how many walk-in customers to expect during those conditions.
To gain this insight, the company combined three key elements: weather data from a national weather information provider; the company’s own point-of-sale and loyalty-program information; and a geographic information system (GIS) to analyze the relationships between those datasets geographically, store by store.

Companies on the forefront of predictive analytics are embracing the science of where consumer demand meets weather.
The business benefits of the predictions accrued quickly, particularly when scaled across hundreds or thousands of locations. The company can now read the weather to anticipate which products to stock and where, and which ones to promote through regional or local marketing campaigns. Those observations have spurred a transformation: instead of reacting to customer demand, the company uses the weather to get ahead of it. This and other innovations have helped the company fend off growing competition and maintain its market share.
Weather and Commerce: An Unlikely Alliance
It wasn’t always this way. Before the dawn of reliable forecasting, storms arrived with scant warning, scuttling ships, destroying cargo, and ruining crops. In Twain’s heyday, no one could do anything about it. In 1870, that began to change, when the United States Congress created a national weather organization, in part to forecast storms on the Great Lakes and the Atlantic Seaboard. In each of the two prior years, weather-related shipwrecks on the Great Lakes had numbered in the dozens.1
As part of the fledgling national weather service, local observers at one station would note atmospheric conditions and then telegraph the news ahead to the next station, creating a daisy chain of information across the country. But what the service boasted in ubiquity, it lacked in precision—its forecasts were based only on the assumption that storms moved from west to east.
These and other early efforts at weather prediction—including the popular farmers’ almanacs, which were about as reliable as a coin flip, experts now say2—look primitive to modern eyes. But they answered, however simply, a critical business need: to plan operations based on coming conditions.
In the past decade alone, the analysis behind weather forecasting has improved markedly, thanks to computing power, big data analysis, and better mapping capabilities.
Matt Gaffner recalls the state of weather analysis in 2006, when he joined Weather Decision Technologies, a company that provides weather data to businesses across the economy. During his early days, Gaffner supplied insurance companies with data on recent hail activity.
“I would accumulate the data by hand, then spend a day analyzing it before we sent it to our clients,” he explains. “The data was accurate to within four kilometers. Now we have a system that analyzes the hail in real time, to a quarter kilometer, and updates every five minutes.”
Today, companies use that and other types of data to minimize weather-related disruptions. But like the food and beverage chain, some are doing much more: they’re enlisting big data analysis to better understand how weather affects their customers’ behaviors. With that knowledge in hand, they’re adjusting operations to maximize sales and minimize unnecessary costs.
An Energy Company Primes the Pipeline
It may have been inevitable that ONEOK, Inc., would become a pioneer in weather-based predictive analytics. With an energy company’s ingenuity for surviving boom-and-bust cycles and an Oklahoman’s reverence for the weather, this Fortune 500 energy midstream service provider is turning big data predictions into a healthier bottom line.
Headquartered in Tulsa, Oklahoma, ONEOK (pronounced “one-oak”) is a leader in the gathering, processing, storage, and transportation of natural gas, operating 38,000 miles of natural gas and natural gas liquids pipelines in the Mid-Continent, Williston, Permian, and Rocky Mountain regions.
With the help of weather forecasts and GIS-based analytics, companies are moving closer to the age-old goal of perfectly—and profitably—matching supply to demand.
As the summer of 2016 began, the price of natural gas stood at approximately half of what it had been 18 months earlier, creating pressure on companies industry-wide to lasso costs and run more efficient operations. While other energy companies cut projects and hunkered down, ONEOK invested in a new technique that would help it through the downturn and accelerate it in the boom days to follow.
The initiative began with a basic observation. ONEOK knew that weather plays a role in the demand for natural gas: In the simplest terms, when temperatures change, demand for natural gas tends to change with it, increasing as the temperature falls and subsiding as temperatures rise. For years, the team had used that basic premise in its planning. But if the team could establish a more precise correlation between weather and demand, it could position gas in advance and avoid the extra cost associated with short-term movements—the way a manufacturer avoids expedited shipping to keep costs down.
To tackle the challenge, ONEOK’s GIS experts delivered intuitive, detailed maps that would help decision-makers visualize the business intelligence they needed to make better decisions.
Big Data Chips In
Before ONEOK could look forward, however, it had to look back. The key was to establish a more precise correlation between weather and demand, an exercise that demanded big data analytics. The company pored over 10 years of temperature, precipitation, and wind-speed data across its territory, which spans the Midwest, from Texas to the US-Canada border.
That data, provided by Weather Decision Technologies, amounted to 86 million records. Next, the team cross-referenced those records against flows from its gas measurement systems to gauge customer demand.
Tammy Hall, ONEOK’s manager of GIS, explains what the data revealed:

“We saw that, historically, when we’ve had this sort of weather pattern, these kinds of demand events have occurred. So we could begin looking at those patterns and really start to do some predictions and analysis in advance to know where to flow gas.”
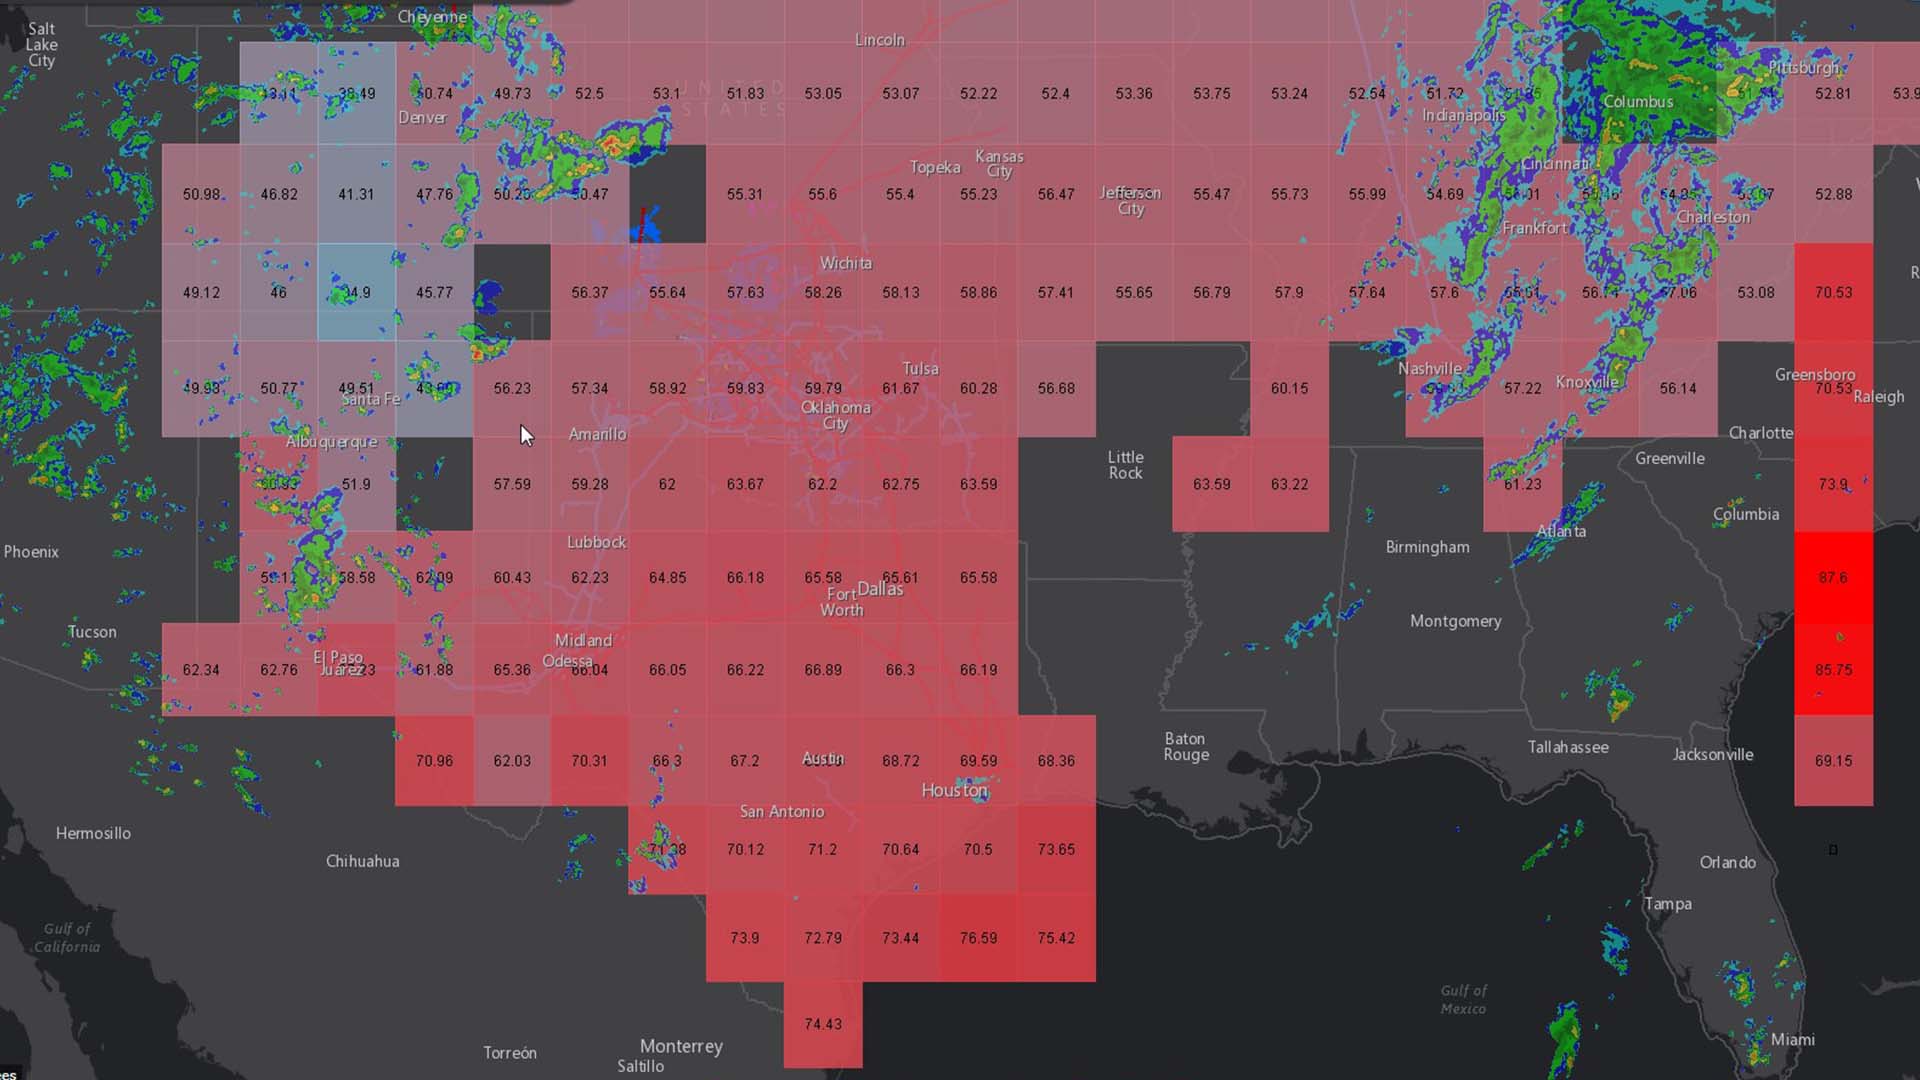
Using GIS technology, ONEOK professionals now see reliable weather information on a map of their territory. If, for instance, the Weather Decision Technologies data predicts a temperature drop of 16 degrees in Oklahoma City four days from today, ONEOK may move gas through its network to better serve those customers.
This intelligence is helping the company make smarter decisions.
“This visualization has helped the company in numerous ways, from planning to real-time decision-making,” says Sean Holmes, a GIS specialist at the company. “ONEOK employees now have a single authoritative source for weather and pipeline information that they can collaborate on. GIS is creating a cohesion that is increasing communication, helping us make better and faster decisions and ultimately improving our bottom line.”
The Tools to Get Ahead
In Mark Twain’s day, predictive analytics meant telegraphing Cleveland to say a storm might blow in soon.
Today, Gaffner, Hall, and Holmes represent a new breed of analyst, exploring the science of where and how weather impacts business. They and professionals like them—in organizations big and small—have ready access to advanced meteorology data, GIS technologies, and analytics that offer much more precision—at a much lower cost.
With those tools and some innovative thinking, they’re finally getting ahead of the weather.
References
1. Craft , Erik B. “An Economic History of Weather Forecasting,” University of Richmond. https://eh.net/encyclopedia/an-economic-history-of-weather-forecasting/
2. Neuman, Scott. “Punxsutawney Phil vs. The Farmers’ Almanac: Whom Do You Trust?” NPR. http://www.npr.org/sections/thetwo-way/2014/02/01/269999572/punxsutawney-phil-vs-the-farmers-almanac-who-do-you-trust
The Esri Brief
Trending insights from WhereNext and other leading publicationsTrending articles

December 5, 2024 |

March 3, 2026 |

June 23, 2026 |

March 17, 2026 |

April 7, 2026 |

June 9, 2026 |