2020 was a tough year for all of us. Maps tracking COVID-19 became one of the most prevalent news items, and one the best tools for helping us stay up-to-date and have a better understanding of how the virus has spread – like the Johns Hopkins dashboard, which quickly became a global reference for tracking the COVID-19 pandemic.
Using this data use case as a reference, we’re excited to introduce an improved symbology workflow, now available in ArcGIS Earth. In addition to Location (Single Symbol), two new symbol types can now be used:
- Type (Unique Symbol) symbology applies a unique symbol to every feature based on its attribute value. This symbology is used to show different types of data (categorical data).
- Counts and Amounts (Colors) symbology applies graduated colors to features to show a quantitative difference. Data is classified into ranges that are each assigned a different color from a color ramp to represent the range.
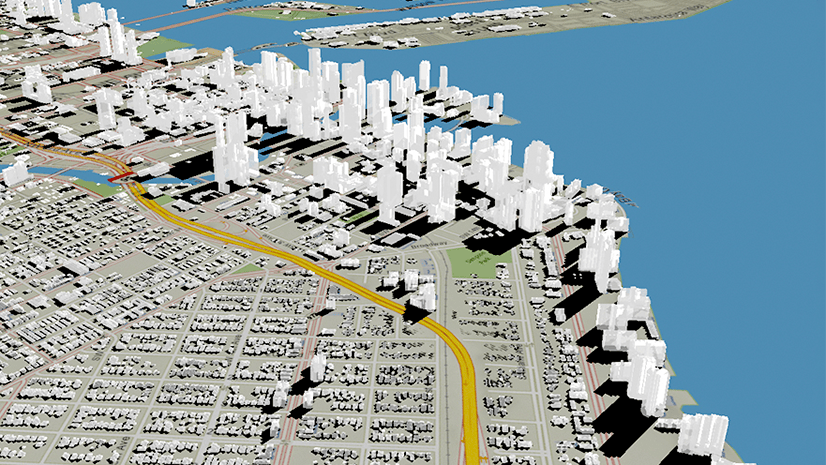
Not only you can track data in 2D with ArcGIS Earth, but now we are also offering 3D symbol extrusion to help observe and explore data spatially. This article will offer a step-by-step guide to teach users how to style and visualize their data.
Please note: the sample data of COVID-19 cases used in the following demo is historical and documented the very early stages of state-level confirmed cases in the USA. It does not represent the current status and should not be used as a reference source for current statuses.
Symbolize pandemic data on the globe
To express pandemic data on the globe from 2D to 3D, follow these steps:
1. Connect to ArcGIS Online, type covid-19 as the keyword to search for data of interest. In this case, we add a layer named COVID-19 Cases US onto the globe:

2. Right-click on the layer in the table of contents and select Symbology from the menu. The Symbology window will appear.
3. Under the first tab, Symbol Type, you can specify the attribute field and select a symbol type to style the data on the globe. In the Style by drop-down menu, the field Confirmed cases is selected in the sample below. In the Symbol type drop-down menu, the Counts and Amounts (Colors) type is selected to map numeric fields:

4. Under the second tab, Symbol Style, you can adjust the symbol style properties, such as color, pattern, classification, transparency, etc. The content in the Symbol Style tab vary based on the symbol type. We performed the following configurations in this sample:
-
- Select color from the Color Ramp drop-down menu
- Define the number of classes to show the range
- Switch to table view and manually input max value for each class

5. Under the third tab, Symbol Extrusion, you can extrude features to 3D with several extrusion options. Use Scale and Offset parameters to form a simple expression for 3D extrusion:

6. Back in the second tab, Symbol Style, enlarge the symbol size to make the data stand out on the globe:

7. Symbols of every single class can be customized to meet your needs. In this sample, we changed the size of class 5 with most cases confirmed, to locate hot spots for spread:

Now you can view and track the pandemic easily on a spatial level. This workflow can also be used for many other use cases such as population growth, biodiversity loss, environmental pollution, and more.
Share

Enjoy experimenting with 3D symbology, and stay tuned for the upcoming ArcGIS Earth April 2021 release with new capabilities. Download the latest versions of ArcGIS Earth mobile and desktop, and visit the ArcGIS Earth Resources page for more details. As always, we look forward to hearing your ideas for new functionality!


Article Discussion: