Gross Domestic Product, or GDP, is the value of goods and services within a country. Consumer spending, business spending (investment), government spending, and net exports all contribute to GDP. GDP as a measure has been largely criticized as an incomplete measure of productivity and wealth, as it does not take into account production in the informal economy, quality of life, degradation to the environment, or income distribution. However, GDP is a comparable measure, used in everything from banks setting interest rates to political campaign speeches.
This data is now available in one of the newest layers in ArcGIS Living Atlas of the World: Bureau of Economic Analysis – Gross Domestic Product (GDP), 2019. This layer contains 2019 GDP estimates from the Bureau of Economic Analysis (BEA) for the nation, regions, states, and counties. This ready-to-use layer can provide great context when mapping economic and business topics. Like most of our layers created from federal datasets, this layer is free to use and does not consume credits.
, 2019")
Long field descriptions provide valuable information
What are durable vs. nondurable goods are? What is the information industry? What are goods-producing vs. service-providing industries?
All these questions and more can be answered by viewing the industry definitions available through the layer’s long field descriptions. These long field descriptions are visible within the Map Viewer, so you don’t even have to leave your browser tab. When selecting an attribute to symbolize, simply click on the “i” information button next to each attribute:

Then those definitions and descriptions come through:
. Field description: GDP from North American Industry Classification System (NAICS) 81. Examples include repair and maintenance; personal care services including hair, nail, and skin care services; death care services; dry-cleaning and laundry services; other personal services including pet care (except veterinary) services; religious organizations; grantmaking and giving services; social advocacy organizations; civic and social organizations; business, professional, labor, political, and similar organizations; and hired support activities for private households.")
These long field descriptions are also visible when viewing the attribute table by clicking the “…” (three dots next to each field) -> “i”. In addition, they are available from the layer’s Item Details Page when clicking Data -> Fields.
These long field descriptions help those working with the layer in the moment. They don’t need to look up data dictionaries or codebooks for the definitions and information they need. Long field descriptions move documentation closer to GIS analysts by making it available directly where they need it.
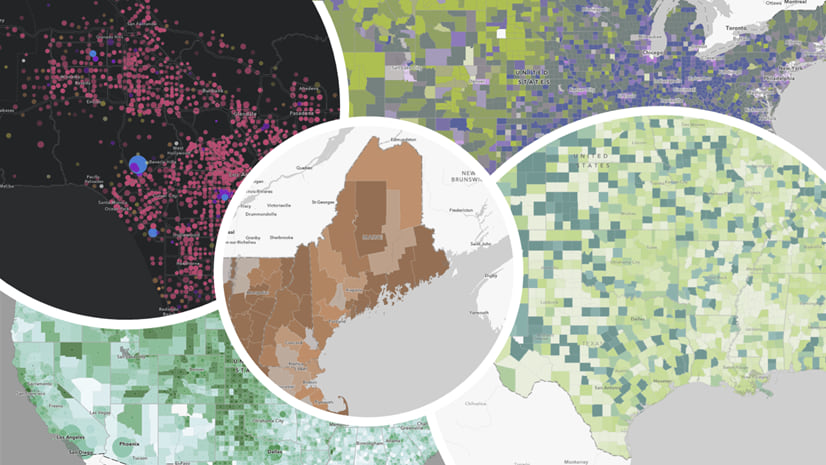
One layer powers many maps, and possibilities
Esri’s Living Atlas Policy Maps team created multiple maps from this layer. We put all our maps into a Portfolio configurable app to create an Atlas of Gross Domestic Product.
Atlas of Gross Domestic Product (GDP)
Many of these web maps are also available within Living Atlas and Esri Maps for Public Policy. This means you can put these maps straight into a story map, hub site, or configurable app, and use them as-is!
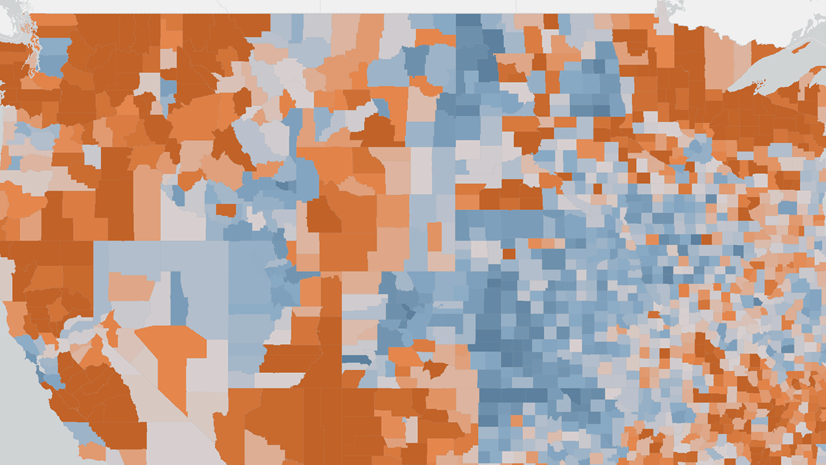
Create your own map using this layer
Interested in creating your own map? Add this layer to a web map, and you can create a customized map using ArcGIS Online’s numerous mapping styles, pop-up configuration options, labeling, blending, and more. Get a sense of what pre-pandemic economic conditions were, see which industries are most important to particular counties, and compare different counties to each other.
Use this layer in your geoprocessing and analysis
Add this layer into your maps for analysis with ArcGIS Online, ArcGIS Insights, or ArcGIS Pro for even more possibilities. Select by attributes to reveal which counties are of most interest to you. Combine it with additional data to answer all kinds of questions. Export to calculate new fields.
Questions about this layer?
For more information and details, see the layer’s Description, as well as the long field descriptions for each attribute. Head over to GeoNet’s ArcGIS Living Atlas space to ask other GIS analysts and professionals who use Living Atlas content, or share how you’re using this layer. These are just some of the newest items in ArcGIS Living Alas of the World: a collection of maps, apps, and data layers to support your work.


Article Discussion: