Solar energy is the conversion of sun rays into electricity. It can be done in our households, by installing photovoltaic (PV) panels on our rooftops. In doing so, electricity is being generated where it’s used, decreasing our dependence in an external grid. Solar is a renewable energy source and its use is a sustainable practice, but how can we decide if solar energy can be a reality for our community? Where we are matters a lot. The sun doesn’t shine equally in California and in Belgium. Also, solar panels require a significant initial investment and skilled workers to install them. Let’s explore how Living Atlas of the World can help us identify regions with high solar energy potential and communities that are not currently using solar.
Best places for solar
The PV electricity output image layer recently released in Living Atlas measures how much electricity (kWh) we can generate per capacity installed (kWp). For example, in a year we can generate around 2,022 kWh/KWp in Southern California. By contrast, we can only generate about 1,060 kWh/kWp in Belgium.

In addition, a more reliable solar energy value throughout the year is preferable. Solar energy in Southern California is more consistent throughout the year, varying from 4.3 kWh/kWp to 6.2 kWh/kWp per day. In Belgium the differences are larger, in the summer we can produce 4.1 kWh/kWp but only 1.0 kWh/kWp per day in the winter.
Looking towards the sun
We can improve the performance of the solar panels by tilting them at the right angle. In doing so, we can generate on average more electricity than with just placing the panels horizontally. The Horizontal and Tilted Irradiations image layer shows the energy that can be generated in a horizontal plane and the energy that can be generated at an optimum tilt angle . For example, in Turin, Italy we can increase the solar energy generated from 1,406 to 1,699 kWh/m2 by tilting the solar panels at the optimal angle of 38°. In contrast, in some other places like in Guayaquil, Ecuador the improvements are marginal (from 1,696 to 1,698 kWh/m2).

Who is currently using solar and who isn’t?
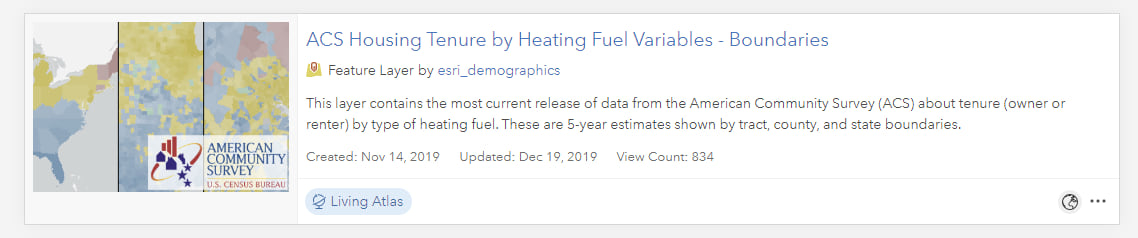
Last December, the Living Atlas team updated 78 Living Atlas layers containing American Community Survey (ACS) data within 48 hours of Census releasing the 2014-2018 values. One of the topics we covered was housing tenure by heating fuel type. The boundaries version of this layer will help us identify which tracts have a low percentage of households currently using solar.
Combining all this information to identify prime areas to promote solar
We now have all the data layers we need straight from ArcGIS Living Atlas. We worked with these layers in both Pro and ArcGIS Online to answer our overall question: Where are good places to promote household solar usage?
- First, we aggregated solar output to census tracts by overlaying the boundaries version of housing tenure by fuel type feature layer with the solar output image layer in Pro. Use the zonal statistics as a table tool to summarize the image layer to census tracts. Optionally, combine with the horizontal and tilted irradiations layer to get the range of values per census tract of horizontal and optimum solar energy.

- We could then see which tracts would benefit from incentive programs by applying criteria to help us narrow down the search space of places with untapped solar potential. This could be done with a definition query in ArcGIS Pro, or with filters in ArcGIS Online. We applied two criteria to identify tracts:
- Tracts that have >1,650 kWh/KWp, slightly less than 1 standard deviation above the national mean, so that we only keep the tracts with the highest potential.
- Tracts that have =<0.5% of households currently using solar, a cutoff slightly lower than the percentage of households using solar nation-wide.
- Next, we created this web map which shows prime areas to promote solar energy use in the US using that same criteria. After a few iterations, we settled on the Arcade expression below to classify the tracts for symbolizing.
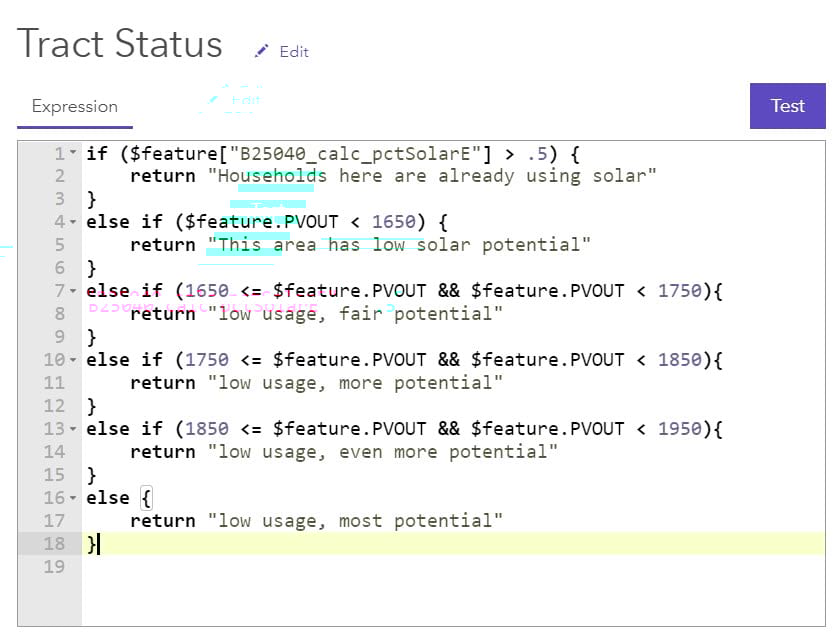
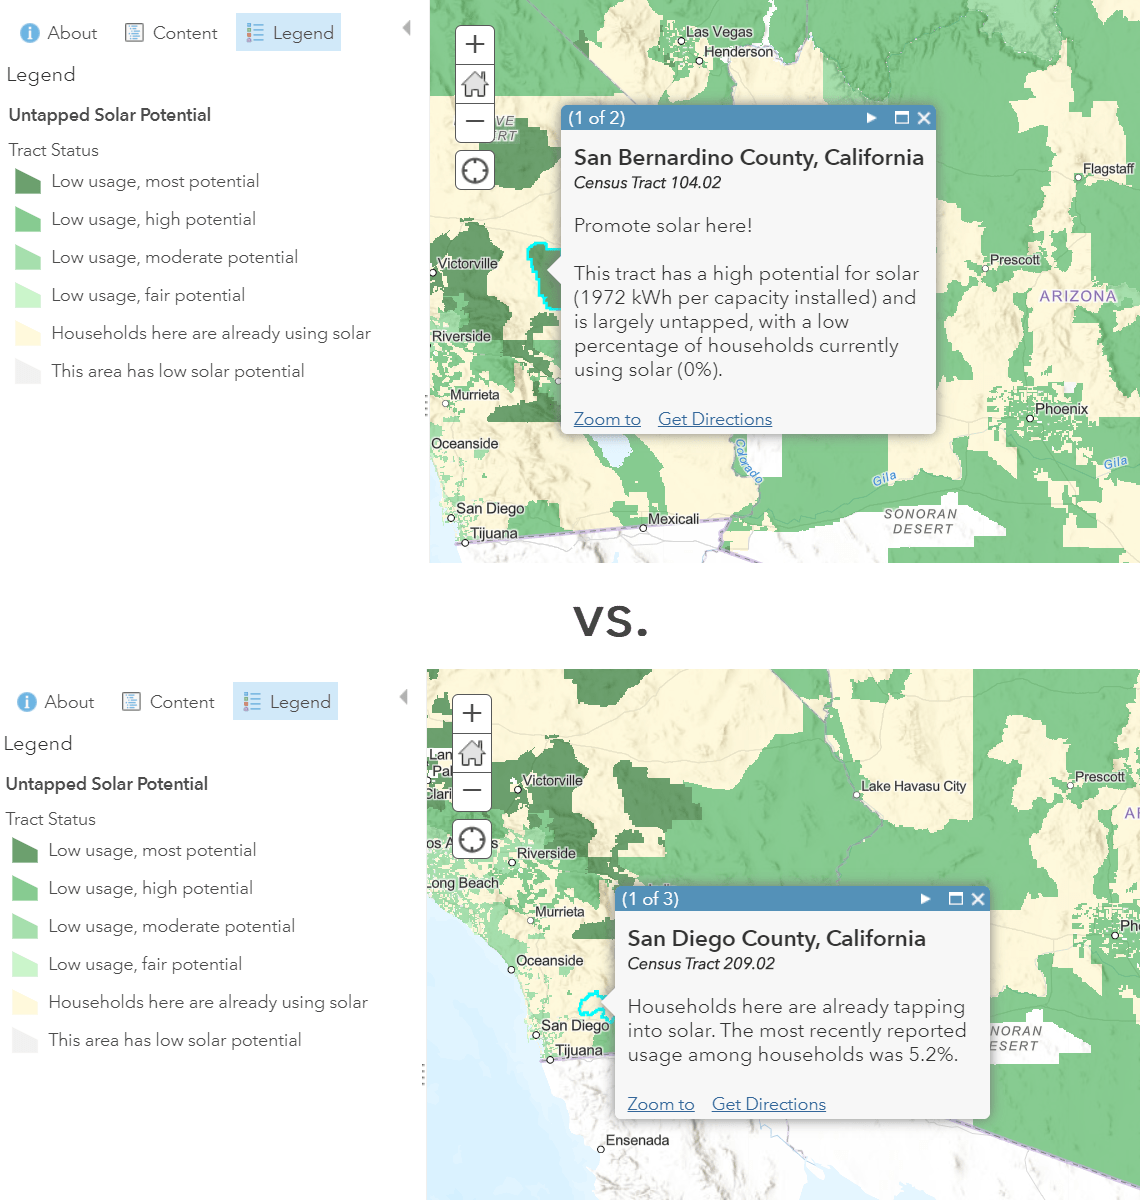
- We then created pop-ups that communicate the solar potential in that tract, as well as the most recent data on household solar usage. The conditional text such as “promote solar here” vs. “households here are already tapping into solar” comes from an Arcade expression using the when() function.
- Finally, we took advantage of the GeoList template in configurable apps that allow us to display that web map in a simple “Top 20” app to share and communicate our results.
Top 20 untapped areas for solar energy promotion in the US
Implications for policies and incentive programs
Out of the top 20 census tracts that have a high and consistent potential for solar, yet have low current usage rates, 11 of them were in the Victorville/Hesperia area of San Bernardino County, California. Another seven tracts were on the border of Los Angeles and Kern counties, spanning the cities of Lancaster, Mojave, and California City. The top tract is in the Yucca Valley area. These are places that might benefit from some incentive programs that offset or spread out the initial investment.
Areas that already have a relatively high level of solar usage among households, such as Honolulu and San Diego, could serve as blueprints. Evaluation of policies and incentive programs that took place in these areas might help inform the areas above in terms of what works and what doesn’t.
Answering questions using Living Atlas items
We combined three layers from ArcGIS Living Atlas into a simple workflow to identify regions with high solar energy potential and communities that are not currently using solar. We applied certain criteria that made sense for the question we were trying to answer. Working with well-documented and ready-to-use layers such as the PV Electricity Output, Horizontal and Tilted Irradiations, and Housing Tenure by Heating Fuel layers allowed us to get started with our analysis immediately, since lots of the data processing had already been done.
What types of areas will Living Atlas help you identify?
Living Atlas is the foremost collection of maps, apps, and data layers to support your GIS work. If you have any questions about using ArcGIS Living Atlas, please post them on GeoNet. If you want to go further and use ArcGIS Pro to estimate solar potential, see this Learn Lesson. You can find the web map and app we built, along with many other maps that clearly show opportunities to intervene, in Esri Maps for Public Policy.
Thanks to Emily Meriam for cartography assistance!
This blog was updated on 7/1/2020.


Sorry but it’s hard to follow you in this blog, you jump a lot of steps so we cant continue the blog with you.
Thank you for your feedback. I added some more details about the Arcade expressions used. Feel free to reach out to Gonzalo and me if you have any specific questions.