Knowing your community’s health and where your community stands among its peers is an important starting point in investigating ways to improve health. If you have ever wondered, “What’s the big picture of health in your county? How does your county compare to others? How has your county changed over time? Does health or opportunity vary by race in your county?” then the County Health Rankings & Roadmaps (CHR&R) program might just be what you are looking for.
The County Health Rankings, a collaboration between the Robert Wood Johnson Foundation and the University of Wisconsin Population Health Institute, measure the health of nearly all counties in the nation and rank them within states. The CHR&R program provides data, evidence, guidance, and examples to build awareness of the multiple factors that influence health and support leaders in growing community power to improve health equity.
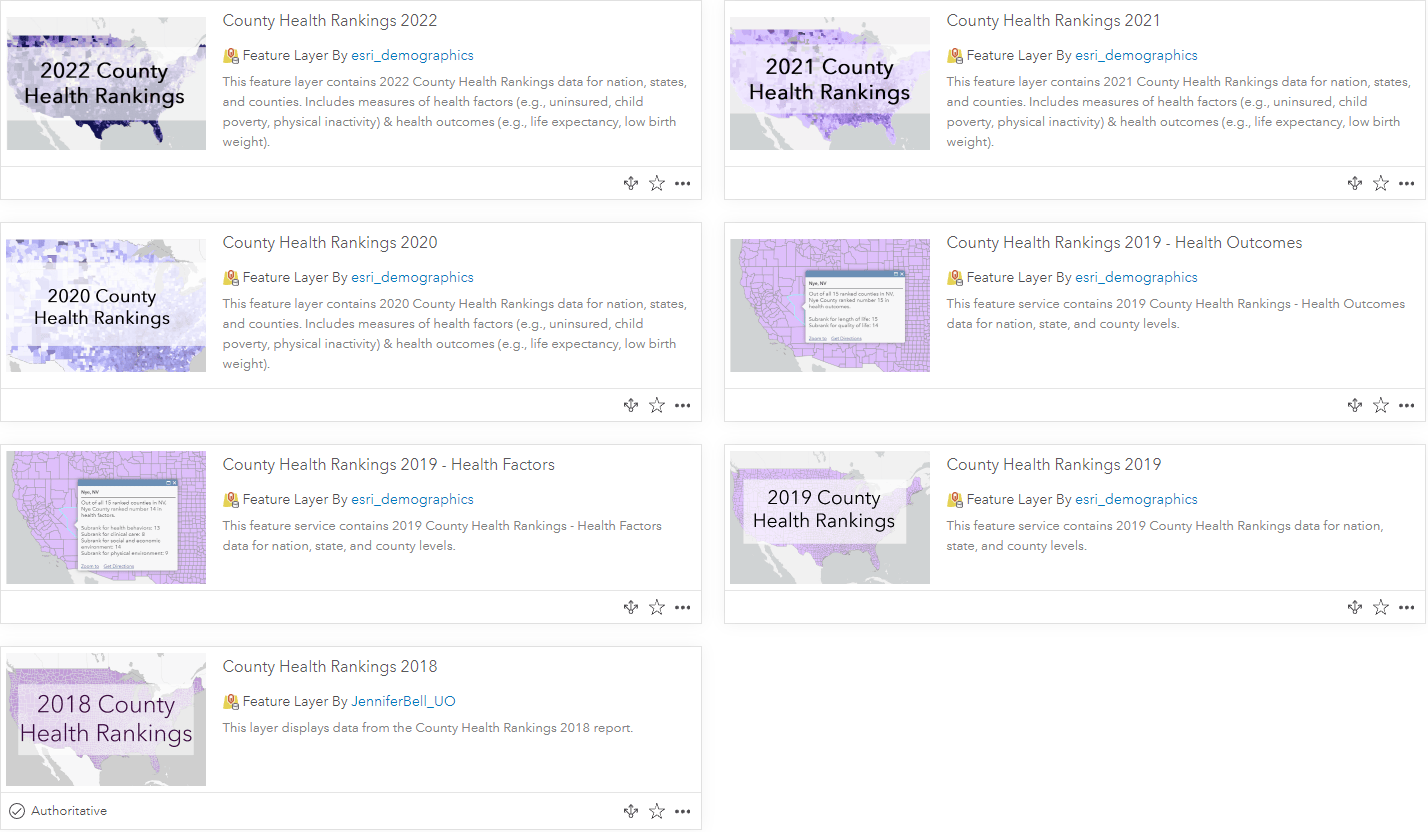
County Health Ranking Living Atlas Items
This feature layer available in ArcGIS Living Atlas contains 2022 County Health Rankings data for nation, state, and county levels. The Rankings are compiled using county-level measures from a variety of national and state data sources. These measures are standardized and combined using scientifically-informed weights.
- adult smoking
- physical inactivity
- flu vaccinations
- child poverty
- driving alone to work
Counties are ranked within their state on both health outcomes and health factors. Counties with a lower (better) health outcomes ranking than health factors ranking may see the health of their county decline in the future, as factors today can result in outcomes later. Conversely, counties with a lower (better) factors ranking than outcomes ranking may see the health of their county improve in the future.
New layers, measures, maps and apps each year
ArcGIS Living Atlas has County Health Ranking feature layers each year since 2018, with each year’s feature layers being improved upon. Since data sources and methods can change each year, and measures can be added or removed, compare data values between years with caution. See the CHR&R Measures documentation as well as the attributes’ long field descriptions on source, vintage, definitions, and other details. Some new variables in the 2022 Rankings data…
Some new variables in the 2022 Rankings data compared to previous versions:
- COVID-19 age-adjusted mortality
- School segregation
- School funding adequacy
- Gender pay gap
- Childcare cost burden
- Childcare centers
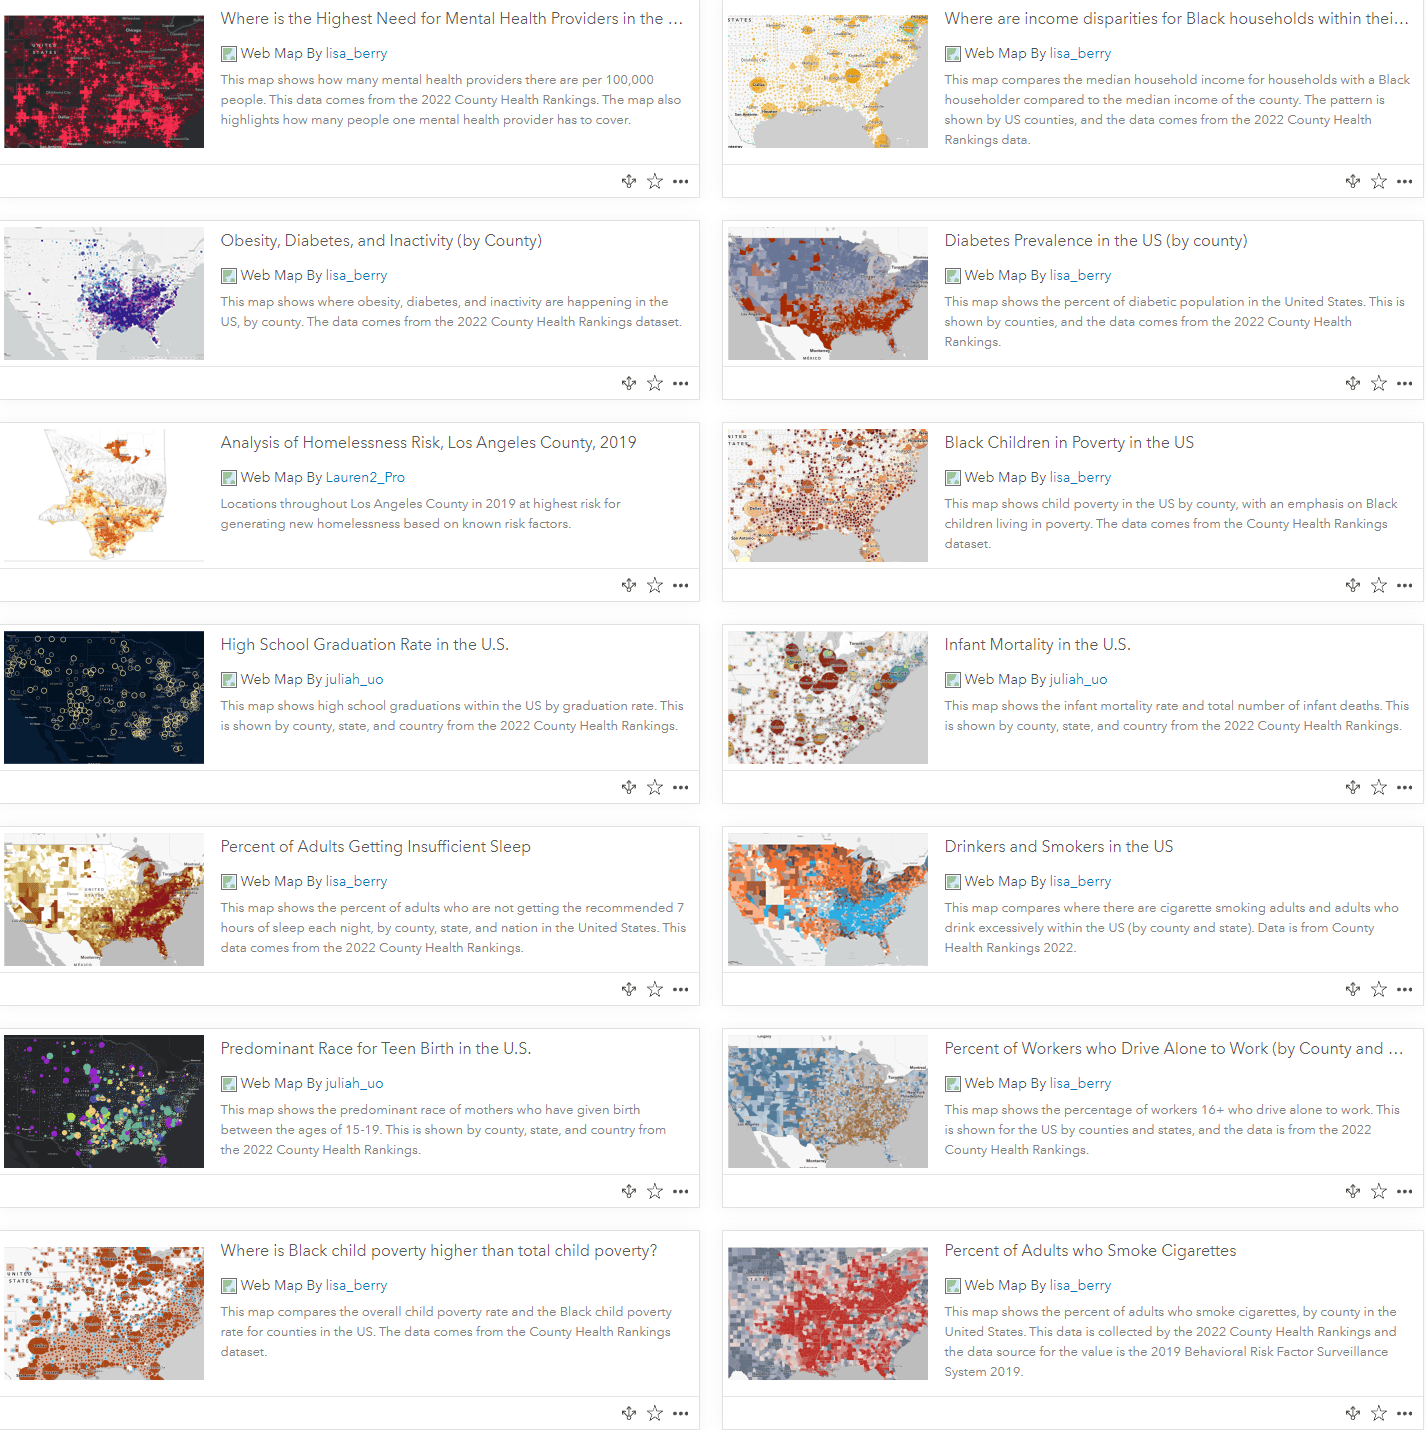
Since 2018, these feature layers have been viewed over 1.2 million times. These layers power over 30+ multi-scale web maps at the county, state, and national level. These maps contain topics across many health measures, such as life expectancy, obesity and diabetes, mental health access, and infant mortality. All these maps have an informative pop-up that communicates more details about what is being displayed in the map.
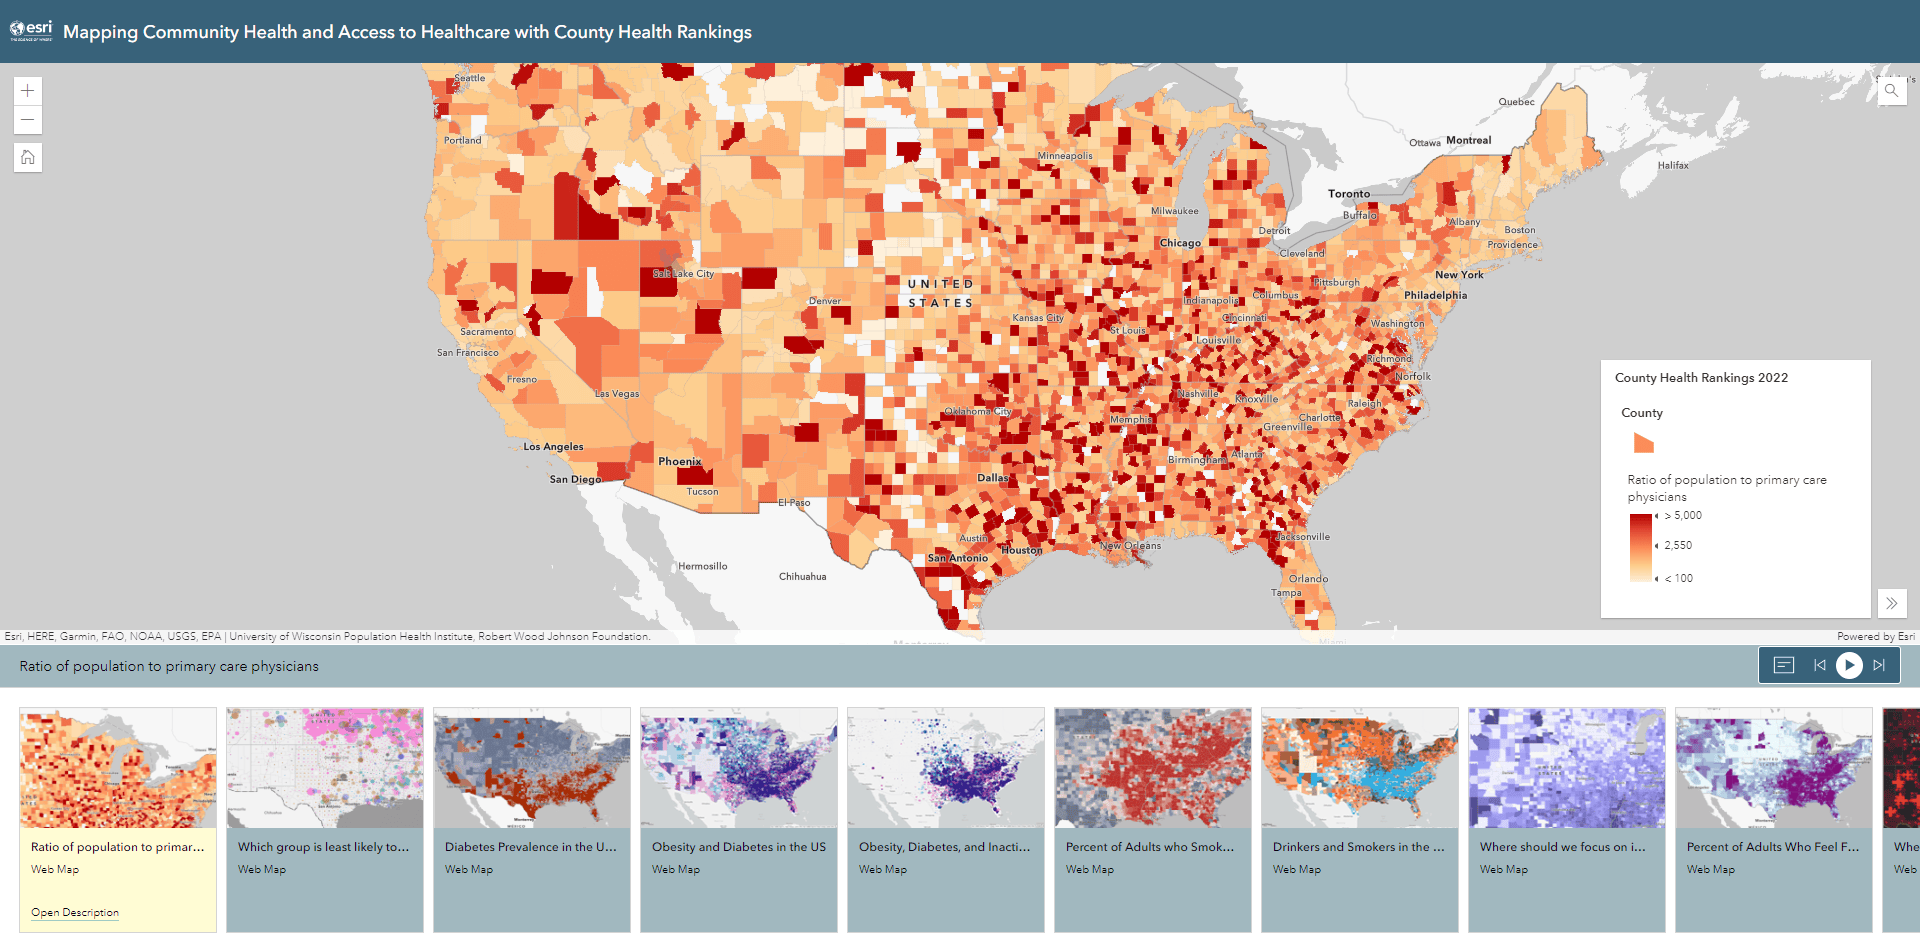
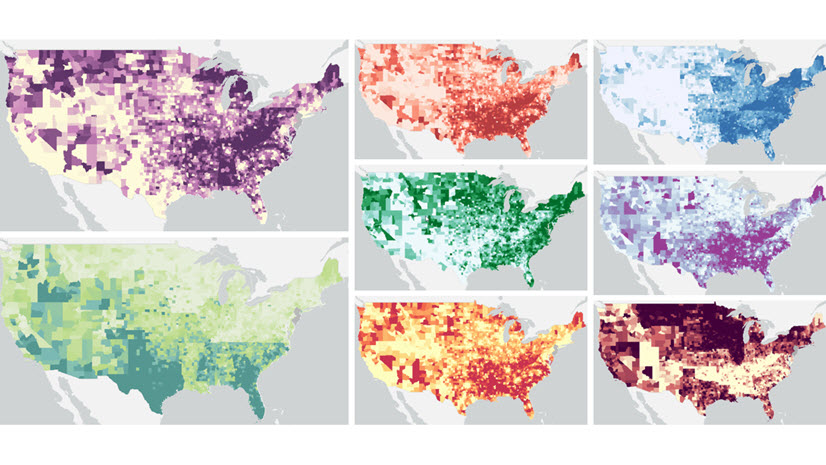
View patterns of community health by race and ethnicity, child and youth healthcare, and access to healthcare through a number of atlases through the portfolio app. These apps open at the national level focused on the conterminous U.S., but can be centered on a specific location throughout the app.
- Mapping Community Health and Access to Healthcare with County Health Rankings
- Mapping Community Health by Race and Ethnicity with County Health Rankings
- Mapping Child and Youth Healthcare with County Health Rankings
Use County Health Ranking data in your work
Whether you use the newest feature layer for your own analysis and maps in ArcGIS Online, ArcGIS Pro, ArcGIS Dashboards or Instant Apps, or use an existing web map to focus in on your own areas’ health needs, all of these items can be found in ArcGIS Living Atlas of the World. Create your own maps to understand the community health of your county and see how your county ranks among other its peers.
Learn more about the County Health Rankings Program
The Rankings are unique in their ability to measure the health of nearly every county in all 50 states, and are complemented by guidance, tools, and resources designed to accelerate community learning and action. CHR&R is known for effectively translating and communicating complex data and evidence-informed policy into accessible models, reports, and products that deepen the understanding of what makes communities healthy and inspires and supports improvement efforts. County Health Rankings & Roadmaps’ work is rooted in a sincere belief in health equity, the idea that everyone deserves a fair and just opportunity to be as healthy as possible.
To learn more about the specific measures, view the 2022 measures.
To learn more about County Heath Rankings Model, view the model.
Thanks!
Thanks to the work by Robert Wood Johnson Foundation and the University of Wisconsin Population Health Institute for this amazing dataset. We look forward to continually working with the County Health Rankings data team in the future, and further mapping health related measures with this dataset.


Article Discussion: