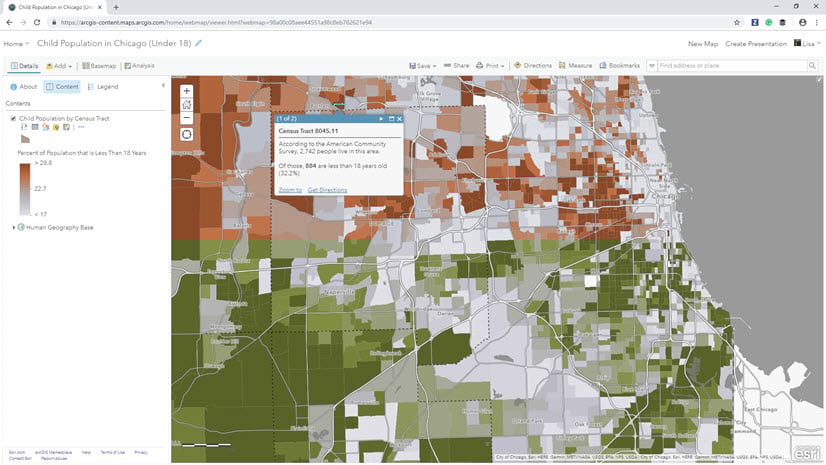
The American Community Survey (ACS) helps local officials, community leaders, and businesses understand the changes taking place in their communities. It is the premier source for detailed population and housing information about our nation. The newest 2014-2018 ACS estimates have been released by the U.S. Census Bureau, and you can find many of the popular variables directly within the ArcGIS platform. Being able to access these brand-new data values directly within the ArcGIS Living Atlas of the World makes it easy to start understanding the changes taking place in your community or areas of interest through maps and further analysis.
ACS Data Re-imagined
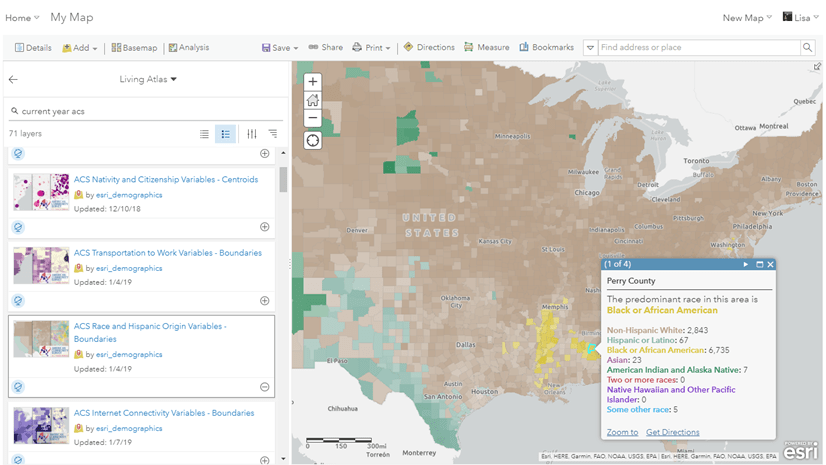
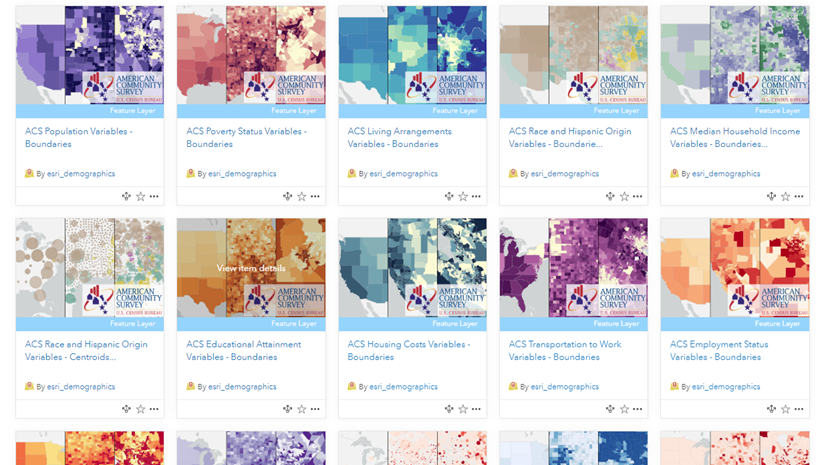
Within the Living Atlas, there are 78 layers that cover 89 different ACS tables. These cover topics such as housing, population, employment, income, race, age, insurance, education, veteran status, internet connectivity, and more. This information helps users like yourself answer questions such as:
What language do people speak at home other than English?
or
What age makes the highest median household income?
These curated data layers can be quickly combined with your own data to make a maps about your community, region, state, or the entire United States. The ACS tables are already joined to the appropriate state, county, and tract TIGER boundaries, and each attribute has an easy-to-understand alias name and long description. Each geography level has a pre-made popup and symbology to help you map important topics faster than ever. All you have to do is use it as-is or customize the map to your topic interest.
Why use these layers?
Does this sound familiar? “Where is that demographic data I pulled last year to support this project? Where did I store it, oh and where is the new data that just came out?” Because this data is automatically updated behind the scenes each year, you always have the newest data in your map. You no longer need to go and download the newest data each year, it will always be at your fingertips. And if your workflows require an archive of older data, simply export the data locally from ArcGIS Pro.
These ACS layers utilize the ArcGIS platform to your advantage. In 2019, hosted feature services were updated to support field descriptions, which help provide a longer, more in-depth description to complicated attributes. With the most recent update of the ACS layers, now all attributes contain a long description which can be accessed in ArcGIS Online when exploring the data.
Some other benefits to these layers:
- They are free to use and require no login or credits
- The boundaries have coastlines cut out for improved mapping
- They are accessible throughout the ArcGIS platform
Get started today
Find the layers:
Learn where to find these layers and start using them within your mapping and analysis workflows. Check out this story map to learn how. You can also check out this ArcGIS Online group or find them by searching in ArcGIS Living Atlas of the World.
Map your community:
Learn how to make a map about your community in 4 easy steps in this blog. You’ll have your own custom web map in minutes!
Update your existing ACS maps
Whenever new ACS figures are released by the Census, we encourage you to check the breakpoints being used in your existing web maps that use the Living Atlas ACS layers. After the December release of the new data from the Census, make sure your map’s existing symbology still make sense with the updated data.
Questions?
If you have questions about the layers, visit our FAQ, or post on GeoNet’s Living Atlas community. You can also learn more about the layers in this blog.


Article Discussion: