With massive amounts of data at your fingertips, nowadays it can be hard to bring focus to the maps you make on a daily basis. Resources like ArcGIS Living Atlas and ArcGIS Hub bring a wealth of national and local datasets directly into our maps with just a few clicks. But many times, maps can easily become an overwhelming mess of information that can be hard to digest and learn from. Adding data to a map is easy, but good maps only come from choosing what to take out or de-emphasize, and most importantly what to emphasize. This blog will bring to light a few techniques on how to bring focus to your maps by adding emphasis to your area of interest on the map. There’s also a related blog about using your data values to emphasize patterns by my teammate Steven Aviles.
A technique commonly discussed on my team at Esri is the idea of making your maps “policy maps” instead of just throwing data at your intended audience. A policy map is a map that emphasizes the most important patterns and areas of need. As described by Steven Goldsmith, Professor of Urban Policy at Government and the Director of Data Smart City Solutions at Harvard’s Kennedy School of Government, a policy map is a map that clearly shows where there are opportunities to intervene. With these core ideas in mind, you can make small changes to your maps that shift the focus to the most important parts of the narrative.
This blog will walk through some basic and intermediate techniques for highlighting features within your thematic maps in ArcGIS Online’s Map Viewer by focusing the map on your area of interest. Sometimes, you’ll have the perfect data structure to filter and use tools like effects, but this blog will also cover methods for when your data is not-so-perfect (or if you don’t have data at all). By using tools like Living Atlas, Blend modes, Effects, and Filtering, you can bring a whole new dimension of emphasis on the areas that are most important within your map.
The starting point
To start, one technique you’ll see used a few times in this blog is the use of Group Layers. By grouping the layers, we can add effects and blend modes without distorting our basemap or other layers in the map. This is used in some techniques, but not all of them.
This is the starting point for most of the techniques below, and there’s two things to keep in mind:
- The order of the layers matters for some of these techniques (particularly ones that use blending modes). Each example will specify the order you want your thematic data and reference layer (something that defines your area of interest).
- You can apply blend modes and effects to the entire group layer. We will use this technique many times. This is different from setting them on the actual data layers, which we will also do. Don’t worry, it isn’t as confusing as it sounds.
If you don’t have data for some of these techniques, check out ArcGIS Living Atlas for demographic, boundary, and other layers that may help you accomplish similar techniques.
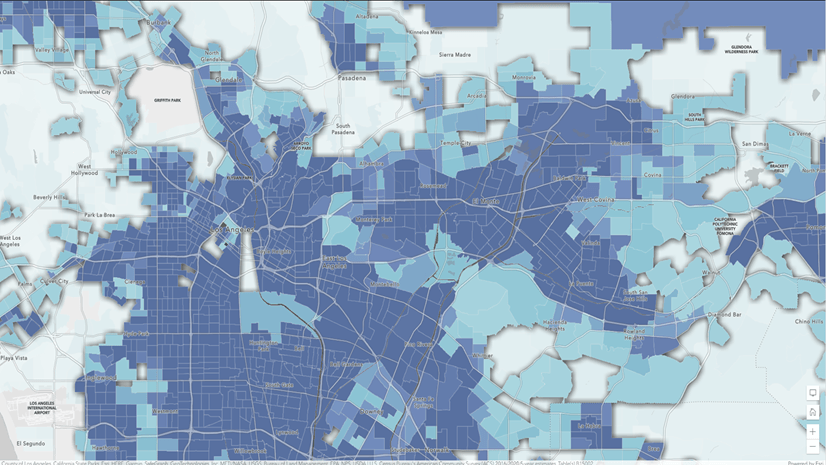
Feel free to follow along or try out the techniques on this web map as you read this blog, or just use this as a reference for when you want to accomplish a similar approach. By default the map shows us the percent of poverty within the Houston, TX area using the Living Atlas Census ACS layer: ACS Poverty Status Variables – Boundaries.
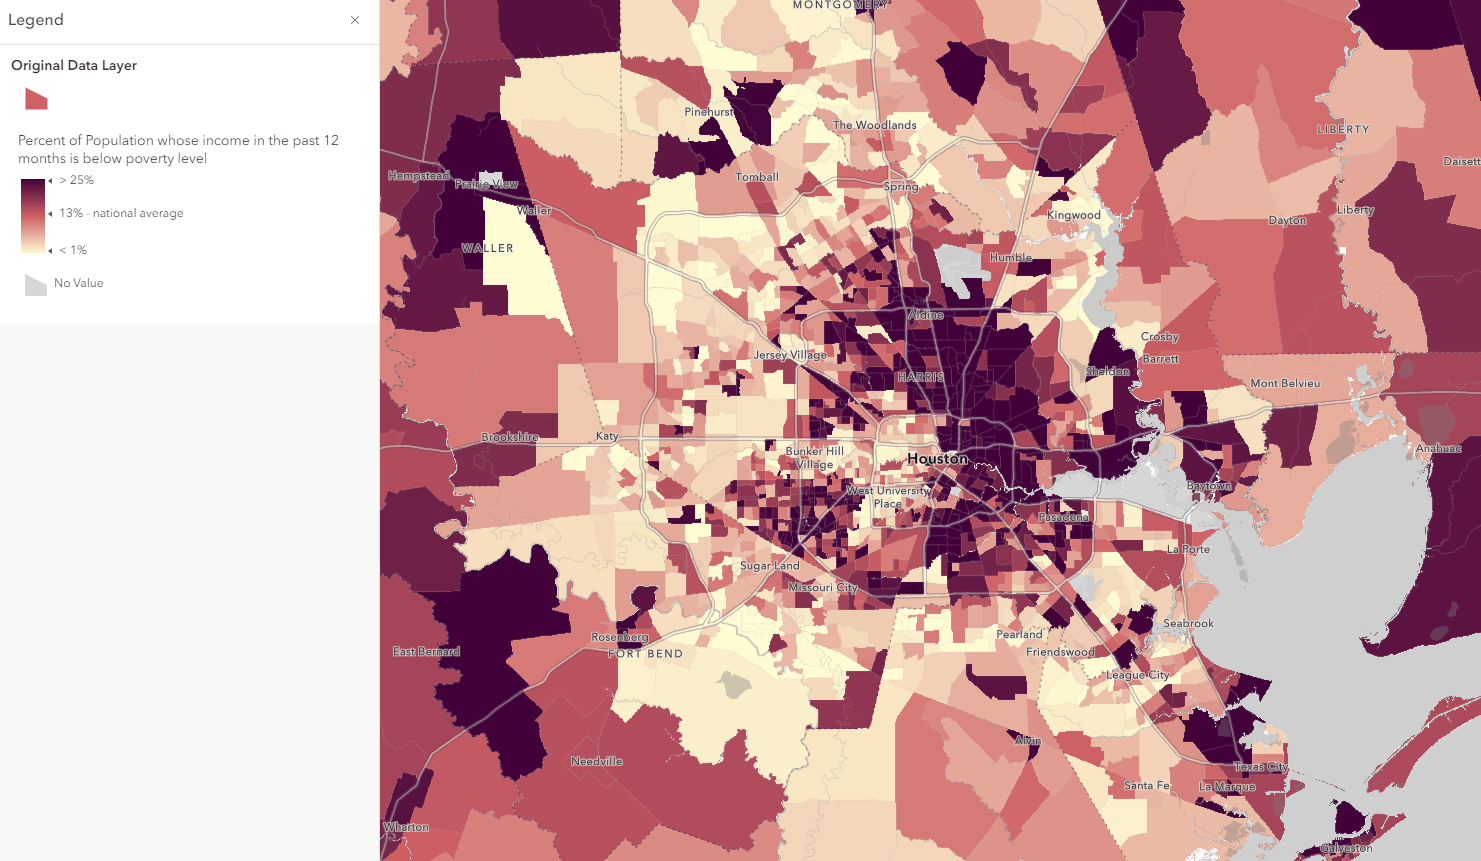
Now keep in mind that this map on its own is informative and interesting, but in many cases, we want to highlight the pattern within our county. The examples below talk through how to emphasize Harris County, TX, but similar techniques can be used with your own data for different geography levels.
Emphasize a thematic pattern by your area of interest
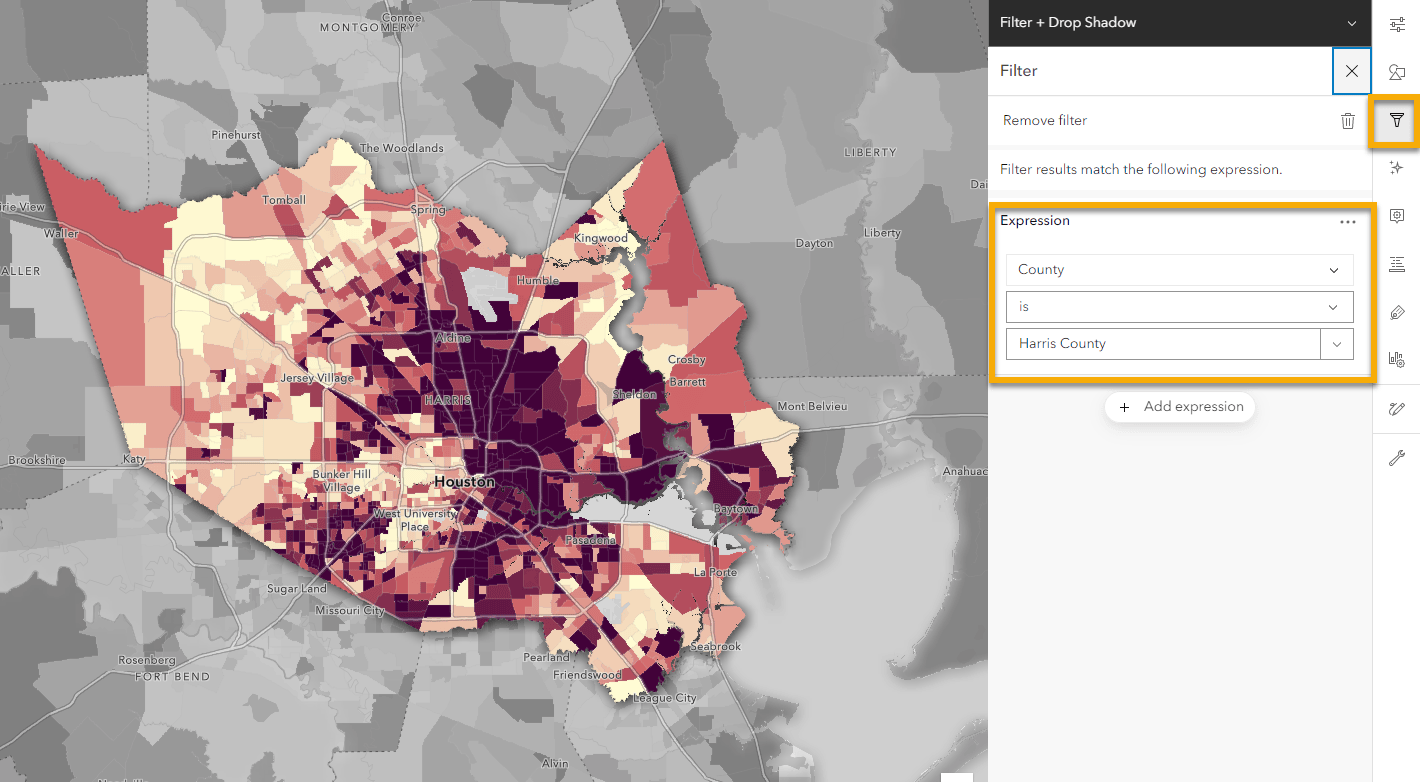
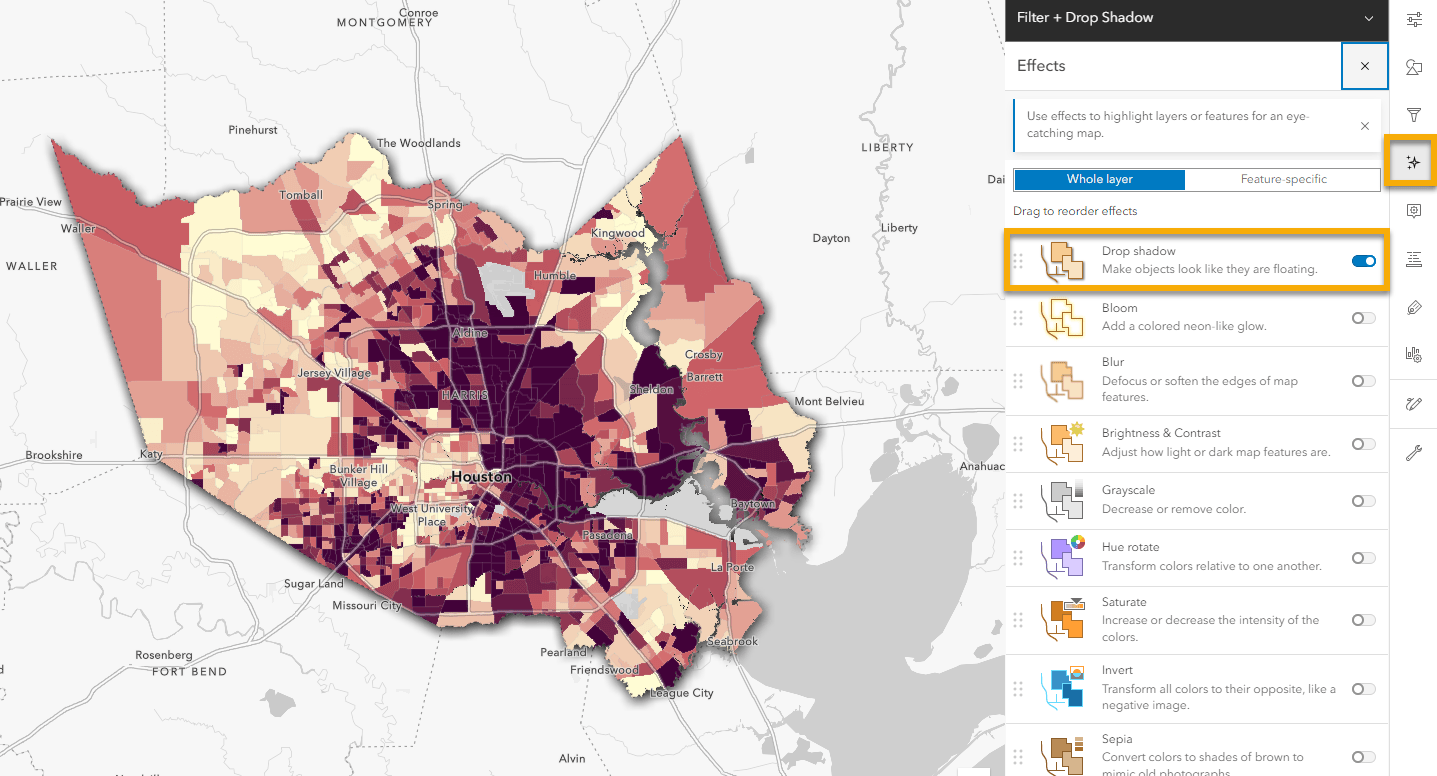
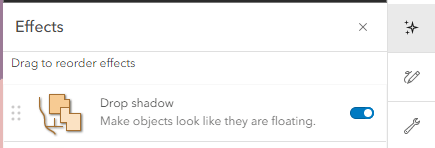
The most fundamental way we can focus a map to our area is to filter out the data that isn’t as important. Now keep in mind that filtering is nothing new, but what can enhance this basic technique is the use of the Drop Shadow Effect to make the features on the map really stand out. Drop Shadow acts like a halo to help differentiate your feature against the backdrop or surrounding features.
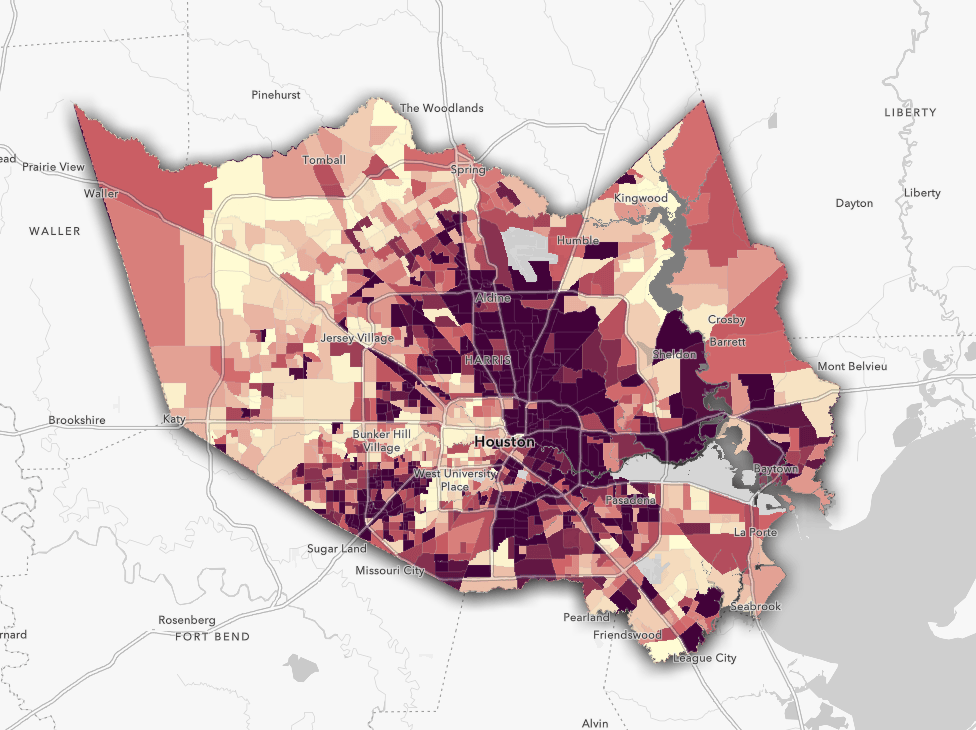
- If you have a field to use from your data – Apply the Filter for the features you want to emphasize + add a Drop shadow from the Effects Pane. In this case, there’s no need to group any layers.
- If you don’t have a field to filter with – Bring in a Living Atlas layer from the Boundaries category, and filter that layer to the area you want to show. In this case, it is filtered to Harris County like the example above + Blend Mode

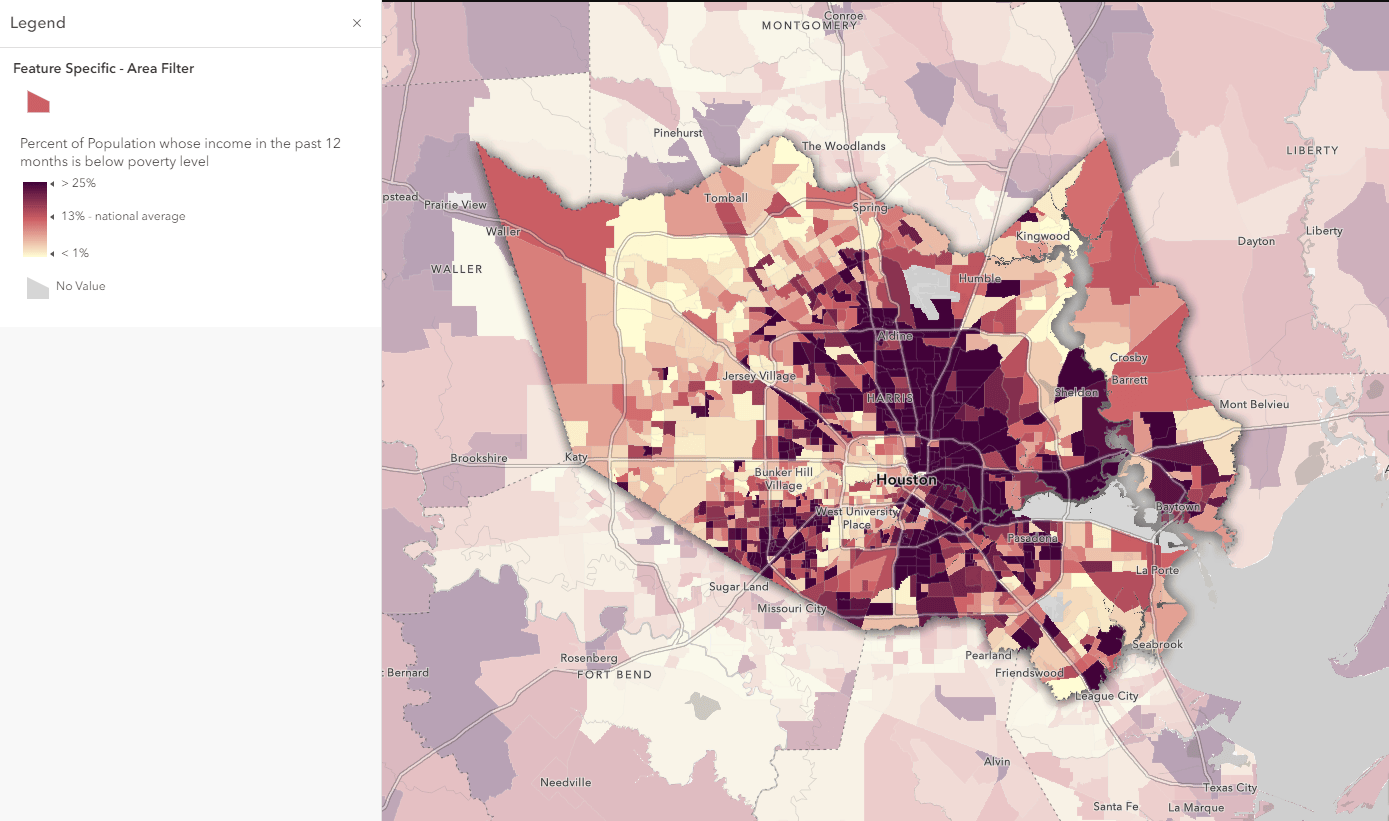
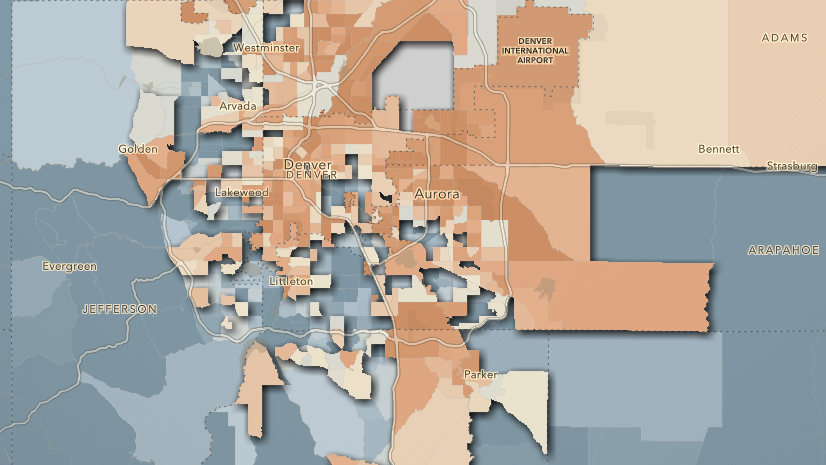
Emphasize your area of interest while still showing nearby context
Like the example above, we may want to emphasize our area while keeping some context from adjacent areas. Understanding our neighboring areas can help us compare and understand how our local policies and patterns are similar or different.
- If you have a field to use from your data – Go to Effects and choose Feature-specific. Set an expression for the features you want to emphasize and choose an option that works for your narrative. In this case, there’s no need to group any layers.
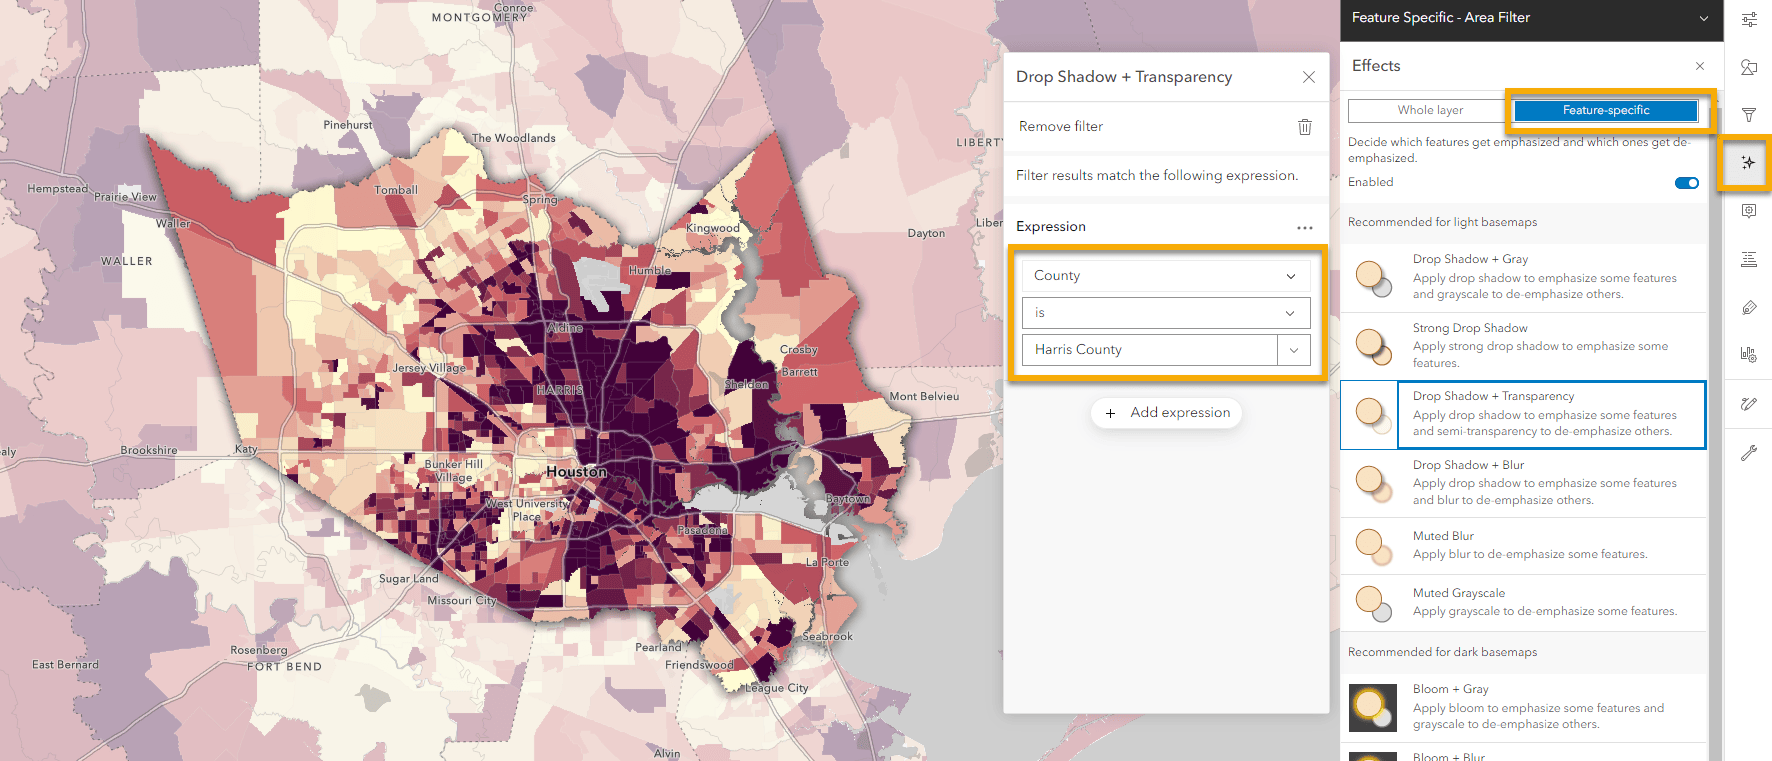
- If you don’t have a field to filter with– Bring in a layer from Living Atlas and create a group layer with your data layer. With the mask layer on top of the data layer, filter out your area of interest and add transparency to the layer.

Emphasize where people live within your area of interest
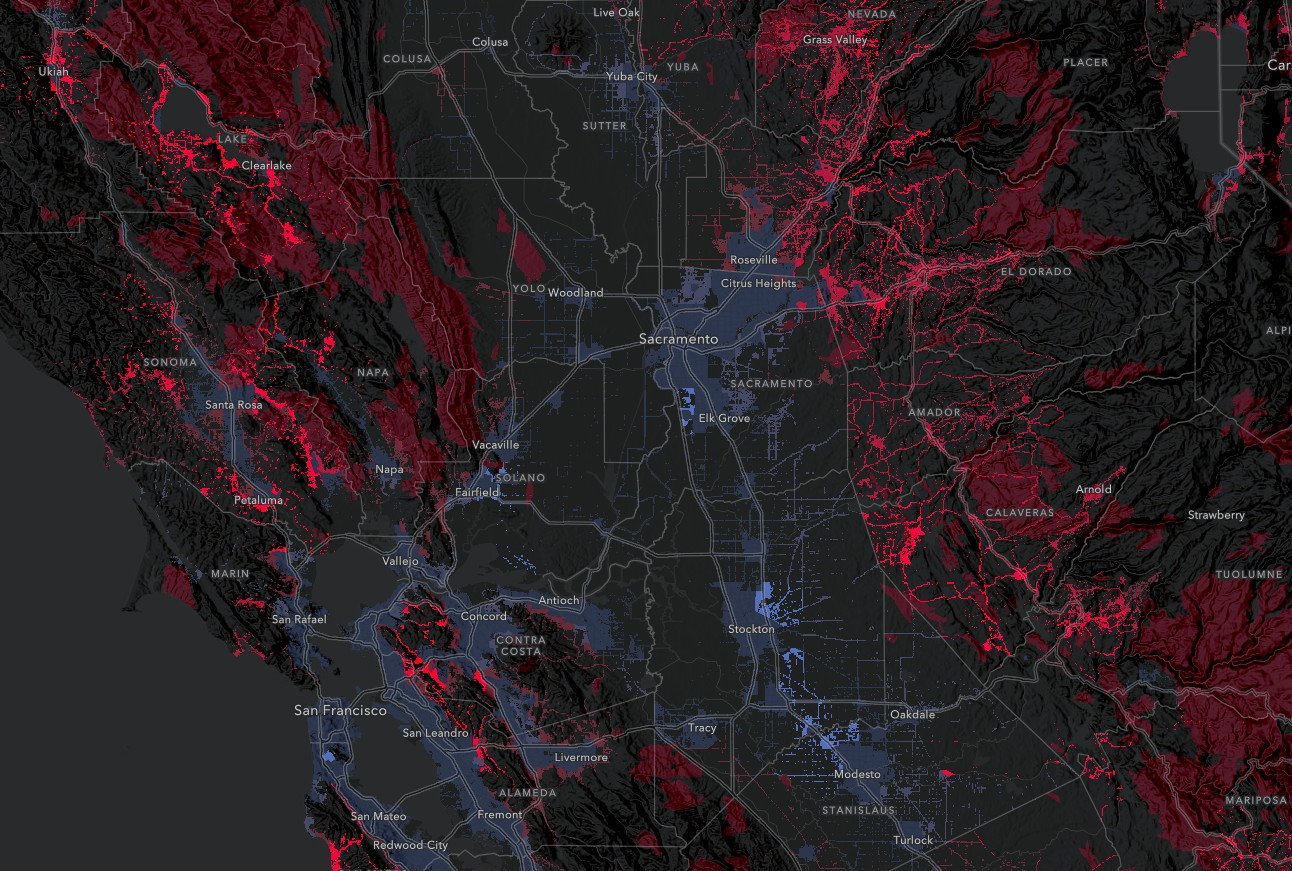
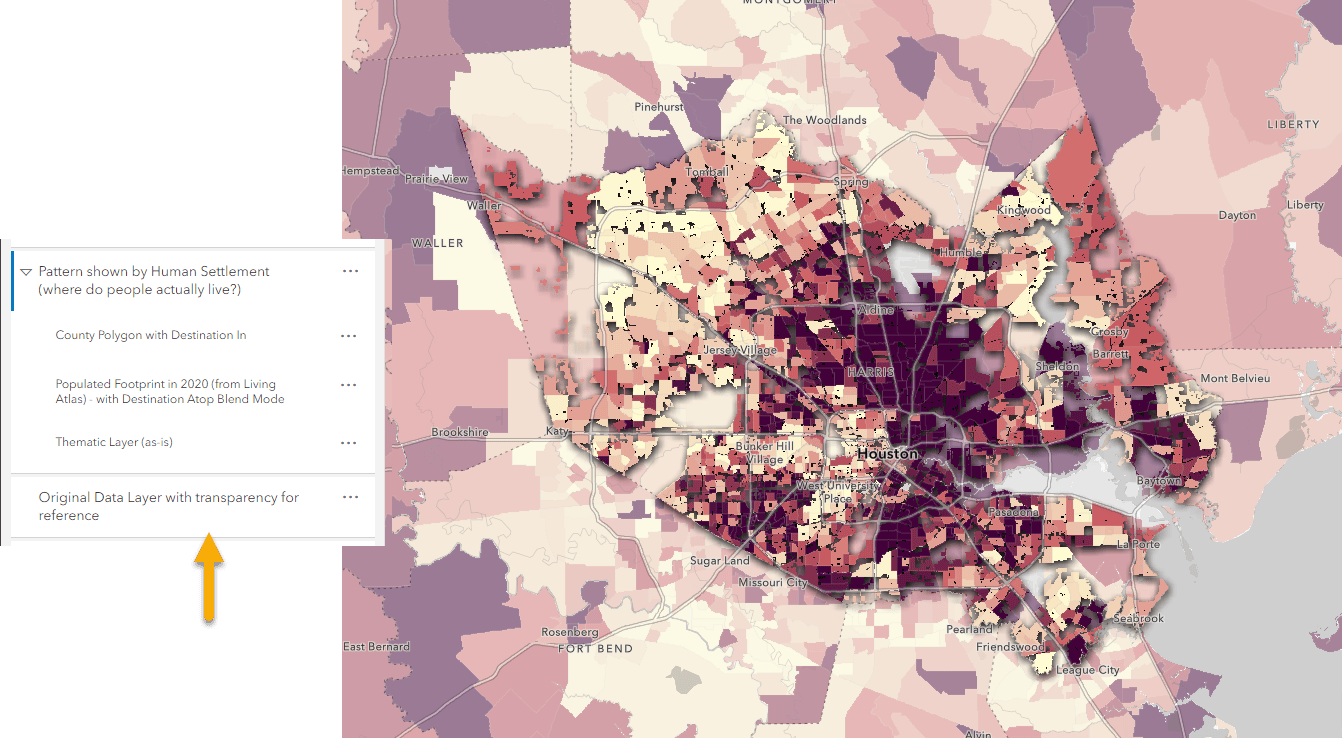
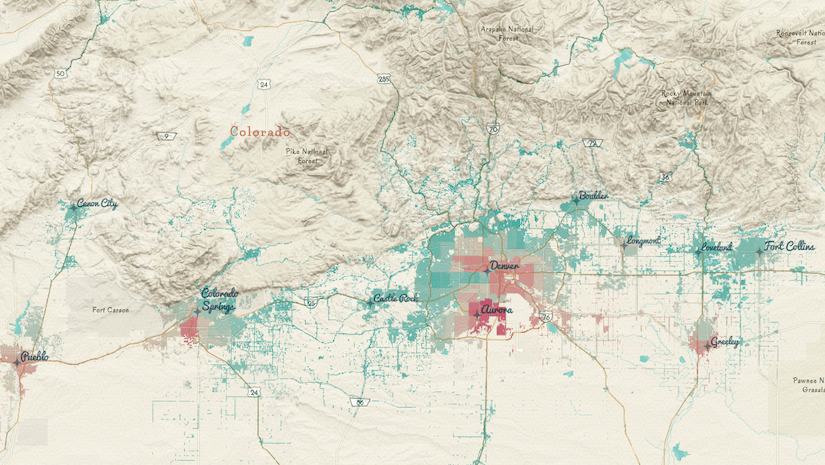
While highlighting a county of interest can be helpful, administrative boundaries such as counties can be oddly shaped and arbitrary in nature.. One way to create an interesting emphasis in your maps is to not only focus on your area of interest, but to also show where the thematic pattern exists based on where people actually live. This blog by Jim Herries shows how this can be done with the use of a human settlement layer + the Destination Atop blend mode. In this version, we will use the same technique but also filter the thematic data by our area of interest.
Living Atlas contains a set of population rasters helping us visualize these phenomena. The Populated Footprint layer helps us overlay where people live, and helps us easily see where there’s no population (airports, industrial areas, forested areas, etc).
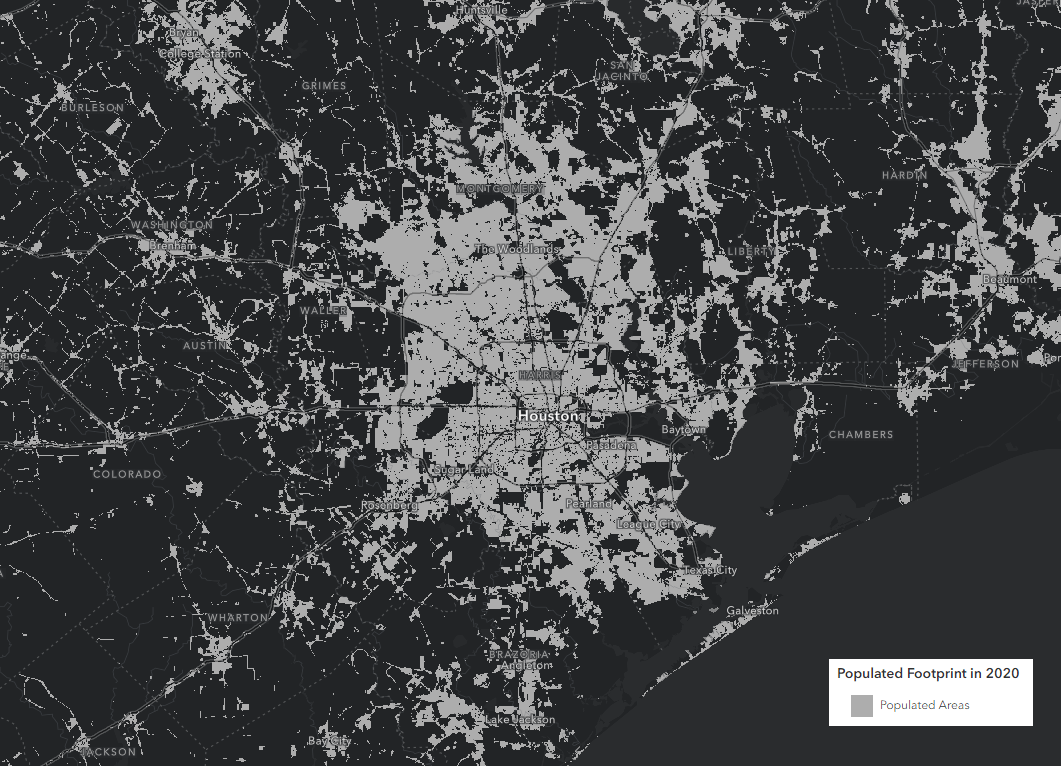
Start by grouping three layers in this order: area of interest boundary (in our case, Harris County filtered from a Living Atlas like in the first example), WorldPop Populated Footprint, your data layer.
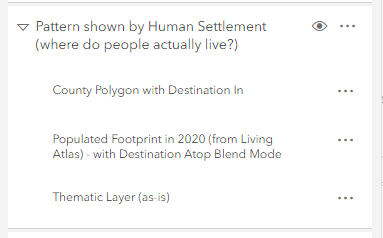
For your top layer (the area of interest you want to show the pattern by), apply the Destination In Blend mode which is found in the Properties pane:

For the Populated Footprint layer, use the Destination Atop Blend mode:

Finally, on the entire group layer, go into Effects like we did earlier, and try using Drop shadow to make the pattern pop from the map:
This will give us an interesting visualization method. The thematic data shows through, but only for the county we are interested in, and only by where people live.
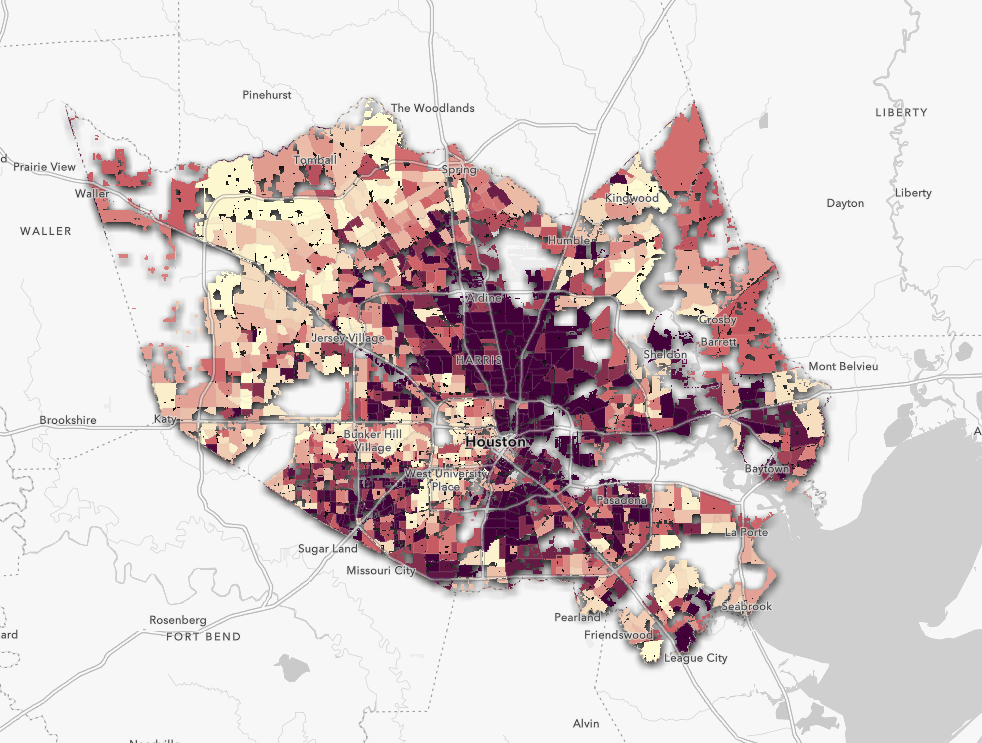
For extra context and detail, you can duplicate your data layer underneath your group layer in the table of contents, and add some transparency to it. This will reinforce the initial pattern, but still make the pattern highlighted by human settlement.
Emphasize contextual point features within your area of interest
Consider a case where you have point features you are overlaying with your area of interest, but you only want to show the ones that overlap with your area of interest. Traditionally, you’d need to run some sort of analysis to narrow down those features to your area. But imagine if you could do this in just a few clicks instead.
Create a group layer with your area of interest polygon (don’t forget, you can find these in Living Atlas), the point layer you want to use (in our example, we are using a HUD layer about multifamily properties from Living Atlas), and your thematic data layer at the bottom.
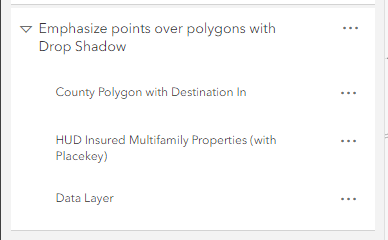
On your polygon area of interest layer (in our case county polygons), set the Destination In Blend mode like in the previous example. On the points layer, set the Drop shadow Effect, and on the entire group layer, set the Drop shadow effect.
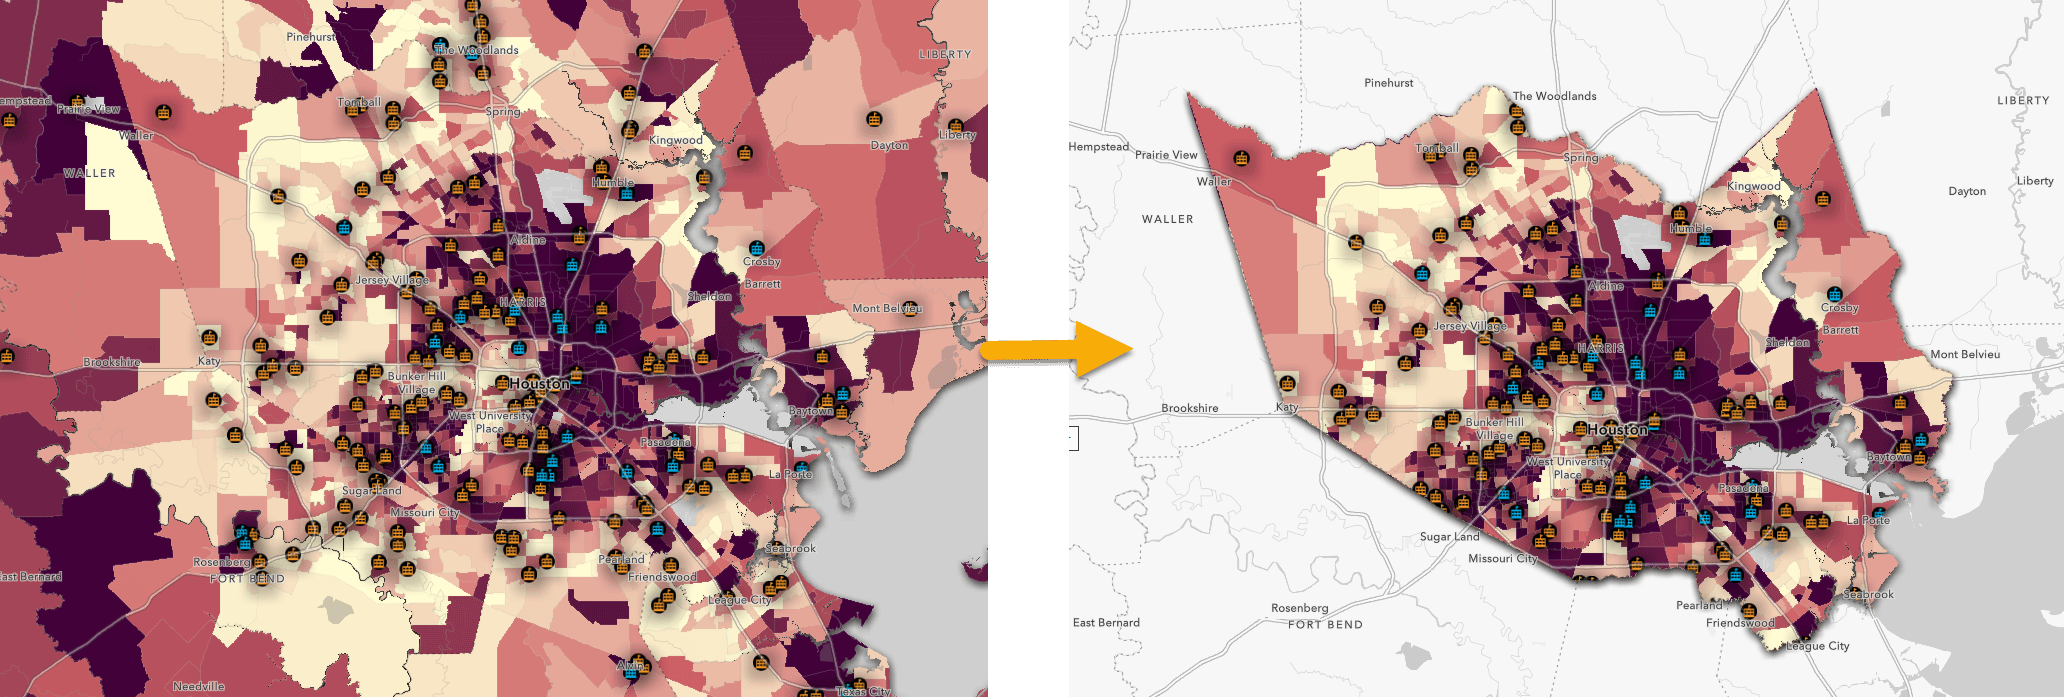
Now, your points are filtered to your area, and stand out from your thematic data with the drop shadow.
Final thoughts
Nothing replaces a good Clip or Erase, but the techniques in this blog hopefully show you how easy it is to emphasize patterns using Blend modes and Effects. Bring focus to your maps by highlighting your area of interest, all without any analysis. You don’t even need to have your own data to do these techniques. As you saw, you can bring in Living Atlas layers to emphasize the areas you want highlighted. Best of all, you don’t need to own a layer to accomplish these techniques. You can use these on-the-fly methods on layers owned by others, like the Living Atlas example we saw above.
Related resources:
Related blog: Add emphasis by using your data’s values
ArcGIS Living Atlas of the World
Blog: Apply a local focus using blending and effects
Blog: Highlighting Areas using Effects and Blending
Blog: Apply a filter to make Living Atlas layers your own
Blog: Make an ACS map of your community in just a few steps
Blog: Top 10 tips for policy mapping
Blog: Make several nuanced policy maps from one layer


Article Discussion: