With the September 2021 release of ArcGIS Online, we added a new capability to Map Viewer called Effects. Effects bring Photoshop-like capabilities to your layers in your web maps. You can use effects on all layers types that are supported in Map Viewer. They can be used on your operational layers and your basemap layers. Effects in combination with Blend modes work really well and you will see an example of this below. If you are asking “What are blend modes?” I recommend you checkout this blog on blend modes. Effects are currently only supported with 4.x JSAPI applications and there are currently limitations with displaying effects in printing and the legend.
In this blog we are going to go over:
- How to get started with Effects
- Effect examples
How to Enable Effects
To enable Effects you simply need to have a layer selected in your map by clicking on it in the table of contents or switch to a layer using the layer switcher. Once the layer is selected the Settings (light) toolbar on the right hand side will be active and click the Effects button to open the panel.

The Effects panel will then open and you will see the Layer Effects available for you to use.

Click on the Effect will bring up the selected Effect properties. Use the slider or type in new values. As you adjust the properties for the Effect the layer will update in real-time.

Effects can also be re-ordered. The order of the effect can change the end result seen on the layer. To see how important the order of execution is for Effects, on your favorite map layer enable Drop shadow and Invert. Use the drag handles beside them to re-order; the Effect at the top of the list is performed first, and changing that order changes the output.
Also be sure to experiment with pairing Blend Modes with Effects; they work really well together.
Examples of Effects Available
Below is a collection of sample maps using the layer effects to help inspire your next map creation.
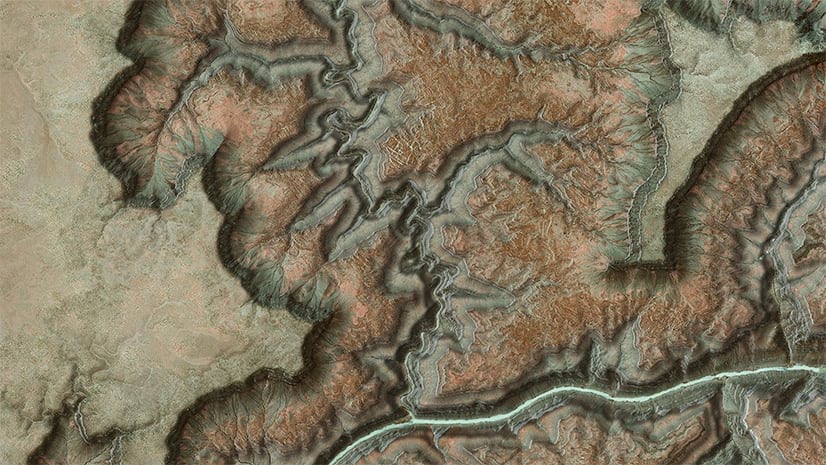
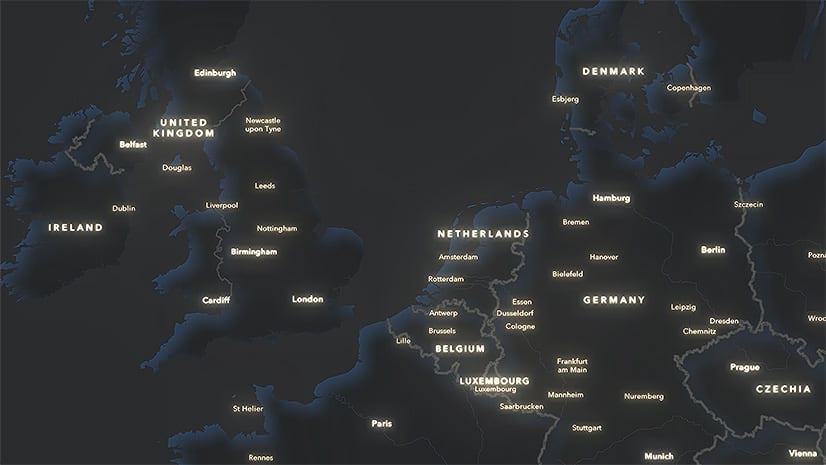
Invert + Hue Rotate

Invert allows us to instantly transform any map, including Esri basemaps, into a “film negative” of themselves. Adding a 180° Hue Rotate brings them back to their original palette, but as a light/dark version. Notice how the labels and details are also affected yet remain perfectly legible in these transformations.
Bloom + Drop shadow + Brightness & Contrast

Bloom has a lovely additive effect where the more things overlap (like the teal rings) the stronger the glow. In this Above-and-Below Size Renderer map of average population in the Phoenix AZ metro area, the largest circles show where average age is the highest and the largest rings show where it is the lowest. Of course you can use more than one effect on a map. Here, I thought the white labels were getting lost in the Bloom, so adding a Drop shadow to just the basemap labels allows them to float above and stand out. Lastly, adding a bit of Contrast to the background of the basemap sharpened the overall impression of the bloom.
Bloom + Brightness & Contrast

Without the Bloom it can be a bit hard to see the density and distribution of these four crop types (wheat, corn, cotton, soybeans). But turning on Bloom does something magical: Because each color dot casts its own neon glow, and the glows all interact (!!), the dots coalesce to create new colors not in the original 4-color maps. In this way they create a visual weighted average. Loving the complexity of agriculture in Texas and the lower Mississippi valley.
Drop shadow + Sepia

Selectively applying Effects on-the-fly to just one component of Esri’s basemaps is a very speedy way to create something very bespoke without having to re-author and save an entirely new basemap. Here Sepia adds a warm tone to the oceans and leaves the rest of the map unaffected. It matches the color scheme used in the Proportional Symbols much better now, and took less than 3 seconds to do. Finally, adding a simple Drop shadow to the circles helps them to really pop off the map. The result is a much more polished final product in less than 20 second.
Blur + Blend Mode + Drop shadow

Sometimes the precision of our GIS linework oversells the certainty with which we know things. Take for example, this map showing the species range of the elusive Canada Lynx in the Northern Rockies; the animals live in low density, move, and are hard to track. Adding a subtle Blur to the edge of the polygon helps to denote an appropriate level of uncertainty.
Sepia + Bloom + Drop shadow

Effects can help create an entirely different mood or feel to a map. Here the Dark Human Geography base is transformed by (1) the labels are given a Sepia tint, and (2) a Bloom effect, while (3) a large Drop shadow is applied to the landmasses. Because the effects work at all zoom levels, this animation show how transformative and bespoke the map feels from where it was just 3 clicks earlier.
To learn more about Effects check out our doc page here.


This is a great addition. However, from initially checking it out the effects (or at least the Drop Shadow) has not carried over from the Web Map Viewer to an associated app/story map that embeds the webmap.
Hi there. Make sure that your app is using JS API version 4.21. It should carry over. Feel free to post on Esri Community with a webmap ID that you believe isn’t loading correctly.
Is effects available for Portal or just ArcGIS Online at the moment?