Policy maps use the power of data and spatial analytics to highlight a need for change in our communities. They help decision makers make data-driven decisions by providing clear narratives about where to intervene or change a policy strategy.
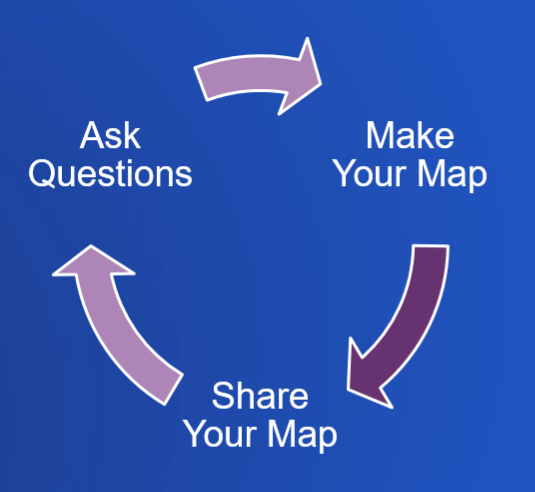
You can easily make your own maps for public policy by taking a few extra minutes in your normal mapping workflows. We have a few tips that can help make your policy maps more effective:
1. Ask questions
Start by asking yourself some probing questions. This can help you know which maps you should be making. Try posing questions to the people you work with to learn different points of view about a topic. Some questions could be:
· What’s the problem?
· What does the data show?
· What are others doing?
· Where should we send resources?
· Is there anywhere out of compliance?
· How are we doing now (after a policy change)?
2. Find the data you need
Sometimes the easiest place to start is to put data on the map and explore it to see if there are any patterns. You can bring in a spreadsheet or any other geographical data into the map. But sometimes you might need additional data from a government agency or from a different department within your organization. Take some time to explore what’s available. There are many resources to help you search for data within the ArcGIS Platform. For example, the ArcGIS Living Atlas of the World and Open Data contain authoritative, well-documented data services to kickstart your maps.
3. Make the opportunities to intervene clear
A policy map is a map where the opportunity to intervene is made clear
When mapping for public policy, keep in mind that you need to relay a message to your map reader quickly and easily. Consider this when designing your maps. Small things can make a big difference to help your reader understand a message clearly. For example, you can use a simple legend to emphasize which areas may need a policy adjustment. You can also use color to emphasize the areas of need on the map (outlining the county that needs resources or highlighting the streets near a school that have had accidents).

4. Visualize, overlay, and analyze
Sometimes just visualizing the data on the map is a great place to start, but keep going. Overlay related datasets and see if there are any obvious patterns. Circle back to tip #1 and keep asking questions that help define what’s “normal” versus “abnormal”. Maybe you’ll think of another topic that could be overlaid. Then keep going. Use the powerful analysis tools within ArcGIS Pro and ArcGIS Online to see other patterns emerge using spatial analyses. Some popular tools are demographic enrichment, drive-times, and buffers.

5. Understand the power of color
As humans, we are programmed to react to certain colors. Depending on the culture, green tends to mean good, nature, or something pleasing. Red is usually linked to danger or negative fight/flight instincts. Basic color theory can help your map be more impactful by simply taking a moment to reflect on what your map’s colors are telling the reader. Are you using a light happy green color to highlight child poverty in your city? This may not be the right message you want to send. There is no one answer when using color, but be conscious of it, and try different color ramps when making your map.
For example, the map below shows where veterans are not within 45 minutes of a Veterans Affairs (VA) hospital. The map uses red to highlight areas that are undeserved by being outside of the 45 minute threshold. Areas in blue are more accessible.

6. Use numbers that matter
Just as 98.6 degrees Fahrenheit provides a basis for comparison for determining fever in humans, every map needs a basis for comparison to make the information relatable.
Adjust the defaults
Rather than just letting the software give you numbers to use, consider what the data values mean. For example, if I am mapping immunization rates, I would consider anchoring my map around a meaningful number related to immunization policy. For example, the California Dept. of Public Health suggests that the safest threshold for an entire school district is a minimum of 95% of children be immunized to help prevent the spread of diseases (with 100% being most ideal). Therefore in the map below, that number was set using the Above and Below style in ArcGIS Online to highlight areas that weren’t meeting that threshold.

Use appropriate denominators
Make sure that any denominator you are using only includes those who actually have a chance to be in the numerator. This way, your percentages or rates will be more comparable and meaningful across different geographic locations, because they will not be swayed by external dynamics such as age structure, sex ratio, or employment status. For instance, if I’m making a map of differences in fertility rates across the U.S., I want to limit my denominator to women age 15 to 50 (childbearing age). This way I’m comparing the fertility rates in a way that’s not affected by the prevalence of retirement communities in the area, for example.
Similarly, when mapping the mean hours worked in a typical week, only those who are age 16 to 64 and had a job were used to compute the mean – not retirees, full-time students, stay-at-home parents, those looking for work, those who are unable to work, and children who are too young to work. Our measure is not thrown off by the uneven presence of these populations who work zero hours.
7. Create compelling charts and statistics
Sometimes you don’t need a map for every topic– a chart or graph may be enough. Other times, charts, graphs, and statistics can help add context to a map. For an audience that is not familiar with reading and interpreting maps, accompanying your map with charts and graphs might actually get your point across better. For example, this map of needed judgeship positions by county in California presents a chart and a map side-by-side, and the chart is what really shows the need for judges in Riverside and San Bernardino Counties.

Another way to present compelling statistics is to make a quick image of one enlarged number, percentage, or rate that you wish to highlight. You can think of these as mini infographics, sometimes called “key performance indicators” or KPIs. Just as charts and graphs enhance your maps, so can KPI icons or graphics. For example, if I’m preparing a report or story map about life expectancy, I might present a map of life expectancy along with a graphic such as this:
 with a small sentence explaining what this is. (world-wide female life expectancy).")
8. Consider your audience
Policy maps are building blocks along with other information such as charts and graphs, text, and pictures. Likely, you’ll be integrating all this information into a final information product, which could be a web application, a presentation, a dashboard, or a traditional policy brief.
Consider how long your audience has to read and interpret your map. This can help you determine how to best share the map. People with less time might just need a basic map viewer, while others want to spend more time exploring and reading an in-depth story map or report about the topic.

9. Create a call to action
Give your audience their next steps. What now?
For the general public, give them points of contact or a website to visit. For a lobbyist, maybe give more facts, resources, or maps that they can use in their work. For a mayor or policy maker, give a suggested path forward for policy change, or emphasize policy implications.

10. Ask more questions
Policy maps aren’t necessarily stagnant. Keep iterating on your maps or adding new information, especially if a policy has changed, or if there’s reason to believe a policy has been effective in an area. Keep people engaged with each iteration of your map. This tabbed series story map provides some examples and further information on the initial questions posed in Tip 1.
Consider this: A good map answers questions, but a great map causes people to ask more questions.
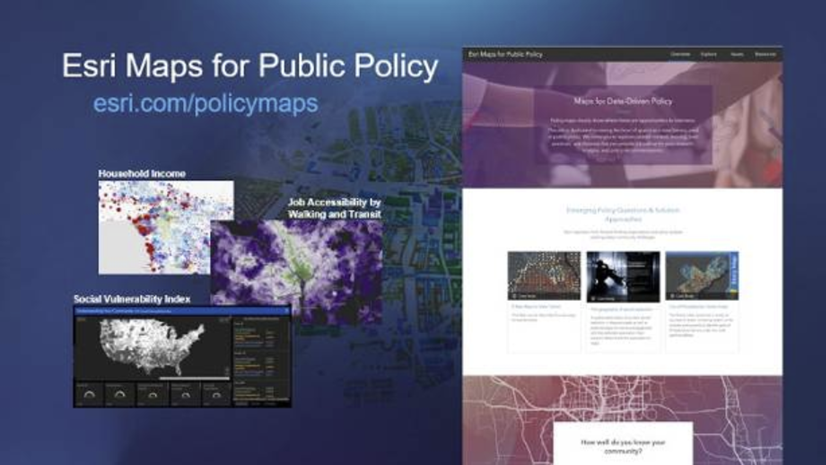
To learn more, visit the Esri Maps for Public Policy website and explore maps about your community. Share those maps with stakeholders, or start making your own policy maps from them. The learn more about the site, visit this blog.


Article Discussion: