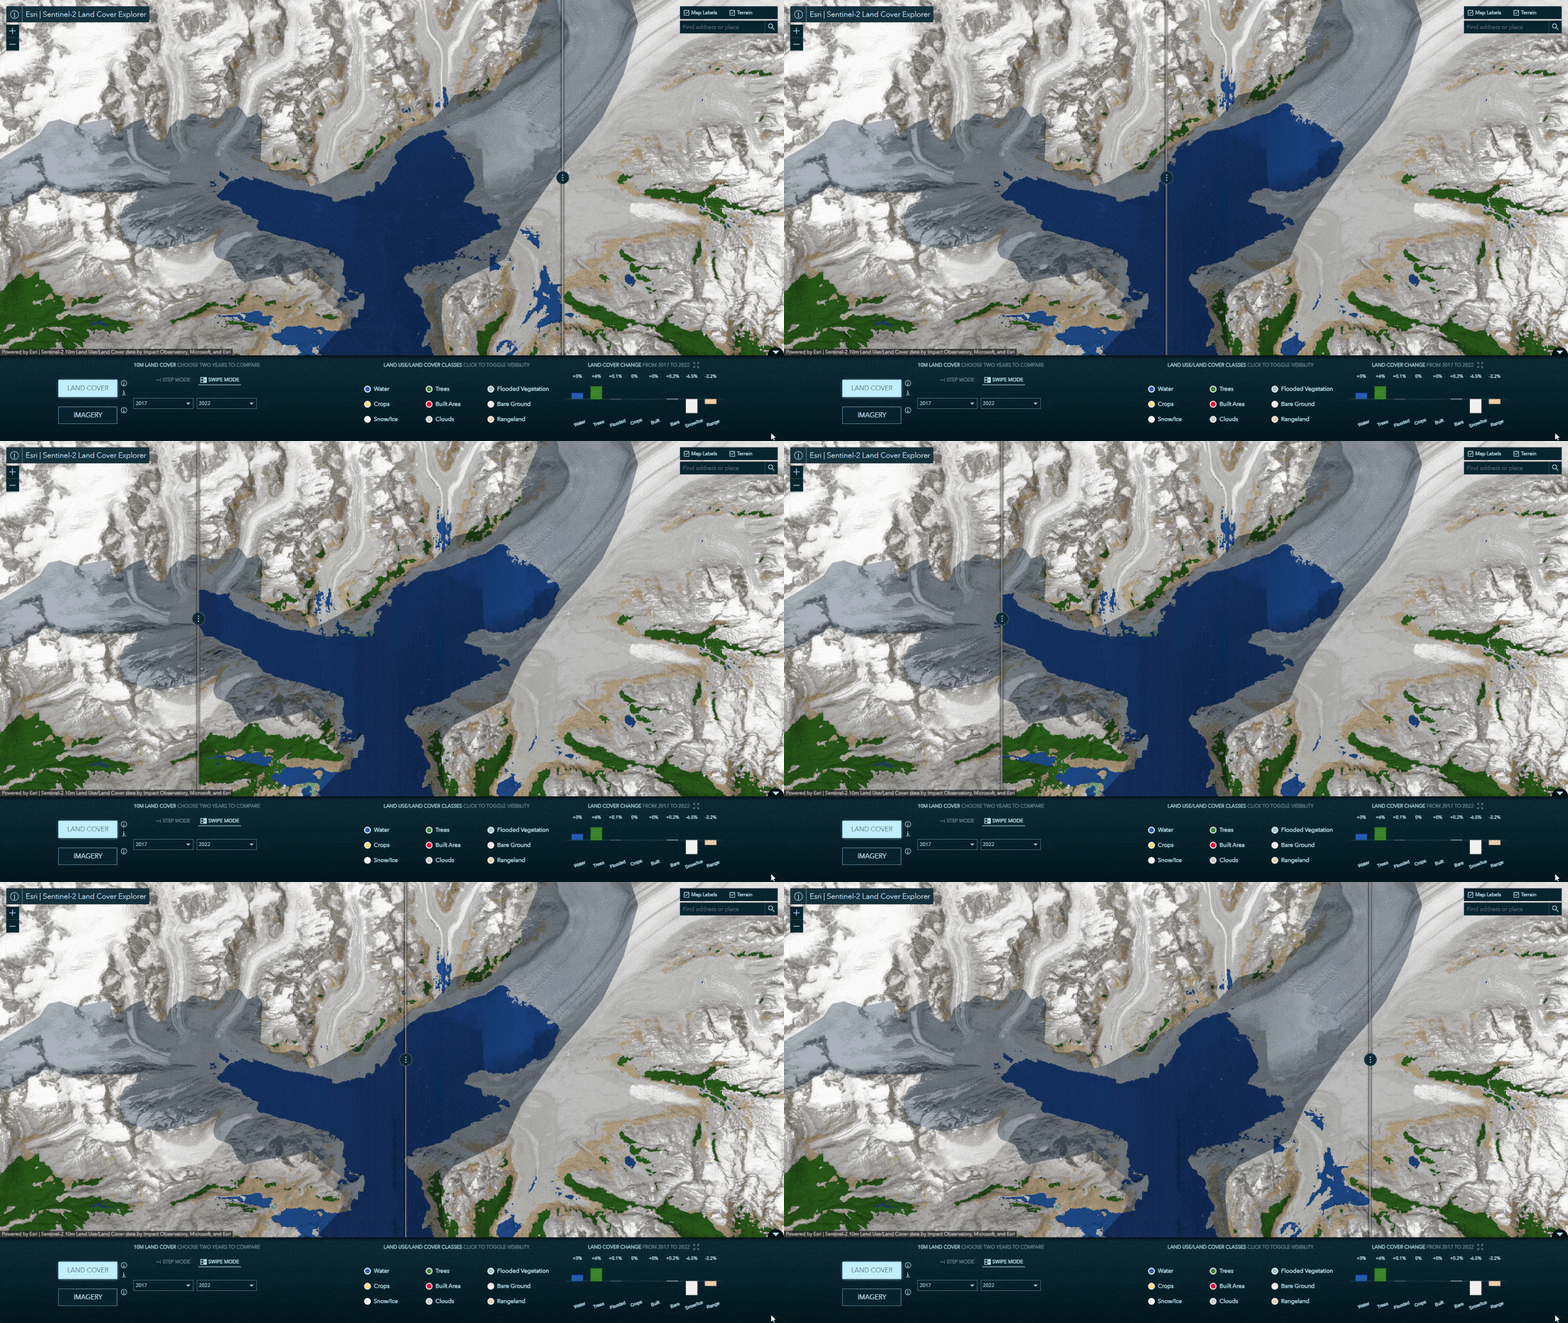
I’ve been to Columbia Glacier, just west of Valdez, Alaska, three times. The first was as a youngster in 1984, the second in 1987, and the final time in 2000. Each time, the ride by boat to the terminal edge of the ice where it calves into Prince William Sound, took a bit longer. I’ve not seen it for 23 years now, but the rate of retreat has not slowed. I now have the advantage of looking at its extent via the Land Cover Explorer application, which provides six years of Sentinel-2 imagery (10 meter pixel-equivalent resolution) and automated land cover classification.
This means that the 2023 version of John, separated from Columbia Glacier by 3,000 miles and 23 years, can see the progress of its retreat in a web browser. Which is incredible.
Here is a graphic showing the rate of retreat, made using data from the Land Cover Explorer, and a retro imagery basemap from World Imagery Wayback.
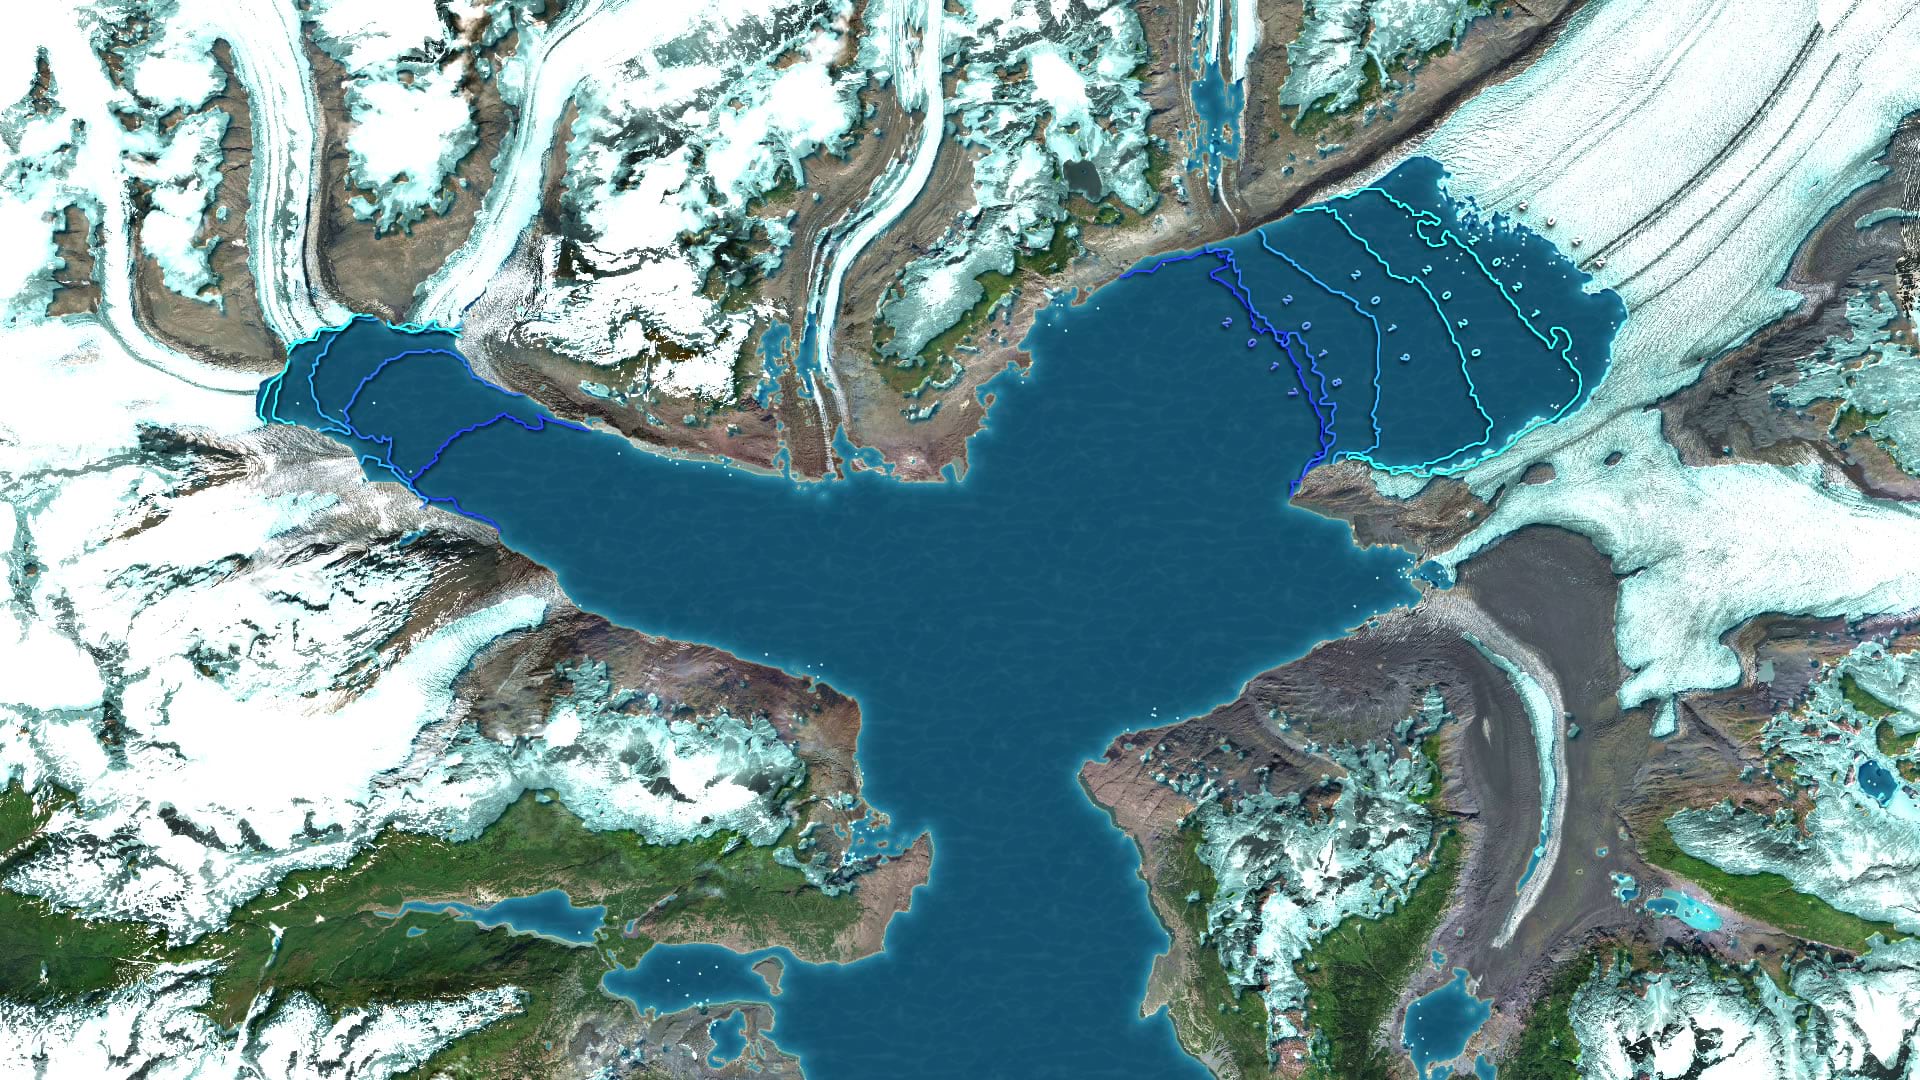
Here’s how you can make one like it, of this or some other glacier…
…
0:00 Intro teaser
0:04 Data sourced from Land Cover Explorer
0:29 Adding to Pro and clipping to area of interest
0:51 Converting raster to vector
1:12 Definition queries to separate water and ice into layers
1:35 Water symbology
3:28 How to find retro basemap imagery
4:29 Ice symbology
7:31 Results
I hope you grab the data and give something similar a try. Make something from this firehose of pixels and data. It’s a strange time to be alive. Full of change and full of opportunities to understand that change.
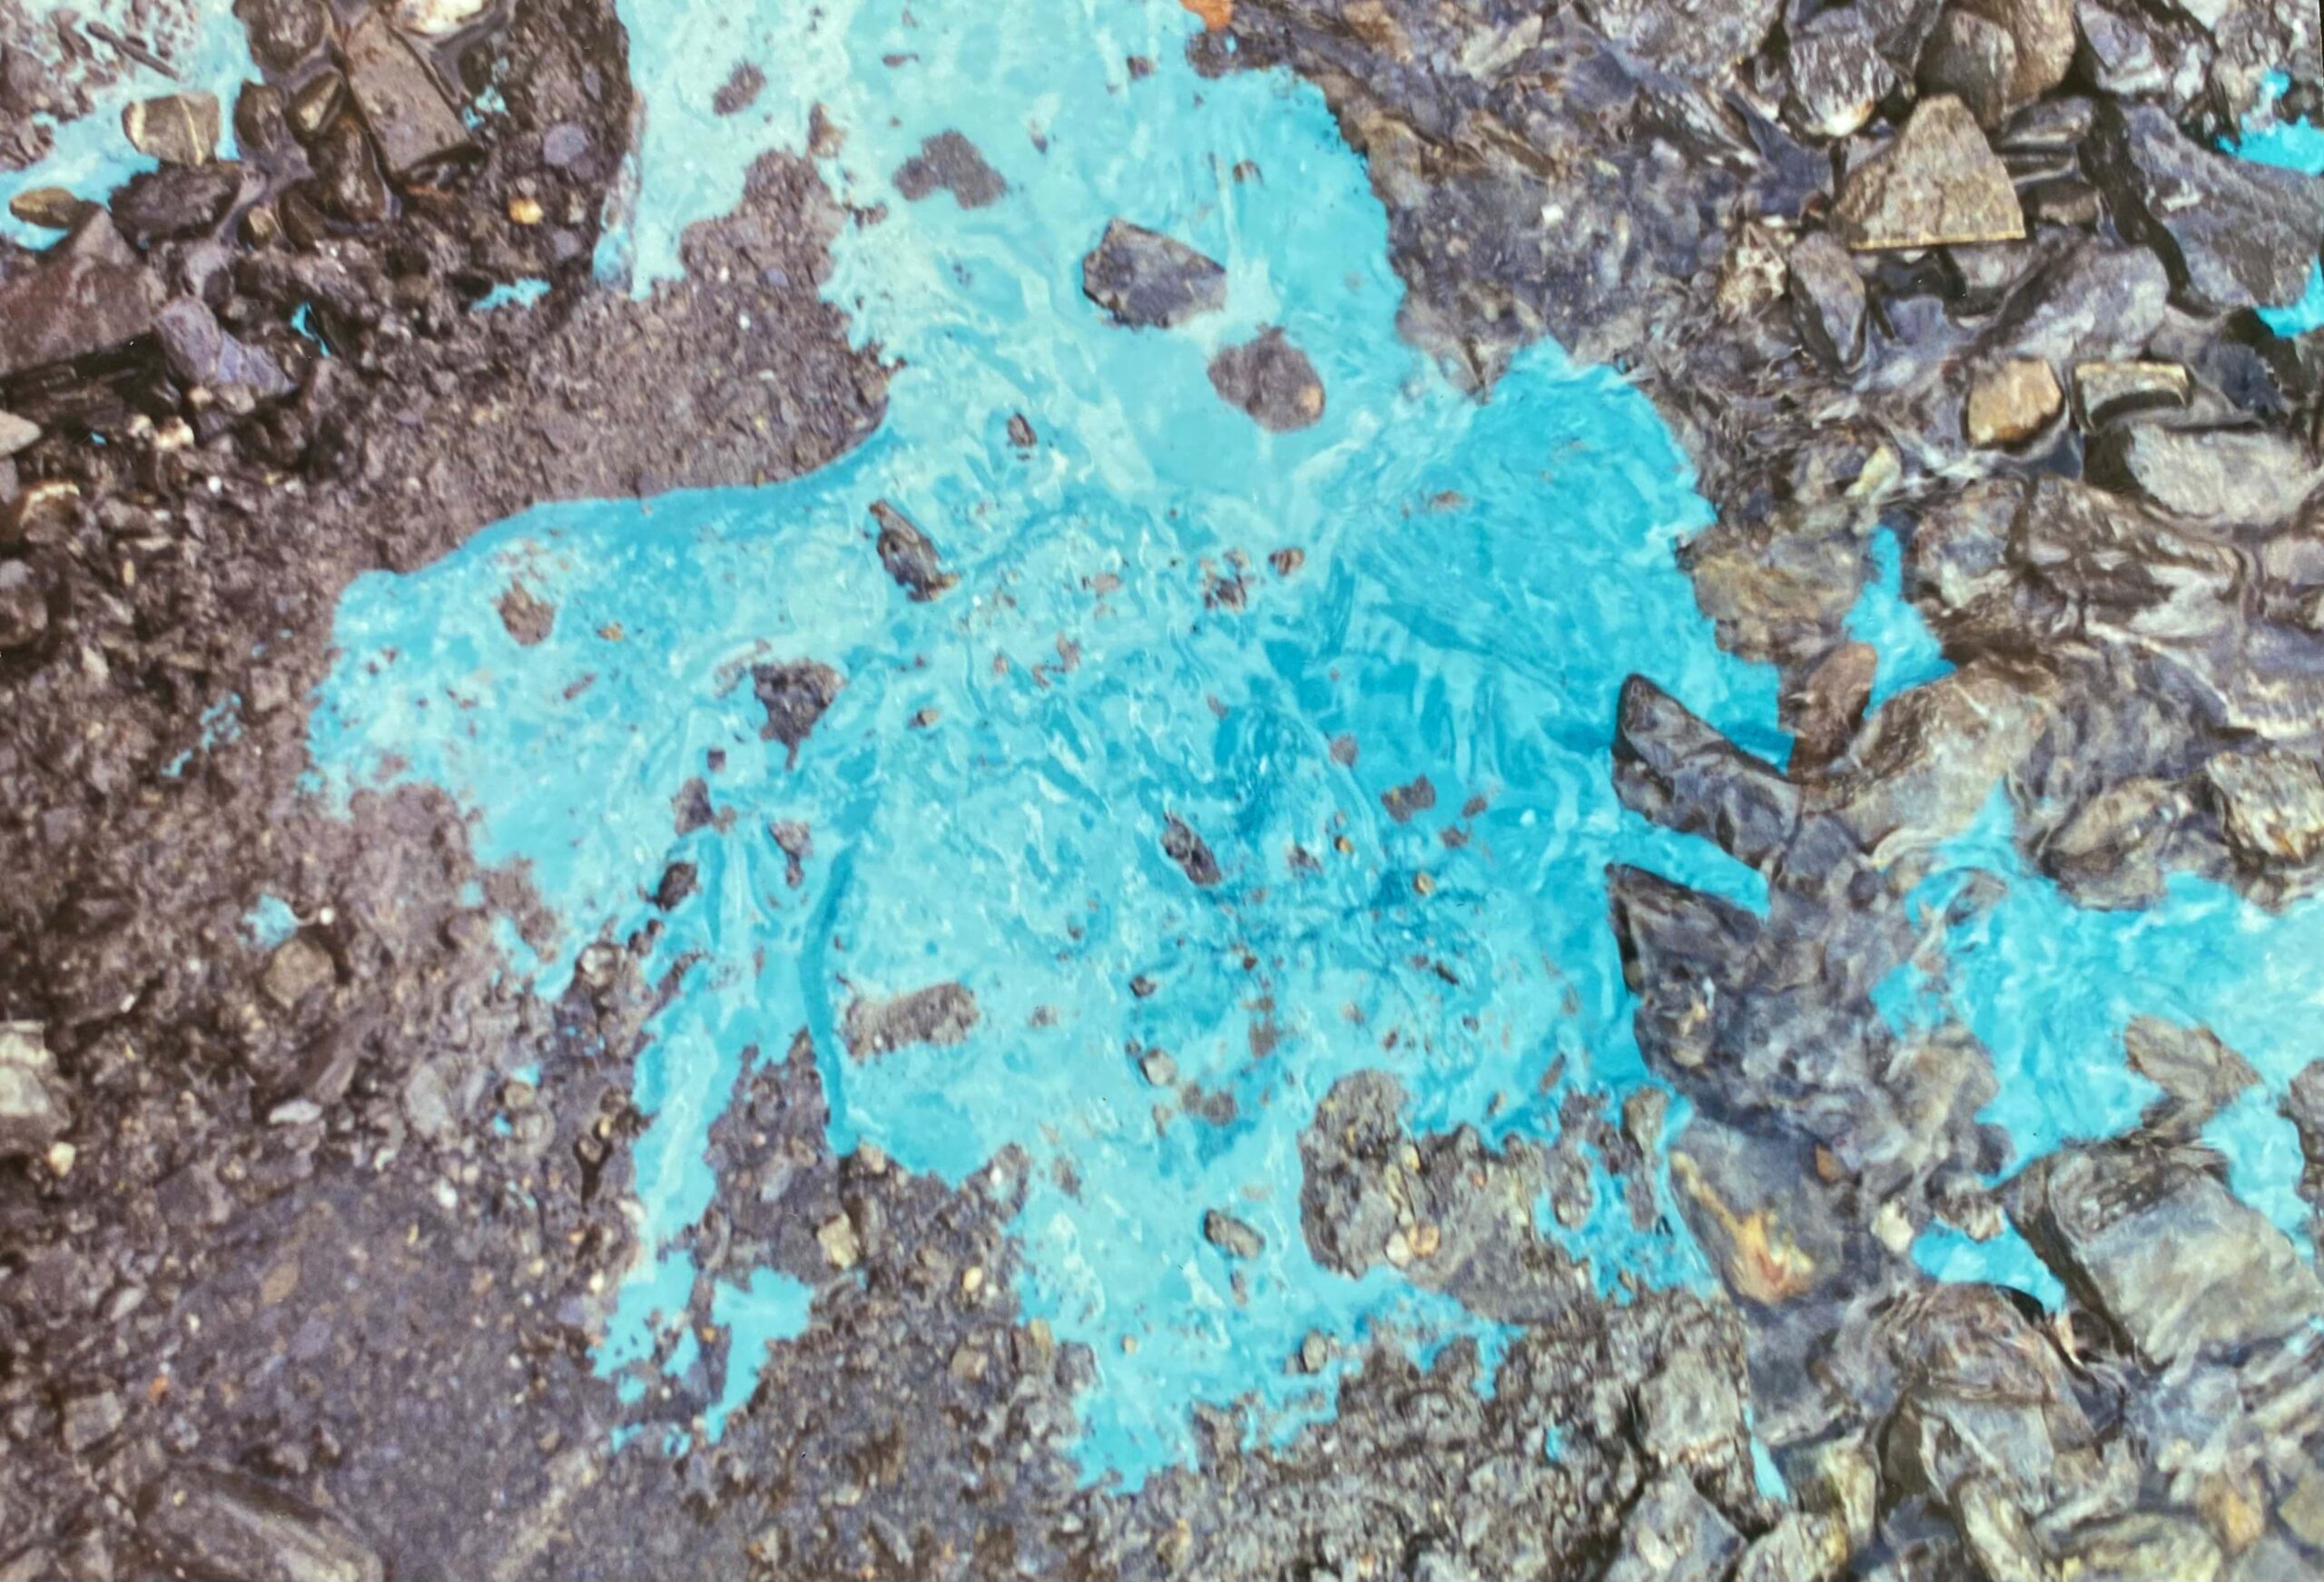
On that same trip to Alaska in the year 2000, I was walking along a gravel wash near the edge of nearby Matanuska Glacier. The surface was a mix of snow, tumbled stone, and some soil. The occasional small coniferous tree grew here and there. Then I noticed a brilliant blue stone that…impossibly…glowed. It was surreal. I kicked away some of the gravel around it to see what sort of sorcery this was and I realized that I wasn’t walking on the gravel near Matanuska Glacier, I was walking on Matanuska Glacier. A small bit of the hundreds-of-years-old compacted ice was exposed to the surface, peaking out from the detritus it had picked up on its journey down the valley. The aqua chatoyancy of the ice mass shone up through that exposed bit of ice like a buried floodlight. I nearly lost my footing in grasping the mass and pervasive presence of the glacier and my unexpected position on it.
Here is a snapshot that I took. I think about it pretty frequently.
P.S. This map’s ice and water symbology benefitted greatly from collaboration with colleagues Warren Davison and Tommy Fauvell. It sure is great to be a in league with such amazing folks and teams and tools.


Article Discussion: