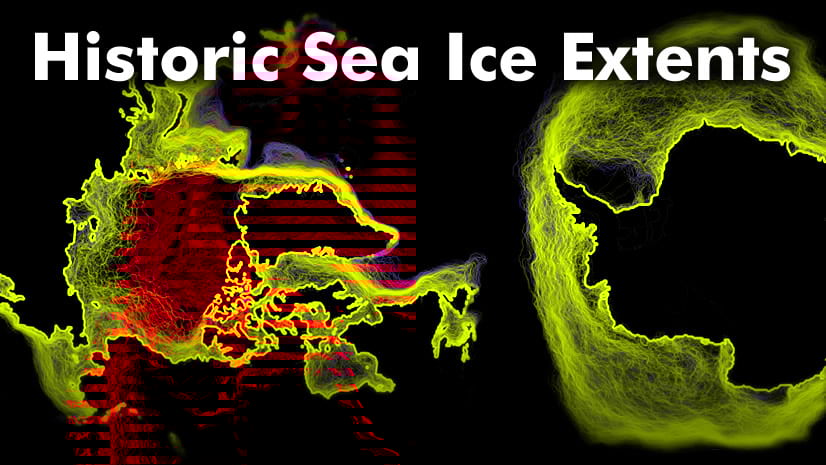
We’ve all seen the striking animations of polar sea ice extent using satellite data, often coming from NASA, NOAA , or even our own John Nelson. Sometimes they show the seasonal wax and wane, a rhythmic heartbeat of the poles. Sometimes they’re more dramatic, showing the annual minimum from year to year with a very perceptible trend (at least in the Arctic).

These visualizations capture our attention because the trend of decreasing ice in the Arctic is dramatic and clear. We see the melting ice, the starving polar bears, and we make the connection that something just isn’t right in the high latitudes.

Tracking Current Sea Ice Conditions
So what is happening with the sea ice right now? After the warmest July in history and warmest summer on record, 2019 was the second lowest extent of sea ice observed in the Arctic since satellite measurements began (only 2012 was lower). Sometimes it can be challenging to find that information (let alone the data), especially for both poles. But there’s a new application that allows you to track the status of sea ice in the poles.

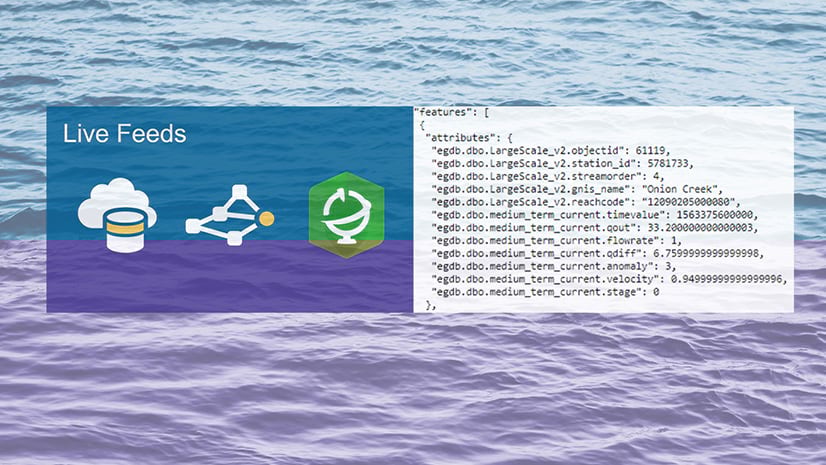
The Sea Ice Aware app leverages a series of new layers and maps available in ArcGIS Living Atlas of the World from the National Snow and Ice Data Center and NOAA. Updating each month, this information is important for understanding big picture changes in the poles, and also for analyzing regional trends such as the opening of shipping lanes and ports, along with areas for natural resource exploitation.
Using this web application, you can dig deeper into the NSIDC information to
- Display the monthly mean ice extent for each month from 1979 to the present, along with the historical median as a reference for above/below normal (yellow line).
- Interact with graphs of the minimum and maximum extents for each year – click on the bars to select the corresponding time in the map display.
- Compare the month-to-month changes of ice extent from the current year to other years and the historical median.
Unlike those striking animations you’ve seen on social media or in documentaries, these layers and web maps have full analytical capabilities. Skip the downloads and complex FTP sites, and use the layers directly in the ArcGIS platform, including in ArcGIS Online, ArcGIS Pro, or even products like ArcGIS Notebooks to support your workflows. In fact, check out this blog by Gonzalo Espinoza on analyzing the sea ice layers by using ArcGIS API for Python in Notebooks.
For questions or comments on this blog or the Sea Ice Aware app, please visit our GeoNet. If you’re interested in the source code for the app, it can be found on GitHub.

Commenting is not enabled for this article.