As the novel coronavirus continues to spread around the world, organizations are responding to this public health and economic crisis. Many organizations are using maps and GIS data to understand, manage, and communicate the location of community resources. Racially equitable COVID-19 responses are critical to identifying and supporting the unserved and underserved populations most at risk during this pandemic. GIS can help us support these underserved populations.
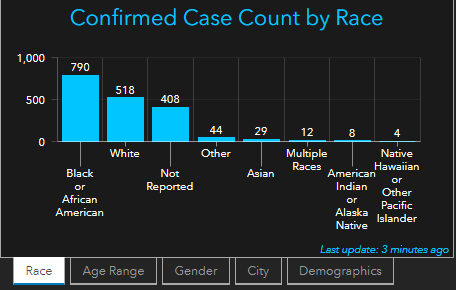
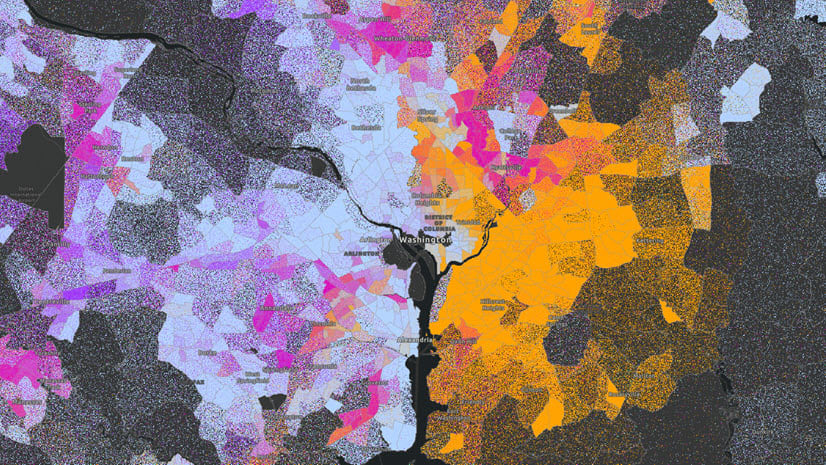
Timely information about race and ethnicity is vital to assessing how COVID-19 and related measures are impacting vulnerable communities. A glance at the preliminary data from Michigan reveals stark inequities between racial groups. Similarly, in Wisconsin, the data shows that African Americans Have Contracted and Died of Coronavirus at an Alarming Rate. In Louisiana, where about 1/3 of the population is African American, 70% of people who have died from COVID-19 are black. Similar trends are appearing across the country. These trends are due to historical inequities in distributional, process, and cross-generational equity. These inequities have not been addressed sufficiently in any arena for these communities.
Organizations must pay intentional attention to communities of color that are already disproportionately burdened, impacted, or at risk. Leading with a racial equity lens ensures a distribution of services that aligns with the greatest needs and encourages upstream investments that address the root causes of inequality.
Resources to Address Racial Inequity Amid COVID-19
We have compiled some resources to help your organization understand, plan, or respond to racial inequality and ensuing inequities amid COVID-19. These resources are not comprehensive nor guaranteed to be universally appropriate for every community. However, GIS can be an active tool in finding opportunities for increasing benefits and reducing barriers and burdens for unserved and underserved populations. Therefore, Investing in GIS can help your organization design and implement racially equitable disaster response approaches.
Read the other article in the series:
- Analyze Racial Inequity During COVID-19
- Use ArcGIS Dashboards to Increase Racial Equity in Your COVID-19 Response
- New Data Collection Available: COVID-19 Health, Racial, and Economic Equity
- Community Engagement for Racial Equity During COVID-19
- Planning a Racially Equitable COVID-19 Recovery
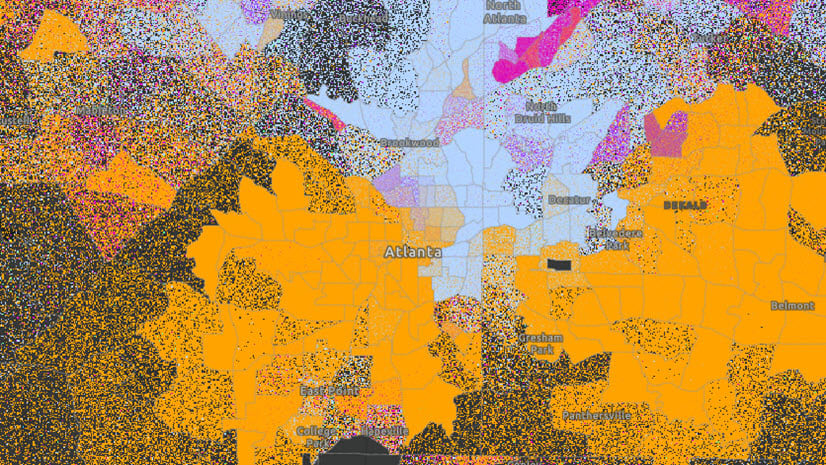
The Landscape of Inequality
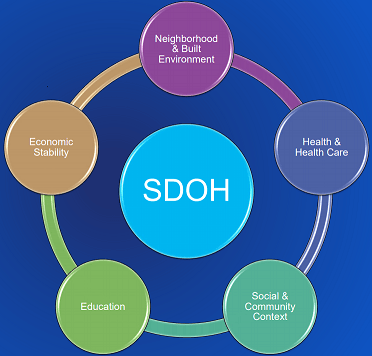
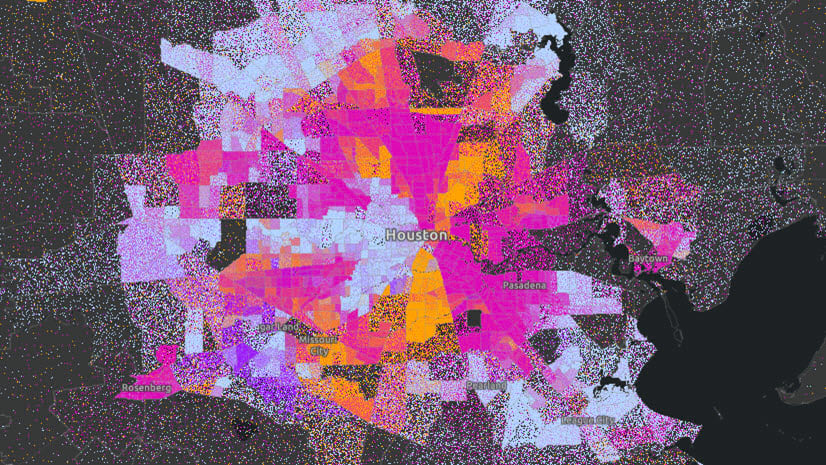
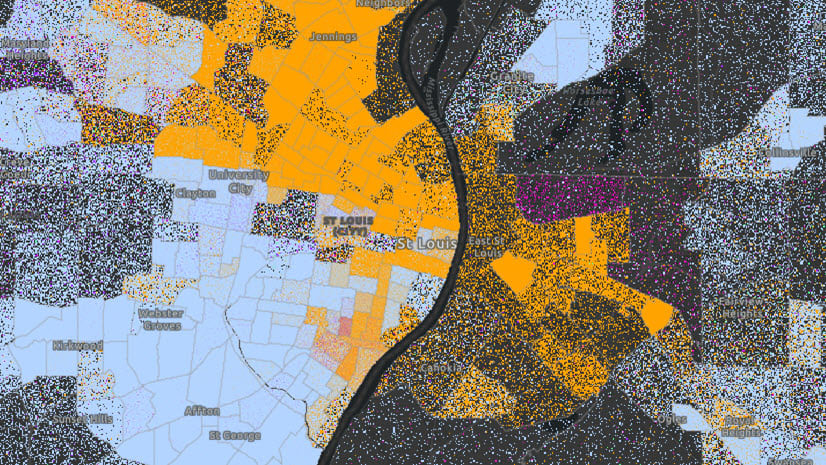
In the United States and around the world, people continue to experience inequities based on social factors. Race, ethnicity, gender, socioeconomic status, sexual orientation, ability, and other demographic factors still determine health and economic outcomes. Moreover, social factors like race, ethnicity, and socioeconomic factors impact a thriving connection to one’s geographic location. For marginalized populations in unserved and underserved communities, inequitable access to determinants of well-being leads to disparities across social indicators.
Racial inequities in access to healthy and affordable food, high-quality healthcare, and human services create monumental disparities in health outcomes. These disparities are further exacerbated by disproportionate exposure to environmental contaminants and waste sites. Inequities in access to good-paying jobs, affordable housing, high-quality schools, and affordable daycare lead to disparities in educational attainment and economic prosperity. Such inequalities are a legacy of hundreds of years of institutional and structural inequality that persist in systems and structures that support racism. These racial inequalities can worsen during a disaster.
Inequality and COVID-19
Marginalized communities face higher risks from the ensuing social and economic impact of coronavirus disease 2019 (COVID-19). More precisely, this is due to a of lack of historical upstream investments in these communities where needs are greatest before COVID-19. A crisis exacerbates existing racial and economic inequality. A racially equitable COVID-19 GIS response takes current inequities into account and aligns actions accordingly. Meaning, it distributes resources equitably to support marginalized communities rather than equally across all populations regardless of need. An equitable approach allocates resources according to the greatest need instead of following a one-size-fits-all methodology.
-
Health & Environmental Inequalities
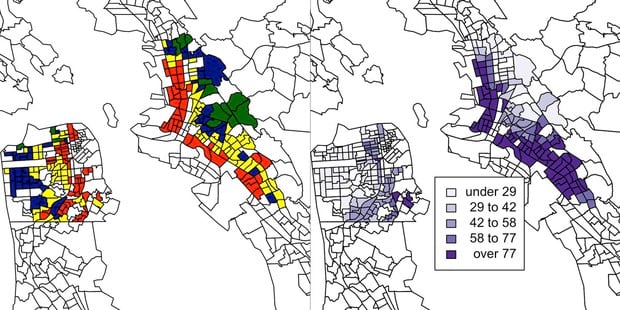
Disproportionate levels of environmental pollution affecting communities of color are indicative of equity disparities. One study found that individuals living in neighborhoods redlined during the 1930s are more than twice as likely to go to the emergency room for asthma today. A study found that race, more than poverty, was the strongest predictor of exposure to damaging particulate matter in the air — particularly for African Americans. Therefore, these populations are more at risk of the underlying respiratory conditions that are especially dangerous during the COVID-19 pandemic.
-
Economic Inequalities
Many systemically and structurally disadvantaged groups are facing additional risks as essential workers on the front lines of the crisis. More specifically, these workers are disproportionately people of color and low income. For instance, many lower-income workers cannot practice social distancing to the extent that wealthier, non-marginalized people can. Critically, these same individuals are also least likely to have health insurance and other financial resources due to the racial wealth gap.
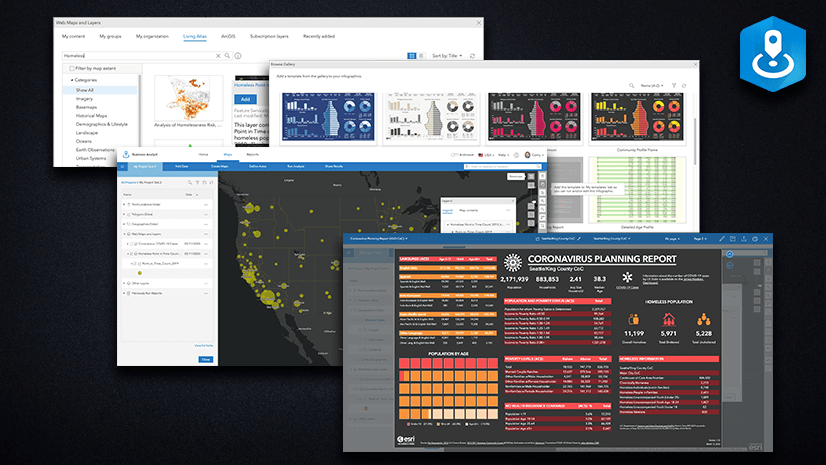
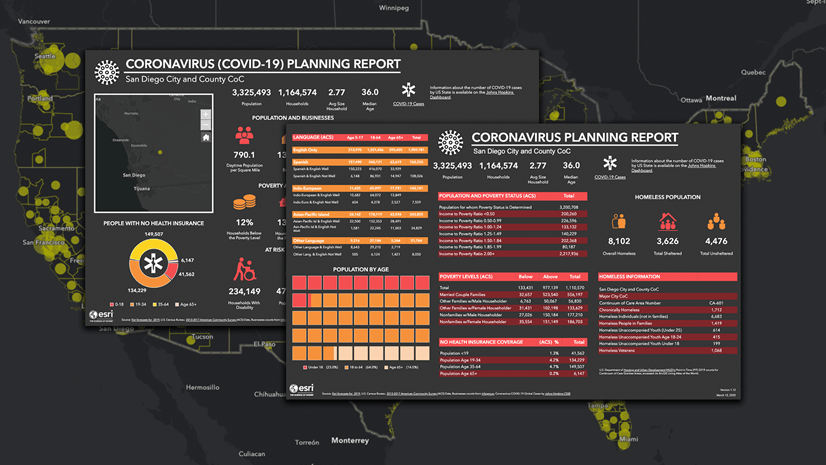
Taking Action with GIS
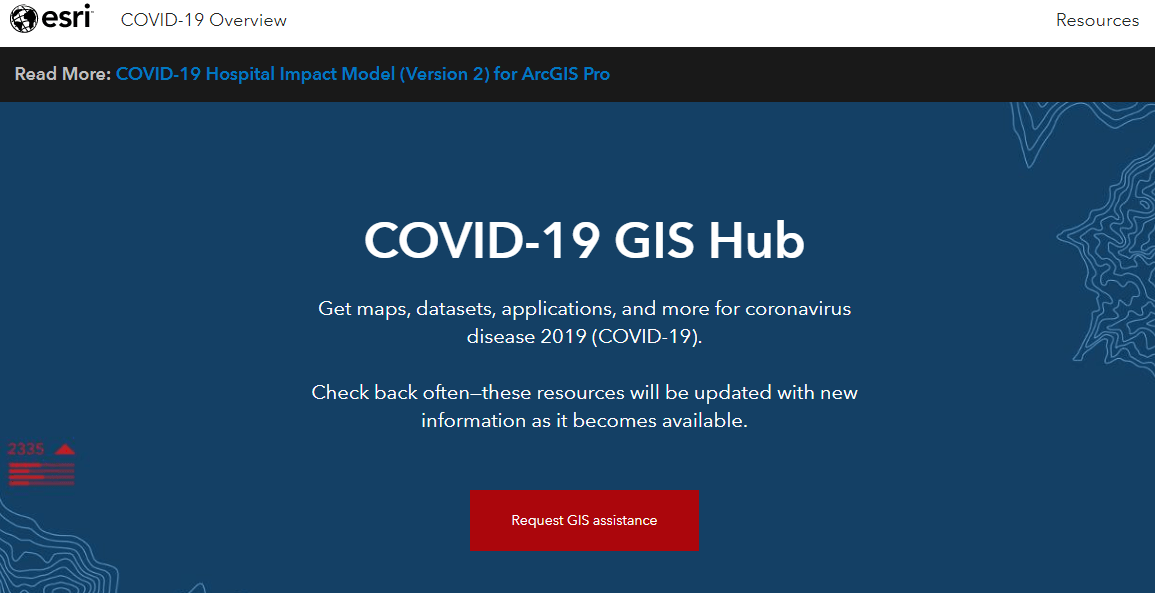
To begin using GIS to address increasing racial equity impacts in unserved and underserved communities, use the Esri COVID-19 Hub. This hub provides access to a carefully curated collection of data, applications, and useful content currently available. Check back often for new datasets, tools and applications.
We recommend the following steps for you and your organization: analyze, engage, plan, and respond. Technology is a human right and a tool to create thriving outcomes in marginalized communities. The other articles in this series provide additional guidance on each of these topics. They also share GIS resources to help you jumpstart your response.
Read the related article in the series:
We want to hear from you
How is your organization responding equitably? Please share your success, tips, and challenges by commenting here. You can also share your experience and questions using the GIS for Equity and Social Justice GeoNet Forum.


Article Discussion: