ArcGIS Business Analyst Web App and the ArcGIS Business Analyst extension in ArcGIS Pro have long been companion applications for spatial analysis. Business Analyst Web App is a go-to product for web-based GIS for users who want to understand communities, support business expansion, and identify market opportunities. It is updated three times a year, in line with ArcGIS Online product releases.
Business Analyst Pro, on the other hand, is part of Esri’s powerhouse ArcGIS Pro desktop software and is released for download twice a year. It extends the web capabilities with more advanced workflows, territory design, customer analysis, and more.
Because Business Analyst products are developed in tandem, workflows in one application often serve as inspiration for the other application. This is the case with threshold areas, which creates rings or drive-times around a point location containing the specified value of a variable.

What are threshold areas?
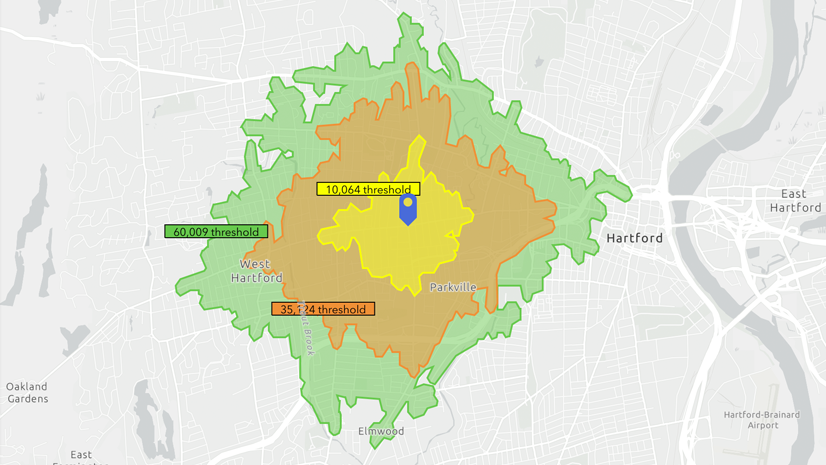
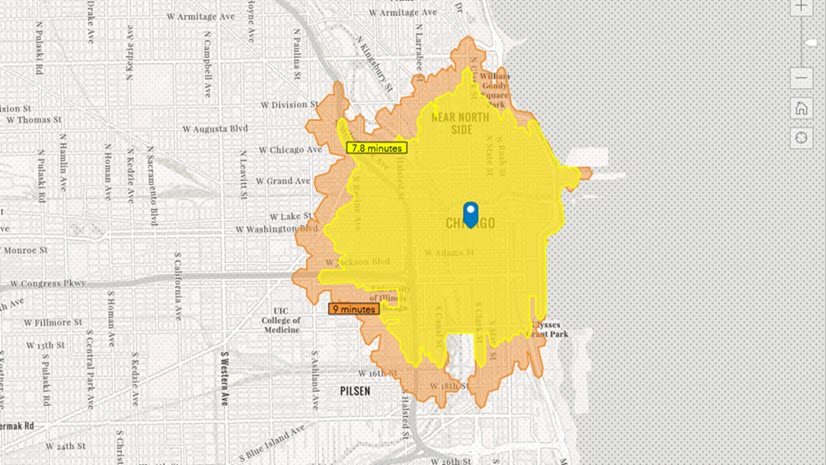
You can create threshold areas around a site that contain a specified amount of a variable. For example, you can create a ring around a location that covers 10,000 housing units or a drive time that includes $100,000 of food and beverage store sales.
In Business Analyst Web App, you can use the threshold areas workflow with up to 10 point locations to create threshold areas based on rings or drive times. Each ring (or drive time) around the point location encompasses the specified amount of a variable. Results are displayed on the map, in the results table, and summarized in the workflow pane.

In Business Analyst Pro, the Generate Threshold Rings and Generate Threshold Drive Times tools create trade areas that grow from any number of points on the map until a threshold variable value is met. The results are displayed on the map and in the layer’s attribute table.

How do I get started?
In both workflows, you create threshold areas based on point locations. For example, in Business Analyst Web App, search for a single location, use a point layer, or select from existing sites in your project. In Business Analyst Pro, your input is an existing layer of points.
How do I set threshold values?
Once you’ve selected which points you want to create threshold areas from, set the threshold values.
In Business Analyst Web App, create up to three threshold areas using any variable from the data browser. The threshold areas can either use rings or drive times.

In Business Analyst Pro, create as many threshold areas as you want, given your computer’s processing capacity. Either use values (based on a variable from the data browser) or expressions (rules to modify values of a variable based on certain conditions).
For more complex analyses, expressions provide greater specificity to the threshold area calculations. For example, you can use an expression to assign different threshold values to store locations that are in a single layer, based on the sales for a particular location.

The threshold areas can either use rings (with the Generate Threshold Rings tool) or drive times (with the Generate Threshold Drive Times tool).

How do I explore the results?
The threshold area results appear on the map and in tables.
In Business Analyst Web App, results appear on the map, in a table, and summarized in the workflow pane. The resulting threshold areas can be immediately used to run infographics and reports and are stored in the project as sites. The new sites can be leveraged in additional workflows, such as suitability analysis or void analysis. The table results can be exported to an Excel spreadsheet.

In the Threshold areas pane, you can use the Threshold drop-down menu to view a summary of each threshold. You can hover over each item to understand the underlying calculations for the created threshold, precision, and threshold area size.

There may be cases when the threshold values returned by the algorithm differ from the threshold values you set in the workflow. The values returned may be more or less than the requested threshold value. For more information on threshold calculations, see Considerations.
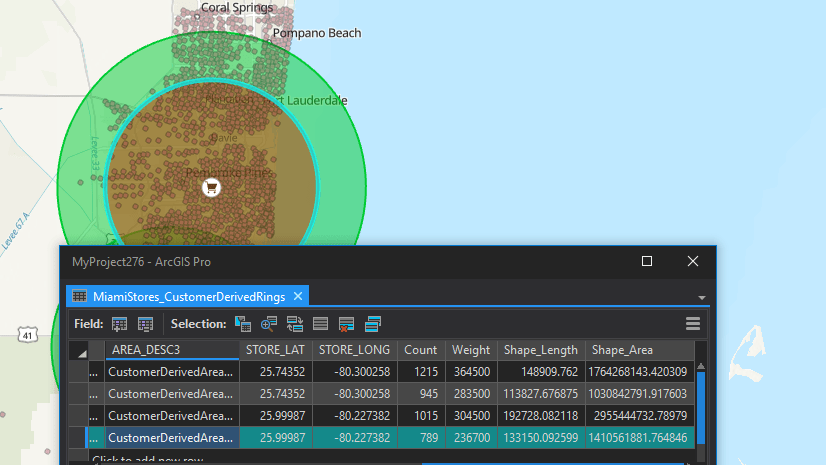
In Business Analyst Pro, the results appear as a new layer on the map and in the feature layer’s attribute table. Since the resulting data is stored locally as a feature class, there are many options for analysis and presentation of results. In addition to running infographics and reports, the areas can be used as the input for other workflows, like Enrich Layer or Calculate Market Penetration.

To view the attribute table, either right-click the layer in the Contents pane and select Attribute table or click the Data tab on the ribbon and click Attribute Table. The layer’s attribute table contains new fields that specify the variable value, actual value, radius length, and radius units.
What are the similarities between the two workflows?
Overall, there are some similarities when you create threshold areas in Business Analyst Web App and Business Analyst Pro. You can either create threshold areas based on rings or drive times. Your thresholds can be defined using values.
If you are using drive times to create the threshold areas, you can set additional parameters. For example, set the distance units, distance type, traffic settings, and threshold percent difference (how much of the specified threshold value the area should contain).
What are the differences between the two workflows?
There are a few key differences when you create threshold areas in Business Analyst Web App compared to Business Analyst Pro.
In Business Analyst Web App, you can only use up to 10 points. This limitation does not exist in Business Analyst Pro, which enables you to scale your analysis to a much larger degree. Furthermore, your threshold values can be set using expressions, which provides greater specificity and nuance to the calculation.
In terms of drive time parameters, you have additional options in Business Analyst Pro, such as designating an ID field, mode of travel, and polygon generation type. For example, if more precise geometry is needed for your trade area, the Polygon Detail parameter can be defined as High to generate polygons with a high level of detail.
Summing it all up
Whether you are working on a regional scale to create just a few areas or are creating several rings or drive times around many locations across a country, Business Analyst has a solution to cover your needs for creating threshold areas. For a web-based solution that will quickly and flexibly walk you through the process of creating threshold areas and running reports, Business Analyst Web App may be the best option. For a desktop solution that can process a large amount of data and be extended for your specific needs, Business Analyst Pro may be best for your goal.
Resources
Now that you’ve learned about threshold areas, we hope you’ll explore more capabilities in Business Analyst. To continue your Business Analyst journey, visit the following resources:
- Business Analyst product overview page
- Review pricing and purchase Business Analyst
- Business Analyst resources page
- LinkedIn user group
- Business Analyst Web App video channel
- Business Analyst Pro video channel
- Business Analyst on Esri Community
- Business Analyst Web App login page
- Email the team: businessanalyst@esri.com
This article was originally published on July 8th, 2022, and has been updated. It uses Business Analyst Web App Advanced and Business Analyst Pro to create threshold areas.


Article Discussion: