ℹ️ This series covers hosted services in ArcGIS Online and ArcGIS Location Platform. See this overview for context.
If you’ve ever tried to make sense of your ArcGIS usage reports and found yourself wondering how your storage, bandwidth, or tile generation adds up, this article is for you.
Understanding how feature, vector tile, and map tile services are metered and monitored (and how developers and administrators can attribute their costs) remains a common challenge for many teams.
This article is written for product managers, DevOps, FinOps, and solution architects who need a clear picture of how metering and monitoring work behind the scenes, and how usage translates into operational or financial impact.
In this article, you’ll find:
- What gets metered
- Breakdown of usage metrics per service
- Service metering frequency
- Usage allocation
- Service monitoring tools
- Where to find each metric
- When services stop working
By the end of the article, you’ll understand how the usage of hosted data services is measured and accounted for, how costs can be attributed to specific services, applications, or credentials, and where to find each metric. You’ll also learn how to monitor usage effectively, interpret reports, and use tools to detect anomalies or potential downtime.
Note: This article builds on ArcGIS Hosted Services: Terms of Use & Pricing and assumes you’re familiar with the material covered there.
Notes on accuracy: Surviving the test of time …
As introduced in the first article of this series, this series is a unified resource to save you time and clarify differences between similar technologies, based on information from official sources.
Technology evolves rapidly, so some details may become outdated. Each article includes references to official documentation, which contains the most up-to-date information. In case of discrepancies, the official documentation takes precedence.
If you find something unclear or spot an error, let us know at developers@esri.com. Your input helps us improve the clarity and accuracy of this content.
What gets metered
Let’s take a closer look at what metrics matter and what they mean in the context of hosted data services:
- Tile generation: Number of map tiles or vector tiles created from a service.
- Storage: It is measured (and billed) in two ways:
- File storage refers to static files, which include:
- Pre-cached map tiles and vector tiles.
- Attachments within feature services.
- Static file used to create the services: tile packages, GeoJSON, CSV, etc.
- Feature storage (applicable only to feature services) refers to the space required in the database to store structured data (points, lines, polygons, and associated attributes), which also includes indexes and drawing optimizations.
- File storage refers to static files, which include:
- Bandwidth: Volume of data transferred when map or vector tiles are requested, or when queries and edits are made to feature services.
Note: Although bandwidth usage is measured and displayed in ArcGIS Online monitoring tools, this does not incur any costs, as explained in the previous article.
Breakdown of usage metrics per service
To understand how your hosted services consume resources (and how each component impacts overall usage and billing), this section breaks down the key metrics tracked for each service type.
Each service measures different aspects of processing, storage, and data transfer.
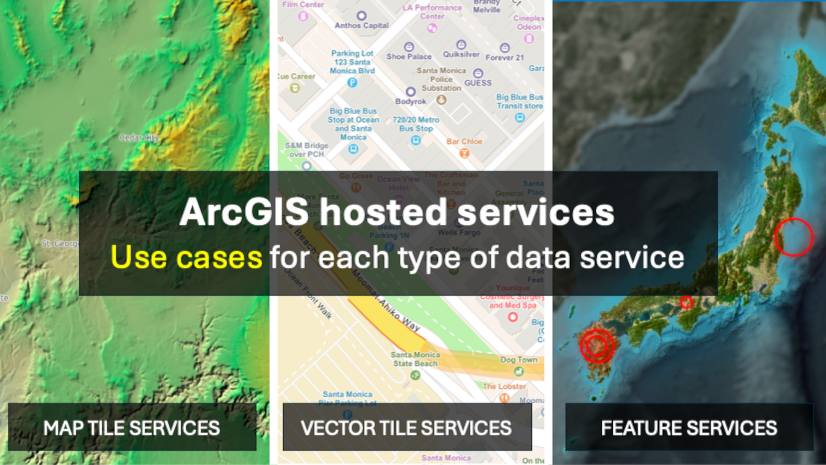
Hosted tile services
Tile services (both map tiles and vector tiles) usage is primarily determined by how tiles are generated, stored, and delivered:
- Tile generation refers to the process of pre-caching tiles (when they are published from feature services), either
- Statically: if all map tiles are pre-generated at publishing time.
- On demand: for vector tiles, or when you configure the map tile service to be created on demand.
- Manually: when you rebuild or update the cache later.
- File storage refers to the average amount of pre-cached static tiles stored as a result of the tile generation.
- Bandwidth measures the amount of data transferred when end users request tiles.
Hosted feature services
In terms of feature services, this is what’s been measured:
- Storage is incurred in both:
- Feature storage: the average size of the feature data itself (geometry + attributes)..
- File storage: any attachments (images, documents, etc.) stored alongside your features.
- Bandwidth: Measures the total amount of data transferred:
- Reads: when clients load or query features.
- Writes: when clients apply edits or updates.
Note: The hosted feature layer view consumes bandwidth but does not require additional storage.
Additional notes about how bandwidth and source data references are metered
Bandwidth metering:
- Data delivered from ArcGIS servers or the CDN counts toward usage.
- Data already cached in the user’s device isn’t metered again.
- Bandwidth metering applies only to ArcGIS Location Platform.
Source data references:
- When publishing a service from a static file (e.g., a tile package or GeoJSON), the service keeps a reference to that file, but usage is tracked independently.
- The same applies when publishing map tile or vector tile services from a feature service.
File removal warning:
- Deleting static source files may cause unintended side effects.
- See Manage hosted layers > Delete operations and layer dependencies for details.
Related reading: How much storage does each service type consume.
Service metering frequency
Understanding how metering works helps you interpret usage dashboards and estimate approximate costs.
The metering frequency is the same for all types of hosted services types (feature, vector tile, or map tile) and for both ArcGIS Online or ArcGIS Location Platform.
- Storage is metered hourly.
The system records the amount of data stored every hour, including all services, attachments, and other hosted content (tile packages, static datasets, or any other supported item).
This allows you to estimate the impact of temporary actions, such as uploading large datasets for short periods. - Tile generation and bandwidth usage are tracked as they accur, with usage updates typically reflected within 5–10 minutes. Unlike storage, this timing has no effect on usage calculations.
Despite the frequency of system metering, each service has different recording and logging procedures, which may lead to delays in the monitoring tools for your review. See “Billing differences” to learn more about this.
Related content about storage metering frequency
Relevant resources about this topic:
- ArcGIS Online > Manage subscription > View and report status.
- ArcGIS Location Platform > Help > Billing > Storage.
- How to Manage Storage Credits in your ArcGIS Online Organization.
Community questions:
Usage allocation
Before diving into service monitoring tools, it’s important to understand how usage measurements are allocated, as this directly impacts how you can attribute expenses to the service, application, user, or, when attribution is not possible, assumed by the organization.
The following table summarizes how the expenses can be attributed:
| Service | Dev credential | User1 | Organization | |
|---|---|---|---|---|
| Tile generation |
❌ |
❌ |
✅ |
✅ |
| File storage |
✅ |
❌ |
✅ |
✅ |
| Feature storage |
✅ |
❌ |
✅ |
✅ |
| Bandwidth |
✅ |
✅ |
❌ |
✅ |
(1): ArcGIS Online are multi-user organizations while ArcGIS Location Platform are single-user organizations.
Service monitoring tools
Monitoring capabilities are the same across all hosted service types, but the available tools differ between products.
Both ArcGIS Online and ArcGIS Location Platform users can check service usage through the “Status” tab in the Portal. In addition, ArcGIS Location Platform provides a dedicated Usage Dashboard with additional detailed reporting.
Let’s take a closer look at the differences between them.
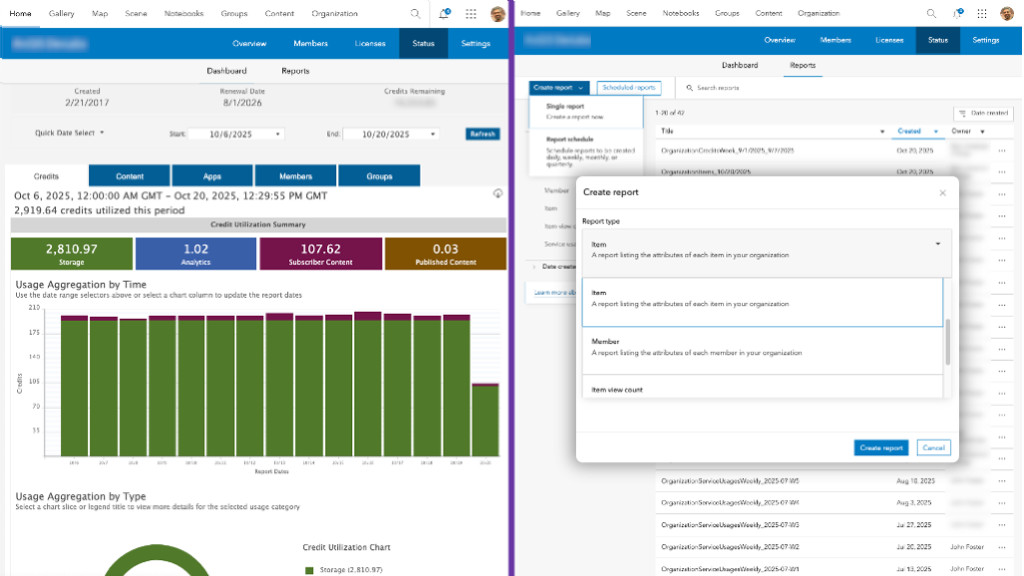
ArcGIS Portal “Status” tab
You can monitor hosted data service usage from the Portal > Organization > “Status” tab. It provides several tools to explore and report on resource consumption:
- Reports:
Generate one-time or scheduled reports with detailed usage information, such as:- Item report: provides a snapshot of all the content items, allowing you to explore the storage of all hosted data services.
- Credit report: summarizes aggregated storage usage and tile generation per user.
- Service usage: contains bandwidth usage associated with each data service or application.
- Dashboard:
Allows you to filter and explore content and usage in different ways:- Both ArcGIS Online administrators and ArcGIS Location Platform users can filter and explore content usage, member activity and groups activity.
- In addition, ArcGIS Online provides credit-consumption and apps-usage tabs.
Note: Although the Dashboard tab is available in both products, it is primarily designed to provide administrators in multi-user environments to dynamically explore organizational usage and activity.
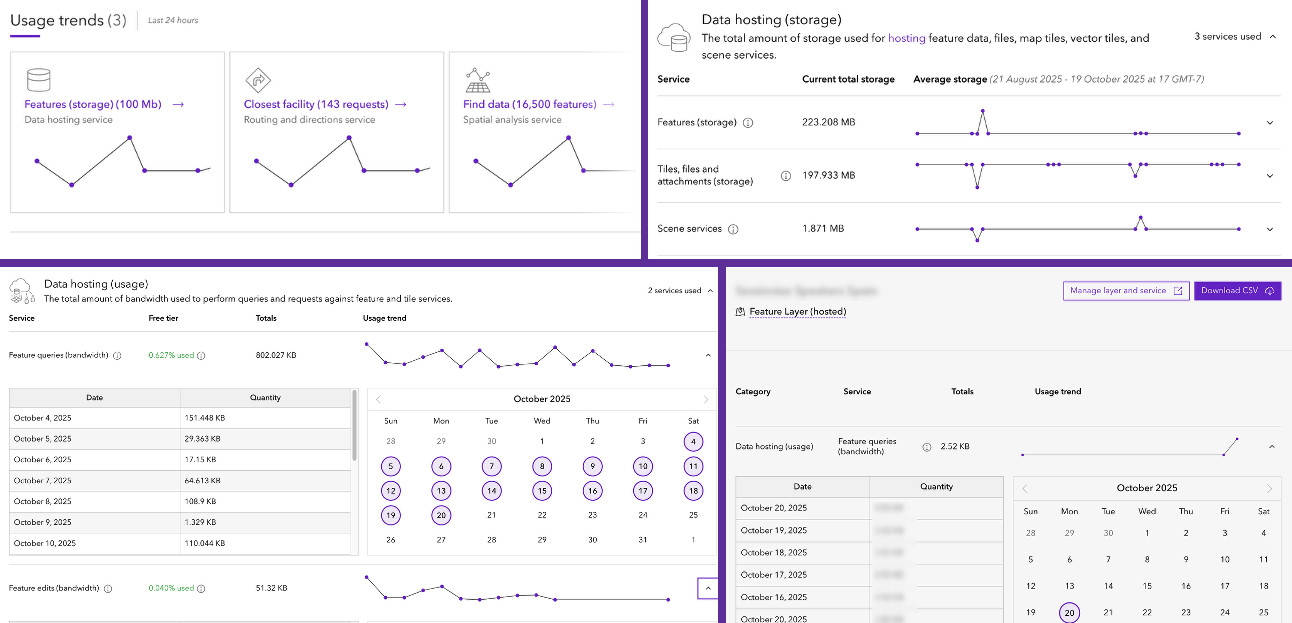
ArcGIS Location Platform Dashboard
The ArcGIS Location Platform Dashboard enables you to monitor and analyze hosted service usage. Specifically, you can:
- View the last 24 hours’ usage trends, including aggregated bandwidth and tile generation.
- Check aggregated data hosting storage.
- Explore bandwidth usage per individual item.
Additional FAQs about monitoring and usage management
Q: Is it possible to set automatic budget caps?
ArcGIS Online admins can set certain service limits per user.
ArcGIS Location Platform doesn’t provide a mechanism to set usage limits or monthly billing caps, so we recommend monitoring usage regularly and implementing limits within your app.
We appreciate your feedback in the ArcGIS Location Platform ideas forum to explore ways to make usage management easier in the future.
Q: Is it possible to automate observability of service usage?
The available options today are:
- Programmatically create a new usage report using the gis.admin submodule within the ArcGIS API for Python, which implements an AGOLUsageReports class that, under the hood, uses the report endpoint from the REST API (check
reportSubTypeparameter for the report types). - Schedule reports that can be downloaded from your Portal.
No other API is documented to access granular in-service usage.
Q: Can I create reports for any timeframe?
Reporting flexibility depends on the tool:
- ArcGIS Portal supports reports at fixed intervals (weekly, monthly, and quarterly), based on calendar dates (learn more).
- ArcGIS Location Platform Dashboard offers custom date ranges, giving you more control over the reporting period (up to a maximum of 60 days).
Q: Why do I see “credits” in ArcGIS Location Platform or “bandwidth” in ArcGIS Online reports?
Some usage reports and menus inherit metrics and terminology from other ArcGIS products, which may not always align with the billing model of the platform you’re using.
For example:
- ArcGIS Location Platform follows a pay-as-you-go model without credits, yet some reports may still reference “credit usage”.
- ArcGIS Online, on the other hand, may display metrics such as bandwidth consumption or basemap tile usage, even though they don’t directly affect billing.
These metrics remain useful for understanding system activity, but they should be interpreted within the context of each product pricing structure.
Q: How long is usage data stored?
ArcGIS Location Platform retains usage data for up to 60 days, allowing you to generate reports or view usage metrics within that timeframe. In contrast, ArcGIS Online offers a longer retention period, storing usage data for up to 2 years, depending on the item type and reporting tool used (more info).
Q: How can I find which application or credential a specific clientId belongs to?
Each clientId identifies an item (registered application or developer credential) in ArcGIS.
You can only view details for a clientId if you own that item. To do so, use the following REST endpoint: https://arcgis.com/sharing/rest/oauth2/apps/{CLIENT_ID}?f=json&token={TOKEN}
Q: Why does service usage show bandwidth from apps I can’t identify?
Bandwidth usage includes traffic from all applications that access your hosted layers (not just your own). This can include Esri apps such as Map Viewer, Vector Tile Style Editor, ArcGIS Pro, as well as third-party applications.
Note that Esri applications typically use recognizable client IDs, such as arcgisonline, arcgisprodesktop, survey123hub, arcgisnotebooks, or vtse.
Q: Is there a recommended SDK to optimize feature service bandwidth usage?
Yes. We recommend using the ArcGIS Maps SDKs, which are specifically designed to optimize feature service usage. These SDKs work efficiently across applications by minimizing unnecessary requests and streamlining data access.
Q: Why do newly published tile services show the same storage as their source feature service?
After publishing a map tile or vector tile service from a feature service, reporting tools may temporarily display the same storage size as the original feature service.
This happens while the system updates usage metrics and recalculates storage.
In most cases, the values update within a few hours, but in some situations, it may take up to two days for the correct storage to appear in reporting tools.
Q: If my question isn’t addressed here, where should I ask?
First, check the ArcGIS Online FAQ and the ArcGIS Location Platform FAQ.
If your question isn’t answered there either, you can post it in Esri Community under ArcGIS Online Questions or ArcGIS Location Platform Questions.
Learn more about these administration tools
Related documentation pages a blog articles:
Where to find each metric
So far, we’ve looked at:
- What is measured for each service type.
- How usage data is allocated and how costs can be attributed.
- Which tools you can use to monitor usage.
Now, let’s focus on where to find each metric in those tools.
The table below summarizes where each usage value is reported.
| Per item | Per dev credential | Aggregated (by user) | Aggregated (whole account) | |
|---|---|---|---|---|
| Tile generation (both) | N/A | N/A | Credit report | ArcGIS Location Platform Dashboard > Usage > All services |
| Feature storage | Item report | N/A | Credit report | ArcGIS Location Platform Dashboard > Usage > All services |
| File storage | Item report | N/A | Credit report | ArcGIS Location Platform Dashboard > Usage > All services |
| Tile storage (both) | N/A | N/A | Credit report | N/A |
| Bandwidth (any) | ArcGIS Location Platform Dashboard > Usage > Layers and data services | Service usage report
ArcGIS Location Platform Dashboard > Usage > Developer credentials |
N/A | ArcGIS Location Platform Dashboard > Usage trends |
Note: Reported usage metrics may differ slightly from manual calculations or byte-level estimates. These variations are expected and do not impact billing accuracy.
When services stop working
If your hosted services become unavailable, the cause can be either a system outage or an account-related issue. Here’s how to check both.
Check system status
Start by confirming whether there’s an ongoing outage or maintenance event:
- ArcGIS Online Health Dashboard: status.arcgis.com
- ArcGIS Location Platform Status: status.location.arcgis.com
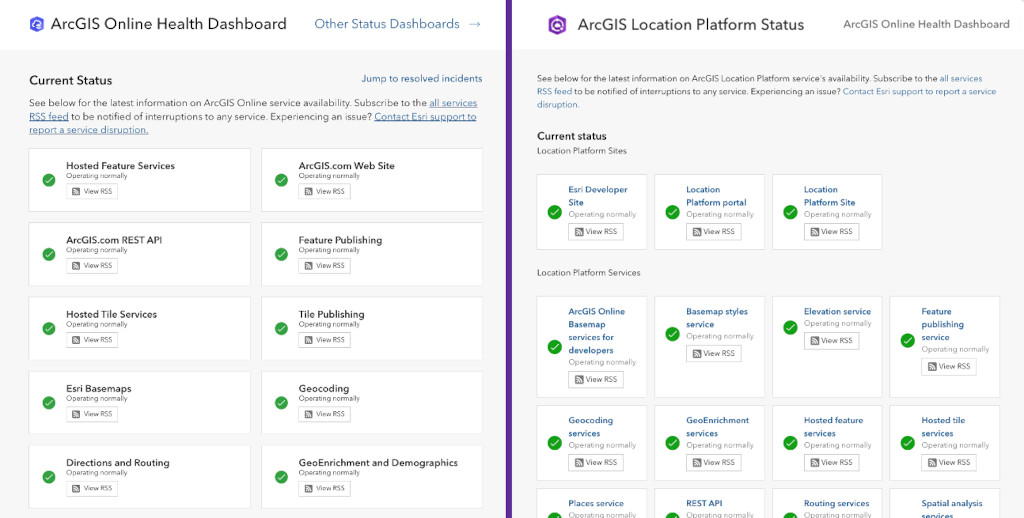
These dashboards show current service health, scheduled maintenance, and recent incidents that might affect availability.
Check your account status
If the dashboards report regular operation but your services are still down, review your account status. Access issues can result from billing limits or credit exhaustion.
- ArcGIS Location Platform:
- If pay-as-you-go is disabled, your account loses access to services that exceed the free tier limits (check this example).
- If a payment fails or the balance becomes negative, the account is suspended, and access tokens are denied until the issue is resolved.
- ArcGIS Online:
- When credits run out, the organization enters a restricted state, and service operations may be limited.
Next steps
Now that you have a clear understanding of how service usage works, you are ready to explore how to monitor and optimize consumption, manage budgets effectively, and make informed, data-driven decisions when using these services.
We hope this series has helped you clarify the differences between these services and products, and that you now have a solid understanding to make more confident decisions when choosing which one to use.
If you have any questions, feel free to join the conversation in our community forums:
- Esri Community > ArcGIS Online Questions
- Esri Community > Developers > ArcGIS Location Platform Questions
Or if you found something confusing or believe you’ve spotted an error or inconsistency in this article, reach out to us at developers@esri.com.
We would greatly appreciate it if you could consider sharing or engaging with the post on LinkedIn, Bluesky, or X if you found this article helpful and believe others in your professional network may benefit from it.
Thank you to everyone who contributed to the content of this article. You rock! Extra special thanks to Isaac Viel, John Foster, Todd Smith, and Kevin Gonzago.


Article Discussion: