If you’re developing coronavirus disease 2019 (COVID-19) apps, whether to hack together a novel visualization or to deploy your expertise and aid in the response efforts, Esri offers a suite of no-cost location services and SDKs that you can use in your solutions.
This blog introduces a few key services through ArcGIS for Developers—OpenStreetMap (OSM) basemaps and styles, authoritative reference data, and data hosting–in the context of a simple mapping app. With the exception of using these services to generate revenue or host over 200mb of data, they are available at no cost (more).
Get started
TL;DR (too long; didn’t read) these are the key links: create an account and a starter scaffolding tutorial
The first step is to create a free developers account. This account is used to manage map styles, host data, generate tokens for secure services, and more. Next, create the basic web app scaffolding by following this tutorial.
The remainder of this blog will show excerpts for a JavaScript web app however the linked tutorials will cover the same concepts for other programming languages and platforms.
Here’s the output (we updated the center to look over the US).
Select a basemap
TL;DR OSM and equal earth map galleries, styling and add to app tutorials
Next, let’s update the basemap. There are a variety of fast vector basemaps built from OSM data available here. These maps can optionally be styled to meet your creative aesthetic via this tutorial. My colleague John Nelson also published some amazing equal-earth basemaps—these better represent the globe when visualization population-based data like COVID-19 cases (learn why).
Once you choose a basemap, click on the item, grab the item ID from the URL, and follow this tutorial to add it to your app. In JavaScript, the core update to the scaffolding is:
// OSM gray vector basemap pulled from URL:
// https://www.arcgis.com/home/item.html?id=1932e7d4432d45dabc0d4d13109c1f09
var basemap = new Basemap({
  baseLayers: [
    new VectorTileLayer({
      portalItem: {
        id: "1932e7d4432d45dabc0d4d13109c1f09"
      }
    })
  ]
});

var map = new Map({
  basemap
});
Here’s the output.
Host and add your data
TL;DR upload data, style & popups, and add to app tutorials, service best practices
200mb of free vector data hosting, let’s take advantage! Here’s the tutorial to upload CSVs, GeoJSON, and other data sources either through the UI or by using Python. Once uploaded, ArcGIS creates a RESTful service that can be added to your app via this tutorial.
The service supports capabilities like editing, dynamic tiling, and spatial or statistical queries. These services can also scale to billions of requests a day, so check out this blog for essential management practices. In your app, the layer can also be styled (tutorial) and set to display data in a popup when clicked (tutorial).
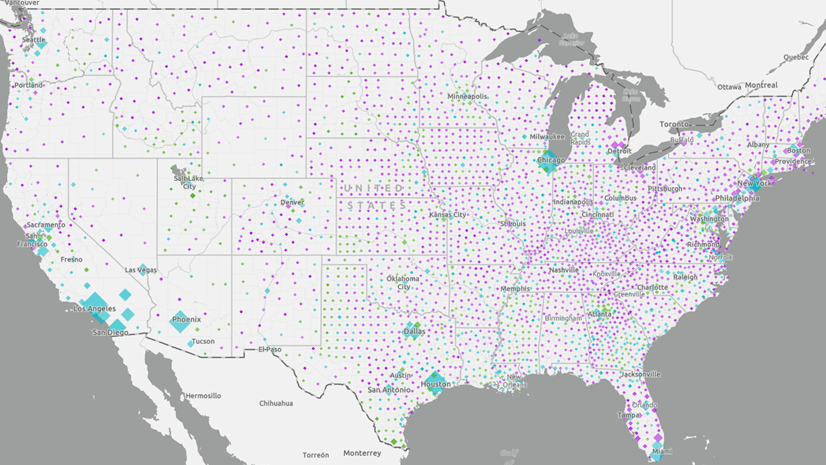
For demo purposes, let’s assume I owned and uploaded this Unacast social distancing dataset, the core update is:
// Unacast social distancing layer
// pulled from REST API link (bottom right) of item page
// https://www.arcgis.com/home/item.html?id=ab72fb3e9bf24d9594f0b942718bffeb
var layer = new FeatureLayer({
  url: 'https://services.arcgis.com/DO4gTjwJVIJ7O9Ca/arcgis/rest/services/Unacast_Latest_Available__Visitation_and_Distance_/FeatureServer',
  renderer: {
    type: 'unique-value',
    field: 'grade_distance',
    defaultSymbol: {type: 'simple-fill', outline: {color: 'gray', width: '0.1px'}},
    legendOptions: {title: 'Grade'},
    uniqueValueInfos: [{
      value: 'A',
      symbol: {type: 'simple-fill', color: '#0070ff', outline: {color: 'gray', width: '0.1px'}}
    }, {
      value: 'B',
      symbol: {type: 'simple-fill', color: '#bed2ff', outline: {color: 'gray', width: '0.1px'}}
    }, {
      value: 'C',
      symbol: {type: 'simple-fill', color: '#e6e600', outline: {color: 'gray', width: '0.1px'}}
    }, {
      value: 'D',
      symbol: {type: 'simple-fill', color: '#ffaa00', outline: {color: 'gray', width: '0.1px'}}
    }, {
      value: 'F',
      symbol: {type: 'simple-fill', color: '#e60000', outline: {color: 'gray', width: '0.1px'}}
    }],
  },
  popupTemplate: {
    title: "{county_name}",
    content: "Unacast's social distancing grade is {grade_distance}"
  }
});

var map = new Map({
  basemap,
  layers: [layer]
});
Here’s the output.
Note, instead of individually adding and styling layers, you can also use the Map Viewer in ArcGIS Online to author webmaps. The output webmap can then be added with one line of code. Here’s the webmap tutorial, style layers tutorial, and add a webmap tutorial.
Add authoritative data
TL;DR data sources and the same tutorials from above
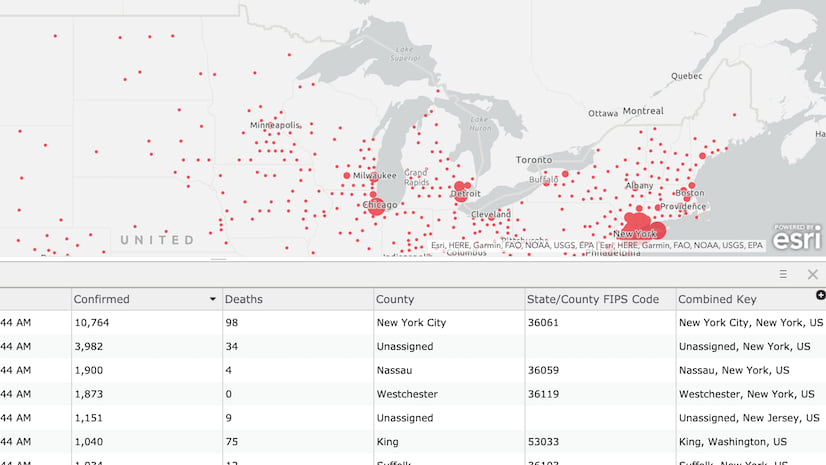
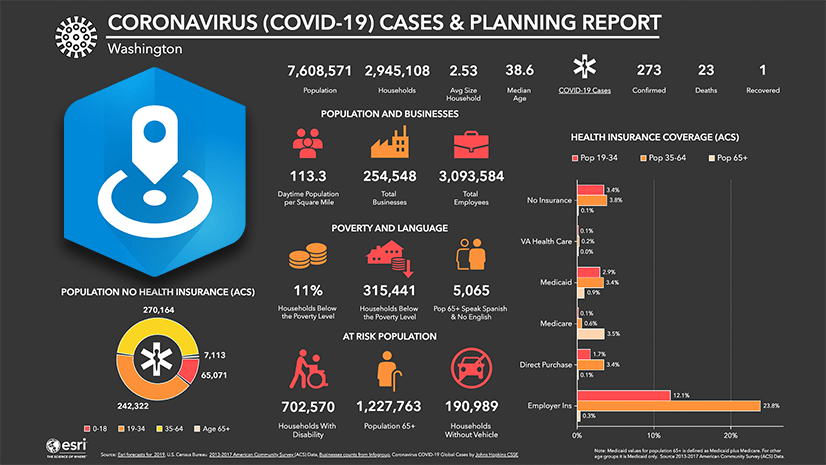
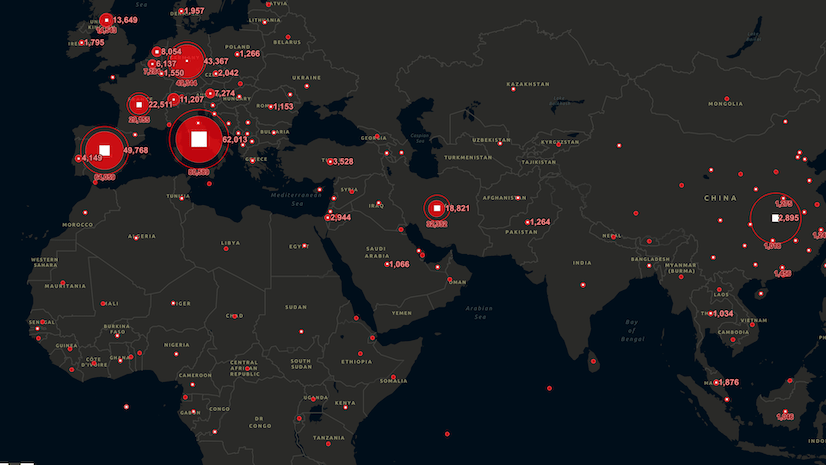
There are dozens of authoritative geospatial datasets sourced from the global GIS community and trusted partners made available as part of response efforts. These include the Unacast data from above, current COVID-19 cases from Johns Hopkins University, hospital beds from Definitive Healthcare, and more. You can explore the datasets here and follow the same tutorials from above to add it to your map.
Note, these datasets can add value in many workflows and don’t need to be called directly from a client app. You can also access the REST API directly (COVID-19 cases API) or use Python and Pandas to build out a data pipeline (guide).
Build the experience
TL;DR search and directions tutorials, additional features
The data and layers can be combined with other location services and analytical operations in your app to build an informative, compelling solution. Here are a variety of tutorials to add search and routing capabilities and insights into creating powerful visualizations.
For now, let’s just add a search widget for users to find locations (tutorial) and legend, but check out below for additional ideas. Here’s the core snippet:
var searchWidget = new Search({
  view
});
view.ui.add(searchWidget, 'top-right');

var legendWidget = new Legend({
  view
});
view.ui.add(legendWidget, 'bottom-right');
Here’s the full output.
Additional resources
And, there’s the final output! If you’re eager to dive in and learn more, here are a few more destinations I’d suggest checking out:
- Esri’s COVID-19 resources and ArcGIS for Developers resources pages
- Reference applications on Github – these highlight additional API capabilities and interactive experiences you could add to your apps (we love feedback or pull requests!)
- Configurable apps – if you need to quickly create an app or just don’t want to think about debugging, Esri also offers a variety of configurable app builders and templates
- Disaster response program – if you need additional resources or assistance, Esri is supporting public health agencies and other organizations with emergency GIS help
Development blogs and tutorials: All Developer Tutorials | Migrating from Google Maps | Smart mapping blog | Client-side queries blog
Cartography blogs: Mapping Coronavirus, responsibly | Improve Your COVID-19 Cases Map | Better colors for better mapping


Article Discussion: