Have your costs to display a map in your web app drastically increased with Google’s recent pricing changes? If so, you aren’t alone. This pricing update has driven many developers that were using the Google Maps API to explore web mapping alternatives and move to ArcGIS. There are a couple of reasons for this.
First, the ArcGIS API for JavaScript is a state of the art web mapping API with powerful developer tools for exploring data and creating visualizations in both 2D and 3D, widgets for building compelling user experiences, and client-side processing for creating interactive apps using the latest browser technology.
Second, with an ArcGIS Developer Subscription you can do a lot for free:
- Use of all of Esri’s APIs and SDKs for web, native, and mobile platforms
- 1,000,000 basemaps and geosearch transactions per month
- Credits towards generating routes
- Unlimited non-revenue generating apps
- Unlimited users
- Access to a wide selection of rich content and services hosted in ArcGIS Online
- Style basemaps and manage your map content
- Host, query and analyze geographic content
If you’re ready to migrate your web app from the Google Maps JavaScript API to the ArcGIS API for JavaScript, here’s a quick overview on some of the basic concepts.
Get going developing with the API
Get started by signing up for the ArcGIS Developer Program at no cost. This will give you access to everything listed above, plus quite a bit more (see the Developer website to learn more).
To load the Google JavaScript Maps API you reference the API and include your Google API key like this:
<script async defer
   src="https://maps.googleapis.com/maps/api/js?key=YOUR_API_KEY&callback=initMap">
</script>
With the ArcGIS API for JavaScript you won’t need an API key; you can simply reference the API and stylesheet like this:
<link rel="stylesheet" href="https://js.arcgis.com/4.8/esri/css/main.css">
<script src="https://js.arcgis.com/4.8/"></script>
Display a map
Here’s how you initialize a new map with Google:
const map = new google.maps.Map(document.getElementById('mapDiv'), {
  mapTypeId: 'roadmap',
  center: { lat: 32.7353, lng: -117.1490},
  zoom: 12
});
With ArcGIS, a new map is initialized in this way. Notice that you create both a map and a view. A view enables separation between the map data from visualization of the data in either 2D or 3D (or both).
require(["esri/Map", "esri/views/MapView"], function(Map, MapView) {
  const map = new Map({
    basemap: "streets-navigation-vector"
  });

  const view = new MapView({
    container: "viewDiv",
    map: map,
    zoom: 12,
    center: {
      latitude: 32.7353,
      longitude: -117.1490
    }
  });
});
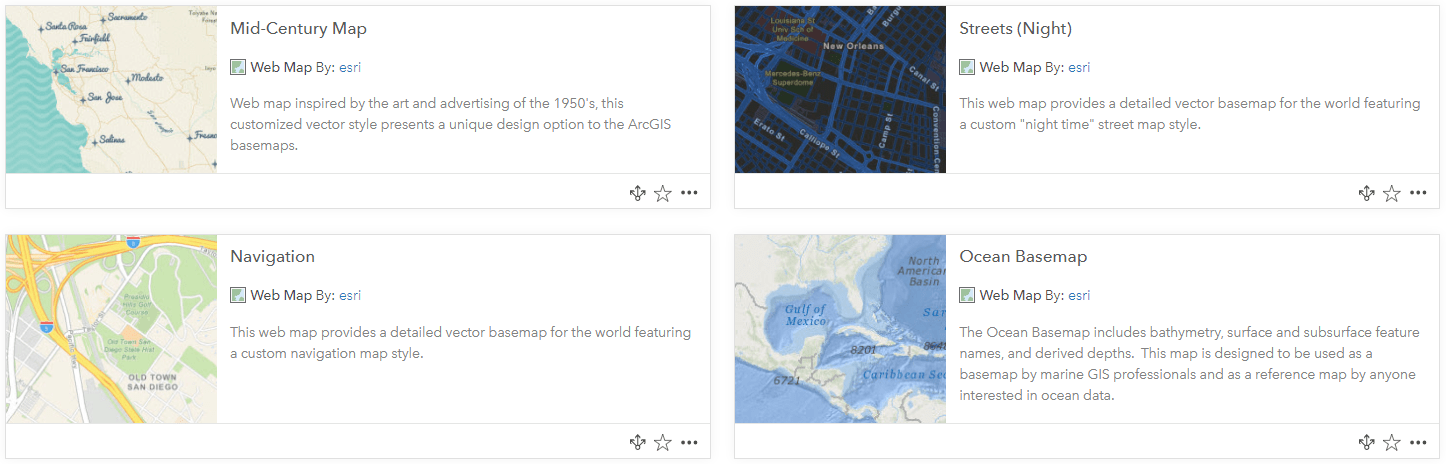
This code will create a map with Esri’s World Navigation vector basemap. If you’d like, you can choose another basemap from the ArcGIS Online basemaps such as satellite imagery, topographic, dark gray canvas, or another basemap you have access to.
Adding a marker
Adding a marker with Google is done in the following way:
const marker = new google.maps.Marker({
  position: { lat: 32.7353, lng: -117.1490 },
  title: "San Diego Zoo",
  map: map
});
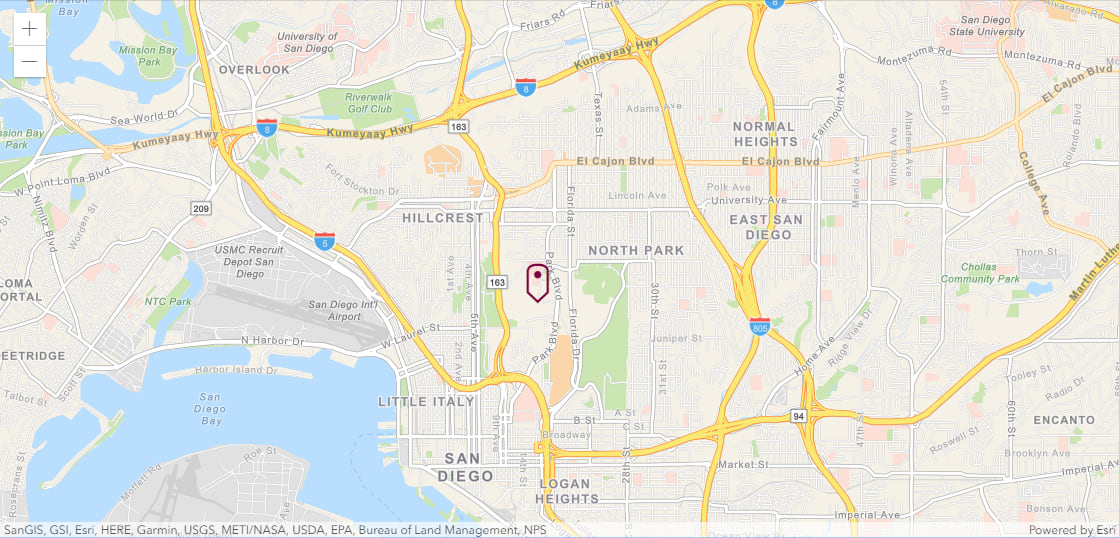
To add a marker with ArcGIS, a new graphic is added to the view’s graphics collection.
view.graphics.add({
  symbol: {
    type: "simple-marker",
    color: "cyan"
  },
  geometry: {
    type: "point",
     longitude: -117.1490,
     latitude: 32.7353
  }
});
The code above creates a cyan colored circle “simple marker” symbol, but there are more ways in which you can symbolize your marker. For example, you can select a symbol from Esri Icon Font. Here is an example of using a map pin icon:
view.graphics.add({
  symbol: {
    type: "text",
    color: "#7A003C",
    text: "\ue61d", // esri-icon-map-pin
    font: {
      size: 30,
      family: "CalciteWebCoreIcons"
    }
  },
  geometry: {
    type: "point",
    longitude: -117.1490,
    latitude: 32.7353
  }
});
In ArcGIS, a more dynamic option for selecting a symbol is using your data’s attributes to drive the color, size, and opacity of the symbol. To see this in action, have a look at this sample showing how you can create graphics from GeoJSON earthquake data, and dynamically set the size of each graphic’s symbol according to the magnitude of the earthquake.
Use a popup
Google’s InfoWindow is used for displaying content in a popup window, and is attached to a marker in this way:
const map = new google.maps.Map(document.getElementById("mapDiv"), {
  mapTypeId: "roadmap",
  center: {
    lat: 32.7353,
    lng: -117.1490
  },
  zoom: 14
});

const marker = new google.maps.Marker({
  position: {
    lat: 32.7353,
    lng: -117.1490
  },
  title: "San Diego Zoo",
  map: map
});

const contentString = "<h1>San Diego Zoo</h1>" +
  "The <a href='http://zoo.sandiegozoo.org/'>San Diego Zoo</a> " +
  " in Balboa Park houses over 3,700 animals.<p><p>" +
  "<img src='https://visitoceanside.org/wp-content/uploads/2013/01/SanDiegoZoo.jpg' alt='San Diego Zoo' height='150'>";

const infowindow = new google.maps.InfoWindow({
  content: contentString
});

marker.addListener('click', function() {
  infowindow.open(map, marker);
});
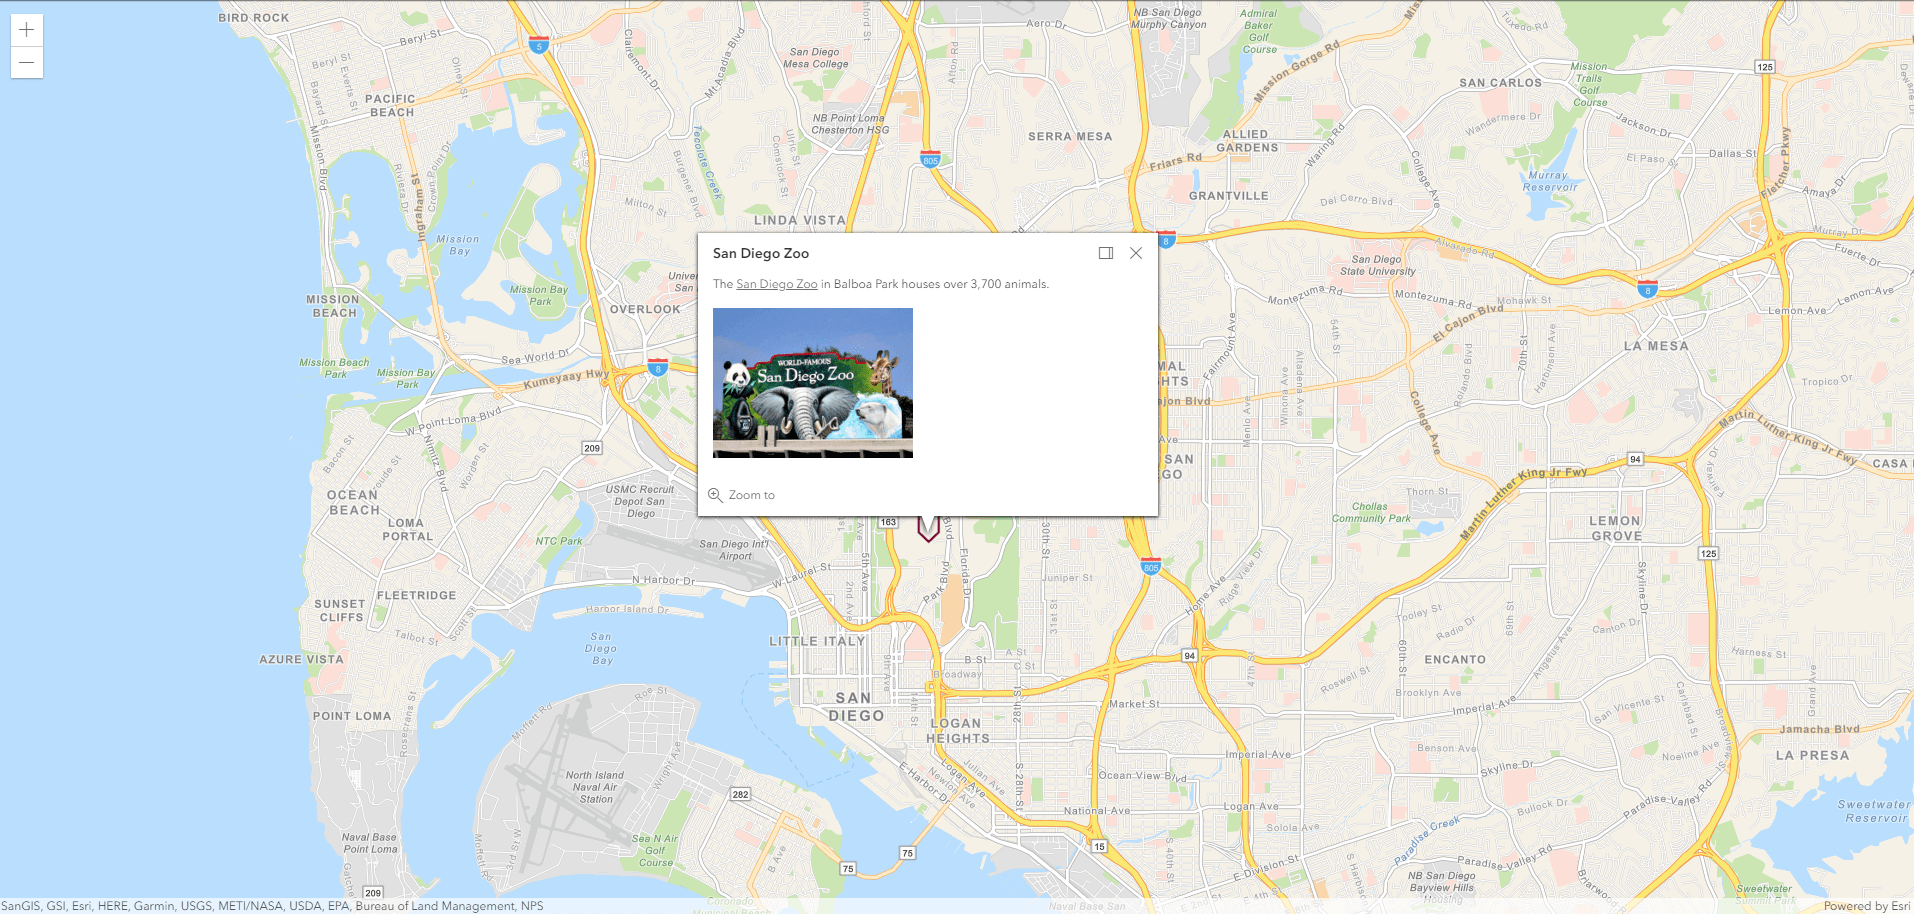
You can add a popup with the ArcGIS API for JavaScript by creating a popup “template.” Templates define the content of the popup. Here are all steps combined to create the map and view, add a marker with a pin icon, and attach a popup:
require([ "esri/Map", "esri/views/MapView" ], function(
  Map, MapView
) {
  const map = new Map({
    basemap: "streets-navigation-vector"
  });

  const view = new MapView({
    container: "viewDiv",
    map: map,
    zoom: 12,
    center: {
      latitude: 32.7353,
      longitude: -117.1490
    }
  });

  const contentString = "The <a href='http://zoo.sandiegozoo.org/'>San Diego Zoo</a> " +
    " in Balboa Park houses over 3,700 animals." +
    "<p><p><img src='https://visitoceanside.org/wp-content/uploads/2013/01/SanDiegoZoo.jpg' alt='San Diego Zoo' height='150'>";

  view.graphics.add({
    symbol: {
      type: "text",
      color: "#7A003C",
      text: "\ue61d", // esri-icon-map-pin
      font: {
        size: 30,
        family: "CalciteWebCoreIcons"
      }
    },
    geometry: {
      type: "point",
      longitude: -117.1490,
      latitude: 32.7353
    },
    popupTemplate: {
      title: "San Diego Zoo",
      content: contentString
    }
  });
});
View this app in codepen.
For fun, you can play around with the same app in 3D by simply using a “SceneView” rather than a “MapView.” See the code and live 3D app here.
Next steps & more resources
Check out the following tutorials on migrating web apps from Google to ArcGIS:
There are a variety of resources for learning about the ArcGIS API for JavaScript and maximizing your productivity when building your web apps:
- Explore hundreds of samples in a live sandbox for playing around with the code
- A helpful guide focused on key topics about developing with the API
- Searchable API reference.
- ArcGIS API for JavaScript dev labs, which are step by step tutorials for learning how to develop with the API, for example:


Commenting is not enabled for this article.