This blog article was last updated on December 8, 2023
Business users and geographic information system (GIS) professionals frequently access Esri Demographics through ArcGIS Business Analyst Web App and ArcGIS Living Atlas of the World. But did you know that you can also access Esri demographic data through ArcGIS for Microsoft 365?
Esri’s ArcGIS for Microsoft 365 product suite connects today’s global organizations with one of the most powerful business tools available—Microsoft Excel. With the ArcGIS for Excel add-in, you can gain access to Esri’s demographic data for deeper insights using spreadsheets, Excel functions, and maps within the context of a Microsoft workflow.

Questions You Can Answer with Esri’s Demographic Data and ArcGIS for Excel
Data enrichment, visualization, collaboration, and access to ArcGIS Online or ArcGIS Enterprise are some of the advantages of using the ArcGIS for Excel add-in. Coupled with Esri’s demographic data, you can answer questions like these:
- Where are my best or most loyal customers?
- What communities should my organization invest in to build our next commercial property?
- What is the dominant segment within a specific block group, ZIP code, or community, and how has this population changed over time?
Ideal for Industries That Require a Deeper Understanding of Users, Customers, or Constituents
Demographic data from Esri is intended to eliminate the guesswork to help you make data-driven decisions with confidence. ArcGIS for Excel and Esri’s demographic data are ideal for the following:
- Retailers can use demographic data within Excel to provide context and other information about their own data.
- Real estate professionals can help their clients unearth the optimal neighborhoods and communities in which to invest.
- Health-care professionals or health-care retailers can use demographic data to understand more about who lives in a specific community and better serve that community.
- Urban planning professionals can get insights about diverse communities and their unique needs.
How to Use ArcGIS for Excel for Greater Demographic Insights
Eager to see how Esri’s demographic data and ArcGIS for Excel can work for you? See the following for an example using the ArcGIS for Excel ENRICHBYGEOGRAPHY function.
Consider this sample problem:
- A GIS user has been asked by the CEO at their electric vehicle (EV) startup to determine the appropriate San Francisco ZIP codes for where to invest and to show demand for EV vehicles.
- The user has already confirmed that Generation Z is the appropriate target group for this effort.
Here are data variables to analyze:
- 2023 total population
- 2023 Generation Z population
- 2023 per capita income
After you have received ArcGIS for Excel from the Windows Apps – Microsoft Store, open an Excel Worksheet.
Step 1: On the Excel ribbon. Click the ArcGIS tab then click Show Map.

Step 2: Click FUNCTION BUILDER > GEOENRICHMENT FUNCTIONS > ENRICHBYGEOGRAPHY to pull in demographic data. The demo dataset has three fields: ID, NAME and STATES. In the ID column, SF Zipcodes are listed.

Step 3: Under Set Parameters select AREA_ID, GEOGRAPHY_LEVEL_ID, and the appropriate data variables (ANALYSIS_VARIABLES). Click UPDATE and apply to all cells. In this example, the selected variables are the following:
- 2023 total population
- 2023 Generation Z population
- 2023 per capita income

Step 4: Visualize the ZIP codes and demographic data on a map:
-
- On the Excel ribbon. Click the ArcGIS tab then click ‘Show Map.’
- Select ‘+Excel’ to render polygon layers.
- Select the ‘Layers’ icon (on left)>Layer options
- Select the ‘Labels’ icon on left.

Step 5: Under ‘Location Types‘ select the ‘Geographic Data‘ layer:
-
- Search ‘US Zip code‘ and select ‘United States ZipCode Boundaries‘ in the ‘Select Geographic Layer‘ UI
- Click “+” to add ‘United States ZipCode Boundaries‘
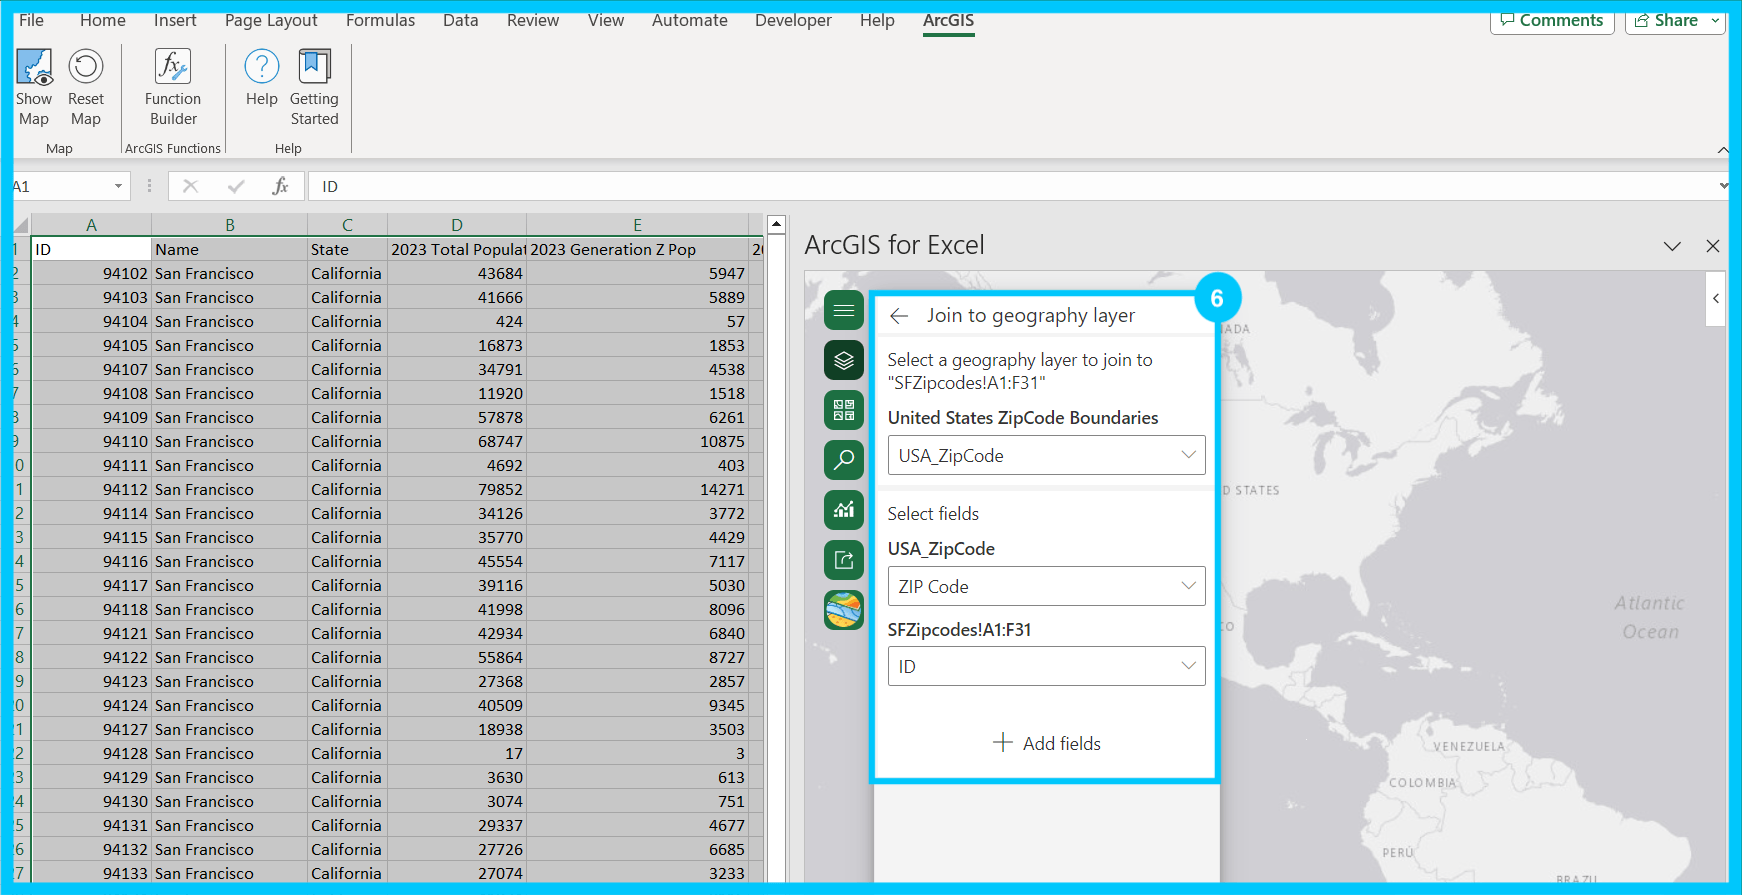
Step 6: Join ArcExcel field and ArcGIS layer:
-
- Select USA_ZipCode under the ‘United States ZipCode Boundaries’ dropdown.
- Select ArcGIS layer field name ZIP Code in the ‘USA_ZIPCODE’ dropdown.
- Select Excel ID under SF_Zipcodes.
- Click ‘Add to Map‘
Step 7: Apply labels and ‘Style by color‘ styling to clearly distinguish the appropriate data on the map.
Final Step: View your map:

Result:
ZIP codes 94110, 94112, and 94080 have the highest number of Generation Z residents.
Click here to watch the demo.
ArcGIS for Excel: Connecting You with Demographic Data You Can Trust
Esri Demographics is built by a team of demographers, statisticians, scientists, and data experts who vet and test data from multiple sources and providers. Whether you prefer to analyze demographic data with spreadsheets or on a map, you have options depending on where and how you work. ArcGIS for Excel can seamlessly integrate demographic data, maps, and traditional business data to help you make decisions that positively impact your work.
Esri Demographics Resources
- Esri Demographics Product Overview
- What Is Esri Demographics Data?
- Beginner’s Guide to Esri Demographics
- Get Started with Esri Demographics
- What’s New in Esri Demographics and ArcGIS Living Atlas of the World
- Esri Demographics Resources and Tutorials
- Esri Reports Now Available for Purchase from the Esri Store
ArcGIS for Excel Resources
- ArcGIS for Microsoft 365 Product Overview
- Learn about ArcGIS for Microsoft 365 and ArcGIS for Excel
- ArcGIS for Excel Community Page
- Map and Assess Accessible Crosswalks Using ArcGIS for Excel
- Get Started with ArcGIS for Microsoft 365
- ArcGIS for Excel Tutorial
- Use the Function Builder
- ArcGIS for Excel Functions


Article Discussion: