Have you ever wondered about the common behaviors of the people in your city? You may wish to intricately understand customer behaviors to adapt your business model based on location. If this is the case, then Esri Tapestry Segmentation is a need-to-have dataset that can reveal the unique lifestyles and behaviors of select populations.
What is Esri Tapestry Segmentation?
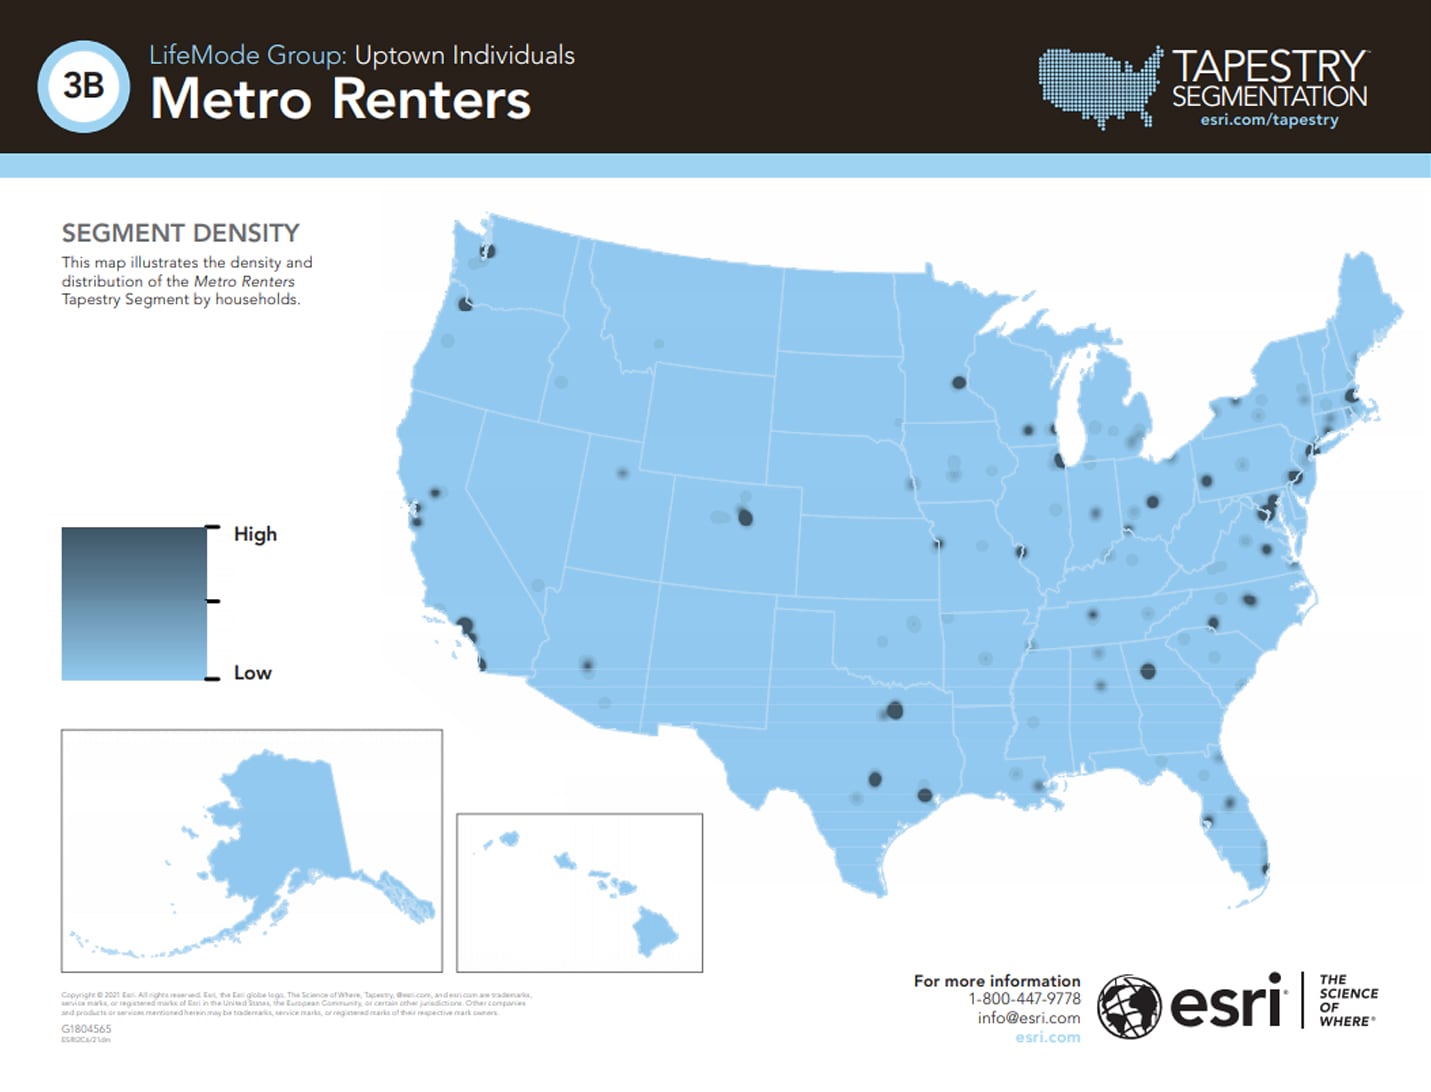
Esri Tapestry Segmentation classifies US neighborhoods into 14 unique LifeMode groups. These groups are then further classified as 67 different consumer-segments with commonly shared traits. For example, Metro Renters – Tapestry Segment 3B, is within LifeMode Group: Uptown Individuals.
Tapestry Segmentation delivers an overview of a variety of demographic and behavioral characteristics. The data can provide insight on important consumer variables, such as age, education level, the likeliness of car or home ownership, a consumer’s willingness to buy or purchase certain products, and their overall economic purchasing power. You can learn how consumers like to receive information – whether through online ads, print mediums, or civic events. You can also see fundamental differences within communities, depending on where consumers are located within an area.

Lifemode Group 3 – Uptown Individuals
Includes Tapestry Segments: 3A Laptops and Lattes, 3B Metro Renters, and 3C Trendsetters
-
- Young, successful singles in the city
- Urban denizens, partial to city life, high-rise apartments, and uptown neighborhoods
- Adventurous and open to new experiences and places
- Green and generous to environmental, cultural, and political organizations
- Internet dependent, from social connections to shopping for fashion, tracking investments, making travel arrangements, and watching television and movies
See data in action.
To help you better understand how the data works, we’ve put together the Know Your NeighborhoodSM app to explore the data. To use this app, you’ll simply put in your ZIP code, then watch as insights are revealed about the populations in your neighborhood. In this experience, you’ll see Tapestry Segmentation side-by-side with Esri’s other datasets, such as Updated Demographics, Consumer Spending, and Market Potential data. The blog below can help you to better understand what the Know Your Neighborhood app is telling you and how to get started using Esri Data in your day-to-day business.
Try the app

Who is Using Tapestry Segmentation?
It may come as no surprise to you that many businesses in the Fortune 1000 choose Esri’s Tapestry Segmentation to drive results in all facets of their business. Organizations large and small use Tapestry to perform persona research on their consumers. In turn, these organizations can develop better products and services to meet consumer demand. Additionally, for agencies and organizations looking to develop direct-to-consumer marketing, effective communication strategies, and loyalty programs, Tapestry Segmentation can indicate the characteristics of a neighborhood that will influence the success of a campaign – including buying power, brand interest, and personal values.
For the leading, national retail-only real estate service provider, The Shopping Center Group (TSCG), Esri Tapestry Segmentation gives traditional demographics personality. Tapestry allows the company to bring together who the consumer is and where they are. TCSG’s deep knowledge of hyper-local markets is translated as location intelligence to TSCG brokers and their clients. The information received from Tapestry is valuable and competitive, presenting opportunities that may otherwise be overlooked.
Similar to TSCG, the United States Census Bureau understood that diverse populations have different personalities and preferences. In order to complete the first-ever digital collection of US Census data in 2020, the team needed to plan for success in response rates. By using Tapestry Segmentation and overlaying the data onto maps, the Census Bureau was able to perform deep analysis to find outreach opportunities, just as a corporate marketing team might. Armed with insight into the profiles of each segment, the Bureau customized outreach to hard-to-count populations during the 2020 Census.

Why is Tapestry a unique segmentation system?
Esri Tapestry Segmentation combines traditional demographic, psychographic, behavioral, and geographic market segmentations all into one easy-to-use consumer segmentation system. Tapestry provides deep insight into the lifestyles and behaviors of diverse locations, while offering a comprehensive view of the demographic populations within your markets. A system built with answers to who, what, where, and why – Tapestry Segmentation can inform how to approach your biggest business challenges.
Tapestry is built using a unique combination of demographic and consumer data, paired with clustering methods and the latest data mining techniques. Esri’s data scientists work to update the data annually, using the latest spatial boundaries, to always keep data refreshed and accurate. The proprietary combination of rich datasets and geography, results in multi-level 360-degree views of the consumer from national buying patterns, all the way down to community block groups.
Add data to your apps and dashboards
Adding Tapestry Segmentation into your apps and dashboards has never been easier. Esri offers Tapestry in a variety of formats, including prepared databases. Esri’s data team works to remove the pain of looking for and preparing data, making Tapestry Segmentation available in CSV, excel, and FGDB. Your teams can easily analyze Tapestry Segmentation data to develop consumer models that inform.
Additionally, the recent launch of Esri’s ArcGIS Platform enables you to quickly add prepared Tapestry data into your applications utilizing our REST API and ArcGIS GeoEnrichment Service. With this, you can easily boost your existing customer data management systems and incorporate valuable consumer data to keep your teams informed. ArcGIS Platform offers a pay-as-you-go model that can help you to quickly join your data to Esri’s based on location to develop meaningful and rich consumer data.
Access in app with ArcGIS Business Analyst
If you are looking for a location intelligence tool to explore Tapestry, ArcGIS Business Analyst may be right for you. ArcGIS Business Analyst includes Tapestry Segmentation as a part of the rich-software data suite, alongside Updated Demographics, Consumer Spending, and Market Potential data. As an industry-leading analysis tool for market planning, site selection, and consumer segmentation, ArcGIS Business Analyst can help you to make intelligent business decisions in app.
Since the data is already built into the software, you can access Tapestry Segmentation and quickly run analysis. You can also build reports and infographics to share your analysis results with others. A free trial is available to explore the possibilities of ArcGIS Business Analyst and Tapestry Segmentation. With an easy step-by-step introductory guide and lessons to get you started, you’ll be running data-driven analysis in no time.

Purchase a ready-to-use report
If running analysis is not your style and you want the facts without the work, we can deliver a location-specific Tapestry Segmentation report to you. All you need to do is select your area of interest and you will instantly get a Tapestry Segmentation breakdown for your area. With Esri Reports, you’ll be able to see what Tapestry segments are most prominent based on community populations. You’ll also be able to compare your area of interest to the overall US average to understand how the area ranks nationally.
Explore other data from Esri and our partner community
Whatever your data needs may be, Esri can help. From proprietary demographic data that we build in house to enriched datasets that can answer your questions about the people and places that matter most to you. Esri’s goal is to give you more time for analysis, while spending less time looking for and preparing data.
We also have an incredible partner community that continues to raise the bar alongside Esri to provide you the latest innovations in location data. To learn more about the data available from Esri and our partners, check out our product portfolio.

Commenting is not enabled for this article.