
November 26, 2019 |
February 11, 2021
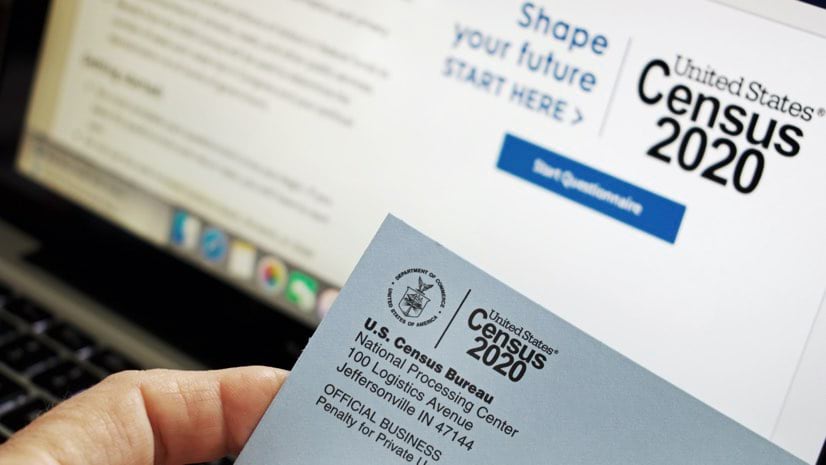
The US Census Bureau faced unimaginable challenges with its 2020 population count, given the public health measures brought on by the pandemic. The typical household visits were curtailed for a time until infection spikes settled and accommodations were made.
“In the middle of this, we had to decide whether our enumerators should wear masks” said Nancy Bates, senior researcher for Survey Methodology at the US Census Bureau. “We conducted a survey asking, ‘If an enumerator comes to your door wearing a mask, would you be more likely to respond, less likely, or wouldn’t it make a difference?’ We found that when combined, the majority said they would prefer a mask or it wouldn’t make a difference.”
This is indicative of the analytical approach the Census Bureau takes to assess every task, set standards, and fine-tune processes to increase efficiency. For the first time this year, digital submissions were allowed via the internet and the Census Bureau used location intelligence and lifestyle segmentation data to guide its outreach.
The US Constitution mandates a count of every person in every state and territory every 10 years. The results become a key metric for federal funds distribution. The data influences the make-up of election districts and describes the US population at every geographic level.
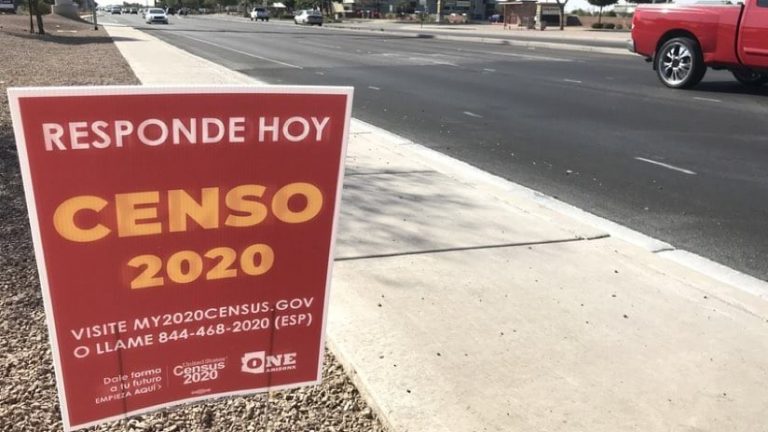
Despite the importance of the data, the Census Bureau experiences low response rates from certain populations throughout the country, which can have a significant impact on government and commercial services people receive. The Census Bureau combats this complacency by placing ads tailored to local interests, which are determined by using location analytics. It’s part of a quest that marketing professionals understand all too well: reaching an elusive audience.

Starting in 2020, as part of its digital transformation, the Census Bureau studied how to improve its reach. Census Bureau staff conducted an advertising test in Savannah, Georgia, in 2015. They evaluated whether online forms improved response rates and assessed the best mix of ads and ad channels for targeting hard-to-reach residents. The results of the test were detailed in a research report, Viewing Participation in the US Census through the Lens of Lifestyle Segments.
The primary focus was on gaining insight into the makeup, location, and behavior of hard-to-survey populations to improve response rates among those groups. To begin that analysis, bureau staff turned to a technique popularized by marketing executives—lifestyle segmentation data powered by a geographic information system (GIS).
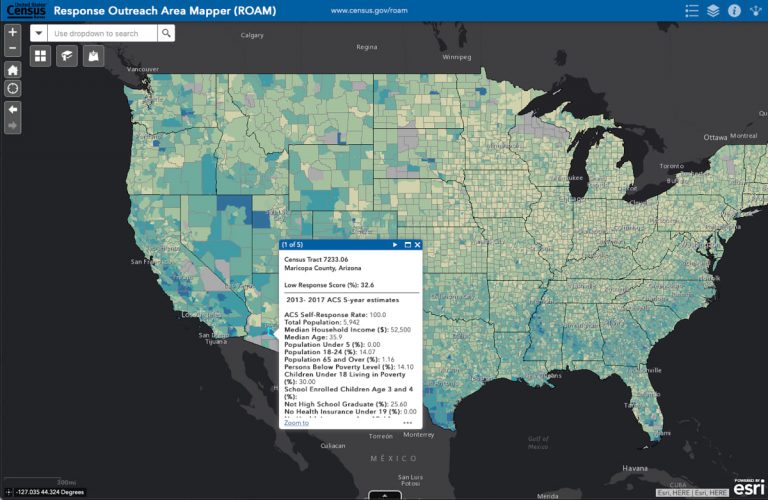
First, Census Bureau officials used location intelligence to derive a low response score, a metric that guided further analysis of areas determined to be the hardest to count. Then those areas were mapped and overlaid with data of each area’s lifestyle segments. Each segment within Tapestry Segmentation has distinct socioeconomic and demographic profiles that also reveal psychographic constructs, including participation in faith-based organizations and attitudes on arts and culture—important variables when marketing to these groups.
Once they had analyzed and correlated nonresponders to these lifestyle segmentation groups, Census Bureau staff could perform deeper analysis to find outreach opportunities, just as a corporate marketing team might.
Using the location intelligence generated by GIS, the Census Bureau correlated areas of historically low census response with the locations of various population segments to identify segments that most needed outreach. The six population segments with the lowest participation rates had similar characteristics—they were renters; single-person households; and people with high mobility, low education, low income, and limited fluency in English.
Those segments covered a range of lifestyles and socioeconomic conditions:
Dorms to Diplomas (22.7% response rate): With a median age of 21.5, these youngsters live in neighborhoods with a mix of dorms and on-campus/off-campus housing that caters to young renters.
City Lights (31.3% response rate): This group earns above-average incomes but lags the nation in net worth. Its median age is 38.8.
Young and Restless (41.5% response rate): This is a highly mobile group with a median age of just under 30, populated with people beginning careers and changing addresses frequently.
Modest Income Homes (44.8% response rate): The labor force participation rate for this group is just 50 percent, with an income of less than half the US median. Most households rely heavily on public transportation.
Metro Fusion (45.6% response rate): Single-parent and single-person households account for more than half of this group, with a median age of 28.8 and median household income of $33,000.
City Commons (46.5% response rate): Nearly one-quarter of people in this group receive public assistance or social security benefits. They typically live in large cities and rent apartments in mid-rise buildings.
Once Census Bureau staff had correlated nonresponders to these lifestyle segments (or LifeMode) groups, they could perform deeper GIS analysis to find outreach opportunities. Its report states the following:
Within LifeMode groups, we can drill down to individual segments to obtain even more nuanced and granular understanding that can be used in developing messages and to tailor delivery.
Armed with insight into the profiles of each segment, the bureau customized outreach to difficult to track down audiences during the 2020 Census.
“We met weekly with VMLY&R [the agency that secured the Integrated Communications Contract for the 2020 Census campaign in August 2016] to discuss the memo they prepared that showed exactly where segments were under- or over-reporting in terms of self-response,” Bates said. “We then drew on mitigation plans to get self-response rates to where we wanted them to be.”
Deeper knowledge of lifestyle segmentation groups helped Census Bureau staff detect patterns in how people respond to marketing and how they might prefer to complete the census form. Direct mail, including flyers and cards touting the web address of the online census form, drove most of the web traffic during the Savannah test. As expected, there were anomalies. Among people of the Modest Income Homes segment, for instance, traditional television and radio advertisements drove a disproportionately high percentage of web responses:
Two segments, City Commons and Modest Income Homes, were the least likely to select the web for submitting their responses, averaging 54 percent. In contrast, the Young and Restless segment was about average with 70 percent choosing the web as mode of response. Dorms to Diplomas, which had the lowest participation rate, had the fifth-highest web response rate at 77 percent—in line with attitudinal characteristics of this younger, tech-savvy segment.
An enormous volume of political advertising and the emergence of the COVID-19 pandemic and its public health and economic fallout caused the Census Bureau to move quickly to adapt to market dynamics and increase its paid media investment. Lessons learned from the Savannah test helped staff do this effectively.
Census Bureau workers used digital marketing to reach more people at higher frequency than was possible in 2010. A heavier digital imprint boosted participation among low-responding segments through search-engine-based digital ads and Facebook posts. In the Savannah test, seniors responded at the highest rate to search engine ads (more than 80%), and singles responded the most to Facebook ads (more than 30%). These proclivities helped guide targeted ads.
“Some of the segments are really small, such as Student and Military Communities that make up just 2 percent of the US population,” Bates said. “But knowing where those communities are helps us target their interests.”
A metrics-driven marketing strategy helped improve 2020 Census response even under the year’s extraordinary circumstances. The Census Bureau’s digital transformation—including the application of GIS to gain location intelligence on population segments with typically low response rates—empowered census staff to craft outreach based on lifestyle segmentation data. Ultimately, this modern approach supported a successful 2020 Census count even during a pandemic.
Learn more about psychographics and gain insights into America’s changing population.

November 26, 2019 |
February 1, 2019 |

October 27, 2019 |