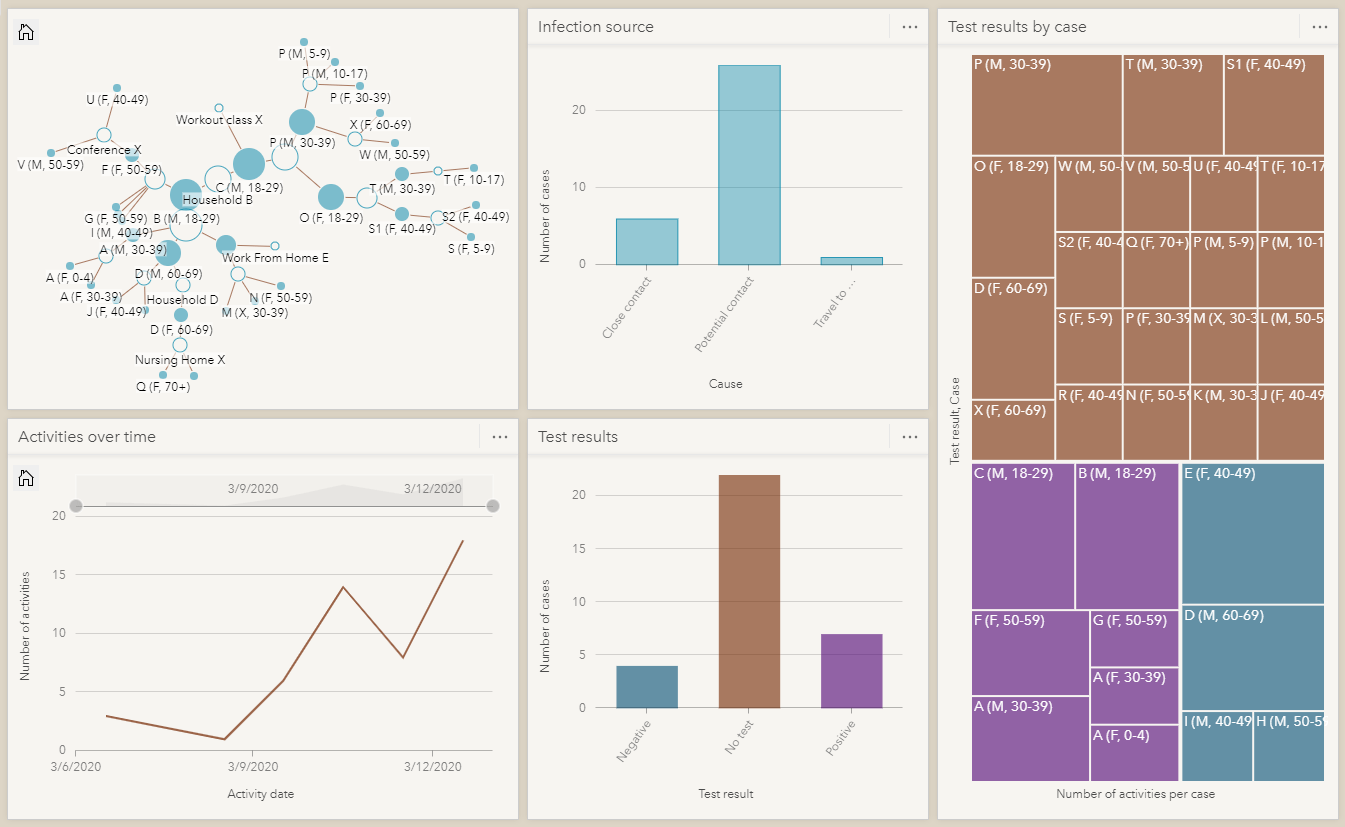
The COVID-19 pandemic has impacted the world at an unprecedented scale. Many experts view contact tracing as one of the solutions to help get the pandemic under control. The new Learn ArcGIS lesson, Track virus spread with ArcGIS Insights, uses link analysis to perform contact tracing on a fictional community facing an infectious disease outbreak.
In this lesson, you will create and configure a link chart to visualize the relationship between potential cases. You will also be guided through steps to interpret the contacts and make decisions about which cases require further action, like testing or isolation.

Platform: ArcGIS Insights
Time: 50 minutes
Level: Beginner


Article Discussion: