ArcGIS Insights

Visualize global COVID-19 trends in ArcGIS Insights

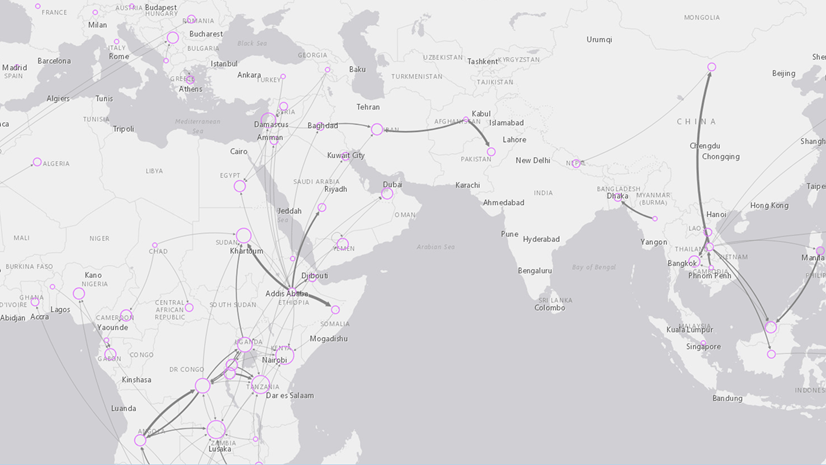
The COVID-19 pandemic has impacted the world at an unprecedented scale. The new Learn ArcGIS lesson, Visualize global COVID-19 trends in ArcGIS Insights, uses data from the European Centre for Disease Prevention and Control to create an overview of global COVID-19 cases.

In this lesson, you will create maps and charts that will allow you to visualize the spatial and temporal trends in COVID-19 cases globally. You will also learn cartographic principles that will help you to create effective and responsible maps for COVID-19.

Overview of the global COVID-19 pandemic
An overview of the global cases and deaths from the COVID-19 pandemic, using data from August 29, 2020.

Platform: ArcGIS Insights

Time: 1 hour

Level: Beginner

About the author

Vicki Lynn Cove is a documentation writer for Map Viewer analysis and ArcGIS Insights at Esri's Research and Development Centre in Ottawa, Canada. She has a background in biology, English literature, and GIS. In her spare time, Vicki Lynn enjoys fibre arts, playing her guitar, and the outdoors.

Connect:
0 Comments
Inline Feedbacks
View all comments

Next Article

Engaging Volunteers for a Cause

Read this article