The demand for 3D data is driving how people think about the next steps they’ll take with GIS, and we’re working to improve that experience and make these actions more approachable. With the latest ArcGIS Online release, Scene Viewer has new capabilities that you can use today to make useful scenes and applications with this data. These improvements address aspects of the user experience with Building Scene Layers, 3D Object Scene Layers, and Integrated Mesh Scene Layers. Try these with tools with your data today, and if you don’t have a building scene layer or integrated mesh scene layer accessible, try it out with our example data.
Building Explorer Improvements
The Building Explorer provides an intuitive interface to navigate the complexities of building data, and to be able adequately pick out the components you’d like to focus on. Not only can you select which disciplines and categories you’d like to make visible, but you can select building floors you’d like to make visible.
Improved Floor Picker
A new experience added to the Floor Picker is that floors below the selected floor are now semi-transparent to help orient you to the overall building shape. It’s a great way to make sure you’re able to focus on a specific floor and still provide some guidance about where that floor in in the overall building.

Construction Phase Filter
ArcGIS Pro can utilize Revit as a data source and publish a Building Scene Layer for use in web scenes. A common practice in Revit is to manage phases of work representing a distinct period in the life of a project. Building Scene Layers contain this Revit attribute data, and now the Construction phases user interface in Building Explorer enables users to select and filter specific phases of that building project life.
Draping to Integrated Mesh
It’s amazing to think of the potential for mapping with drones and how it’s possible support special events, construction project areas and campuses with 3D information products that provide a timely and realistic view of the area of interest. Drone2Map on your laptop or SiteScan in the cloud will process drone imagery and develop an integrated mesh scene layer package that can be published and overlaid with operational data. Integrated Mesh is an increasingly common data type that is typically derived from photogrammetric sources and optimized for streaming in web scenes as a scene layer.
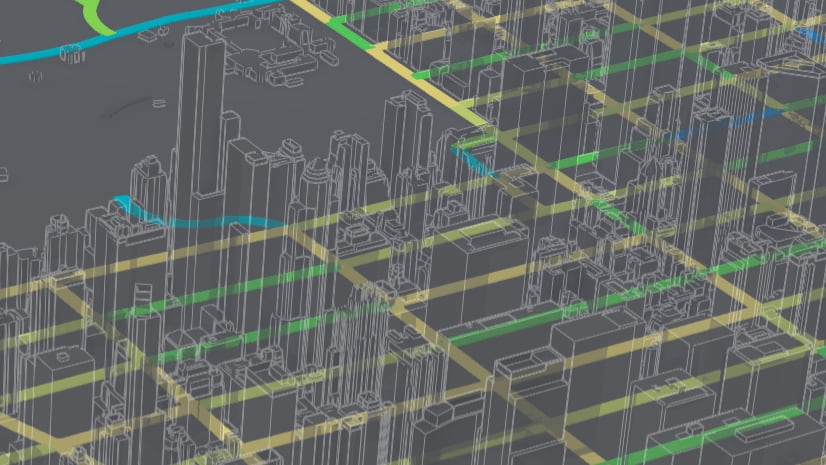
To drape point, line or polygon feature services over the integrated mesh scene layer, simply set its elevation value to “On the ground”. Scene Viewer will now drape 2D points, lines and polygon feature layers as if it was the ground, and this provides a method to directly ‘mark up’ integrated mesh with feature layers. In this example, integrated mesh produced by Drone2Map on a construction site is annotated with polygon feature services.

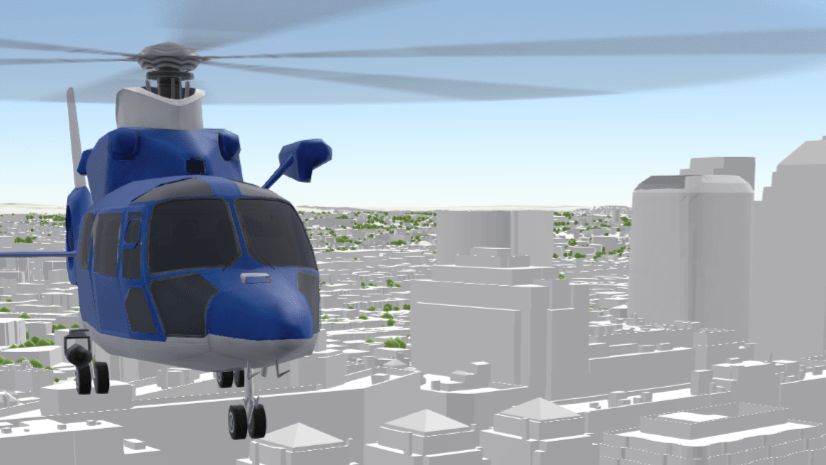
Label 3D Object Scene Layers
You can now label 3D Object Scene Layers! This is a great way to help orient your audience to the features you’ve shared as 3D Object Scene Layers and help them understand what they’re seeing. Under Layer Style Options for 3D Object Scene Layers, you’ll now see a “Labels” interface, where you’re able to select the attribute used as a label, along with options for size and color. See this example below where buildings in New York City are labelled by their Name attribute.

A few final feature you may have noticed in the last release- pop ups are now docked on the side of Scene Viewer. As you click on features and identify attributes Scene Viewer, you can see larger pop ups designed and published in ArcGIS Pro or configured in ArcGIS Online moved to the side with a “Zoom to” button. You’ll also notice that you can click on lidar and photogrametric points in a point cloud scene layer and identify classification codes, elevation, intensity and other attributes.
We’ve been noticing how organizations are creating amazing 3D experiences with data that once seemed impossible to visualize on the web. These newer features should help you author scenes that enable viewers to more deeply engage that data and realize how meaningful context can be.


Article Discussion: