With the release of Scene Viewer in ArcGIS Enterprise 10.8, we are excited to offer cool new features to help you produce stunning scenes and reveal otherwise invisible infrastructure and insight. A new interface in the Building Explorer tool allows you to pick and isolate floors, producing enjoyable ways to experience large and complex models streamed over the web. Water animation visualization styles transform polygons to water representations with sunlight reflections. Smart mapping for lines and polygons expands your choices for depicting attributes and lets you discover and explore the data with new, practical workflows. Also, we improved scene layer performance and much more…
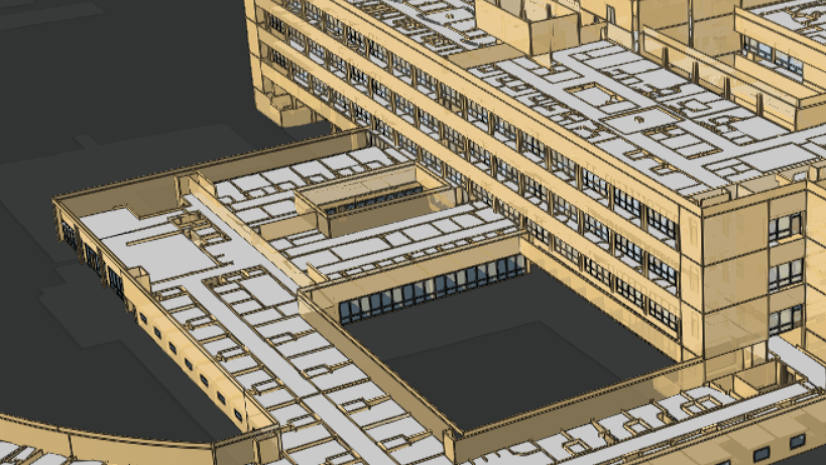
Floor picker in Building Explorer
Browse individual floors with an interface that provides a quick way to isolate building levels to display spaces, structural assets, and infrastructure. It’s never been easier to visualize spaces and find answers with BIM data in Scene Viewer.
Selecting a building scene layer with the Building Explorer tool displays an interface where you can browse through available floors and pick one to view in isolation. Architectural elements, electrical features, walls, and other disciplines and categories can be added to provide an intuitive way to locate otherwise invisible infrastructure.
Smart mapping
Animated water visualizations
We’ve added an innovative polygon style that helps you create beautiful seascapes and waterfronts, or more realistically depict flood impact assessments.

Water styles applied to polygon feature layers add animated waves to your water features that are perfect for oceans, lakes, rivers, or pools. Use the Daylight tool to change the light during the day and see how sunlight reflects off the water surface as it crosses the sky. Have fun playing around with this style to create stunning visualizations that you can leverage in apps, such as Story Maps.
Extrude polygons
Polygon feature layers have new smart mapping styles that let you visualize buildings and other data. It’s now a simple process to extrude polygons by a height attribute to build a simple representation of buildings, and color your buildings using additional attributes, such as land use or occupancy.
Choose other attributes in 3D smart mapping polygon styling to select other symbology options while still retaining the capability of extruding polygons later in the workflow. 3D Counts and Amounts allows you to choose and symbolize ranges by color scales. Use 3D Types to individually color features by text or numeric values. Both options have properties in which you can select a height field to extrude polygons.
Tip: Extruded polygons are a good first step for modeling cities in 3D, but there are other strategies for developing and serving scenes of buildings with higher levels of detail. You can use ArcGIS Pro to create buildings with correct roof shapes as 3D scene layers, and you can look into the Local Government Basemap Solution to automate this process with Lidar data. For buildings with an even higher level of detail, publish Revit data to a building scene layer.
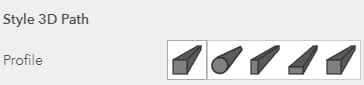
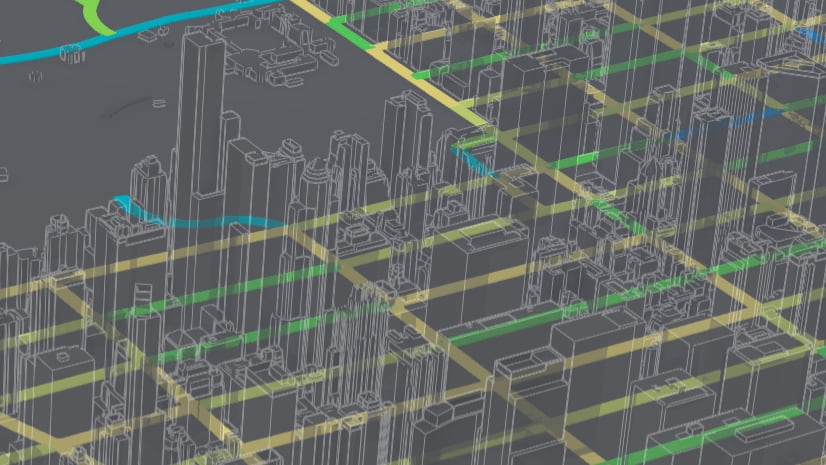
Line profiles
You can now symbolize lines as tubes, walls, strips, and squares. Use attributes to color the lines and numeric values to size the lines, such as you would with pipe diameters.
Apply 3D Counts and Amounts Line styles to symbolize numeric attributes as a color ramp, or 3D Types to give color and size to lines based on attribute values.
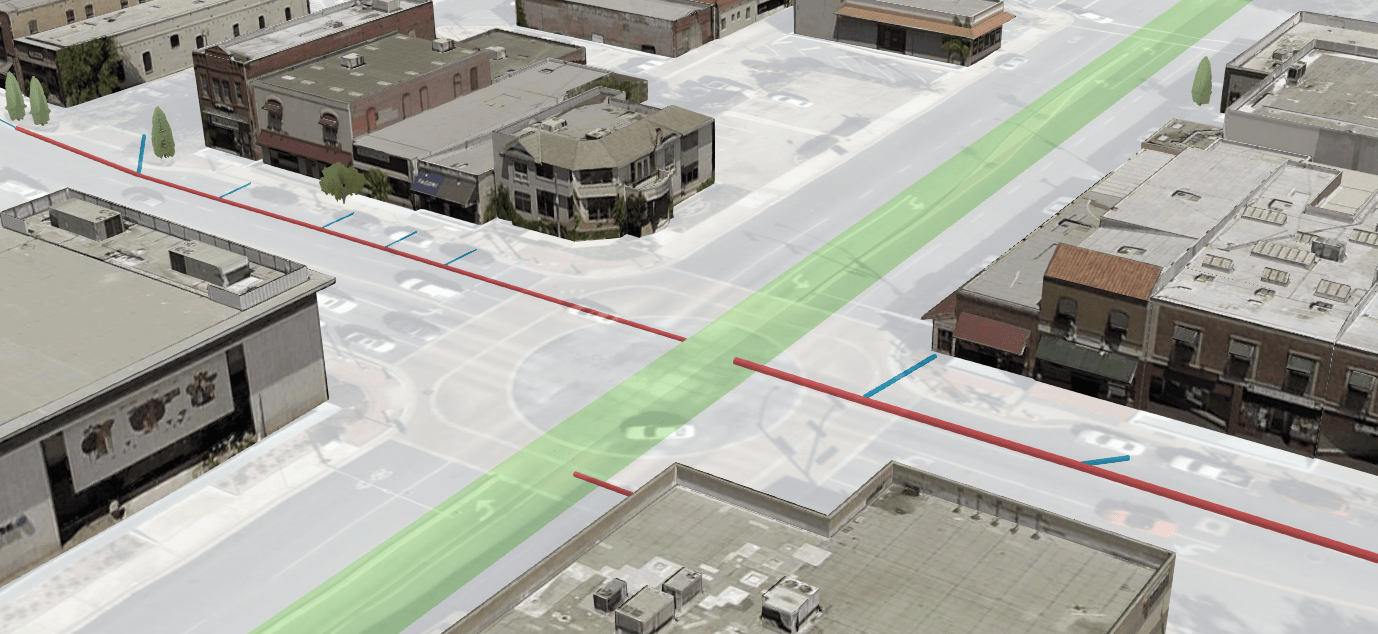
This is a great way to develop 3D scenes with data typically maintained with 2D GIS. There’s a lot of potential for how you can take advantage of this feature, but let’s explore a common scenario:
Let’s say you are a GIS Analyst for a city and balancing maintaining a storm drain network in 2D while exploring the value of representing that data in 3D. Utilities and drainage data frequently contain attribute information about depth, diameter, material and usage type. All of these are valuable attributes to explore, and smart mapping line styles in Scene Viewer make it easy to discover 3D visualizations that changes as the features update. Many storm drain networks consist of arterial tubes that run to larger, concrete box collectors. Scene Viewer makes it easy to differentiate and filter the network by type and use a combination of tubes and rectangular shapes to build a realistic representation of a storm network.
Visibility range
Scale visibility ranges help you show the right amount of detail at the right scale. When balancing performance and detail, making choices about what to show can be challenging. Scale can work differently in 3D as the tilt of the camera introduces complexity with defining what is visible. Many of you have requested more control in Scene Viewer to help make sense of what scale means in 3D.
Now, under Layer Properties, you can access the Visibility range tool to configure the scale range at which the layer is visible. This not only provides the capability to author scenes that turn certain layers on and off when zooming in and out, but also indicates how the camera tilt affects scale.

Visual improvements
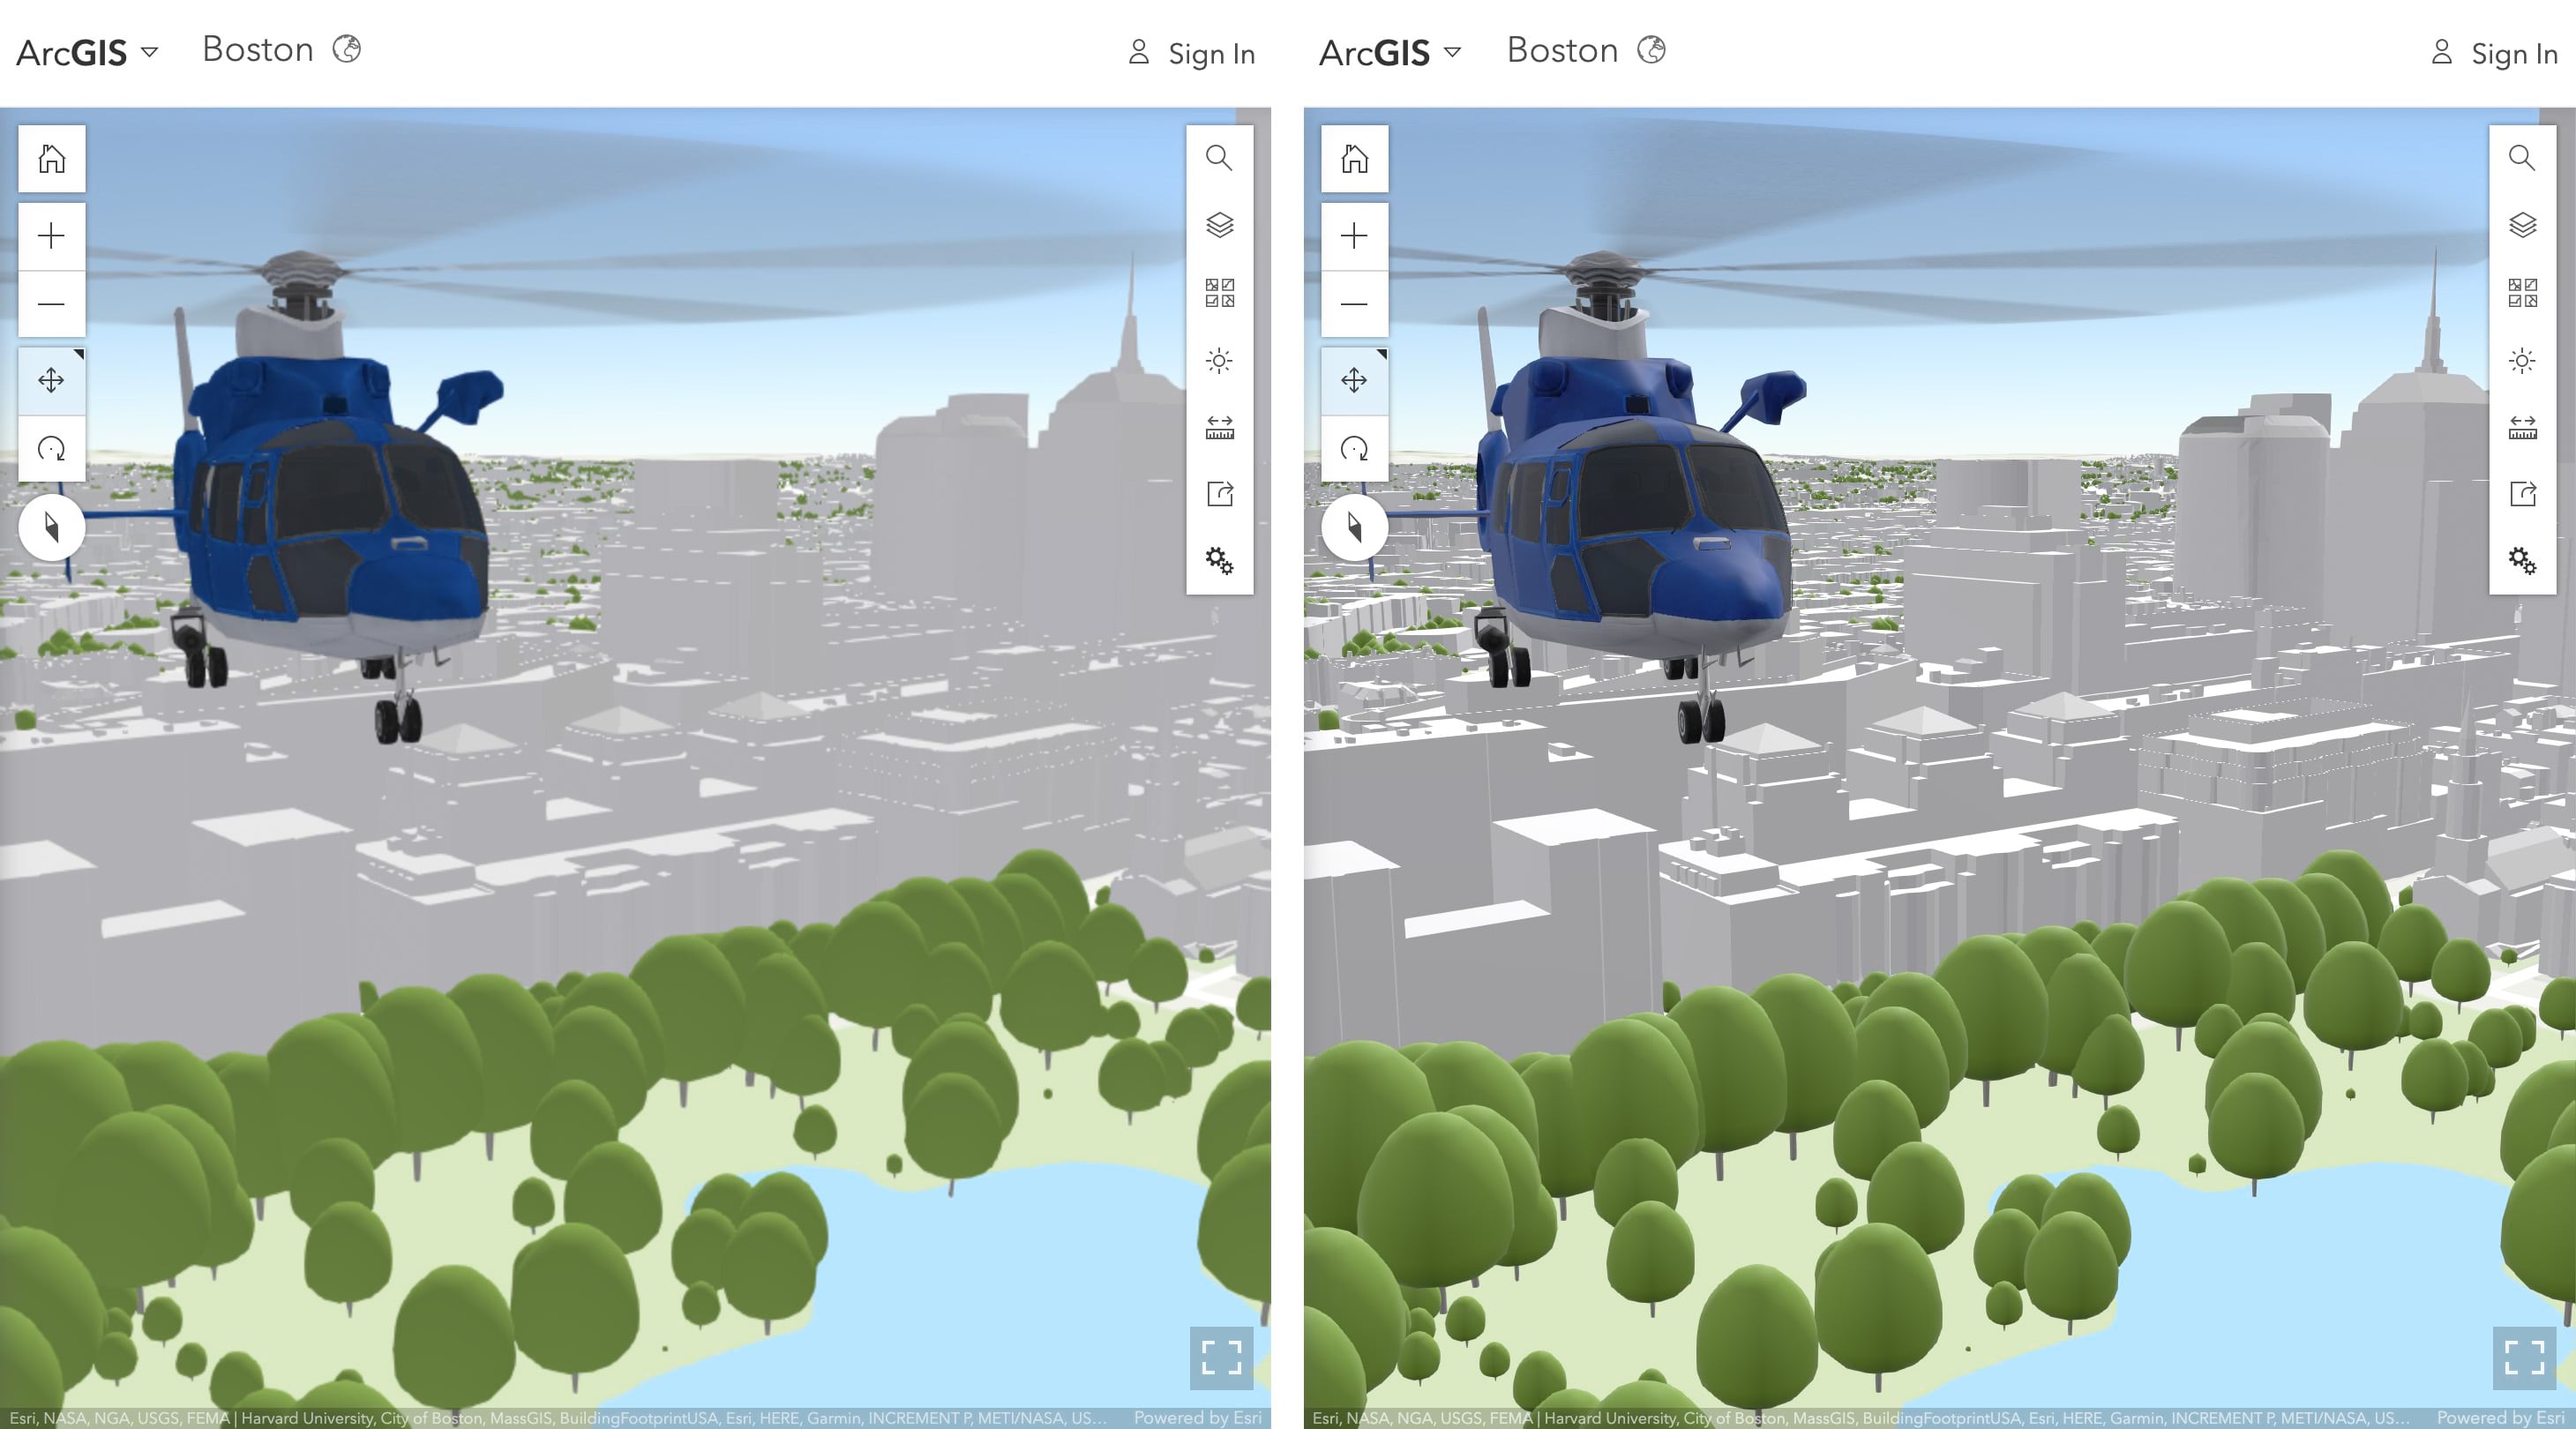
New lighting and shading model
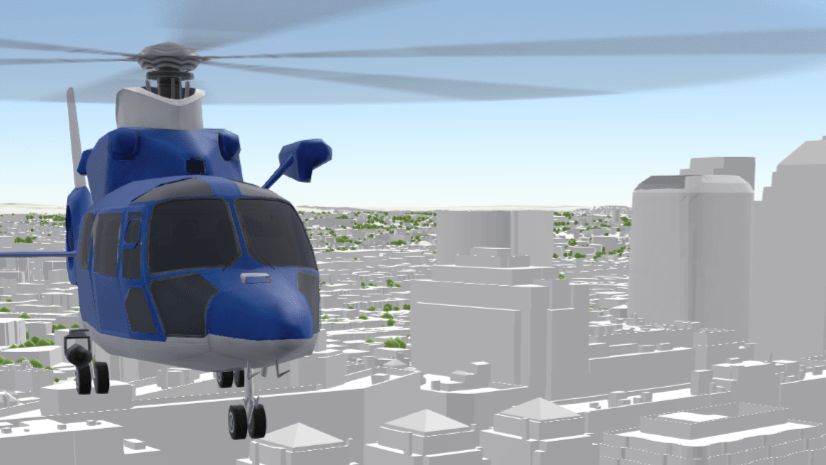
A new lighting and shading model improves the sense of depth, contrast, and definition of 3D content like buildings, trees and symbols. Also, when looking closely at available 3D models, you’ll notice material properties like the “metallic shine” on vehicles and infrastructure. Choose Quality in settings to experience the new model.
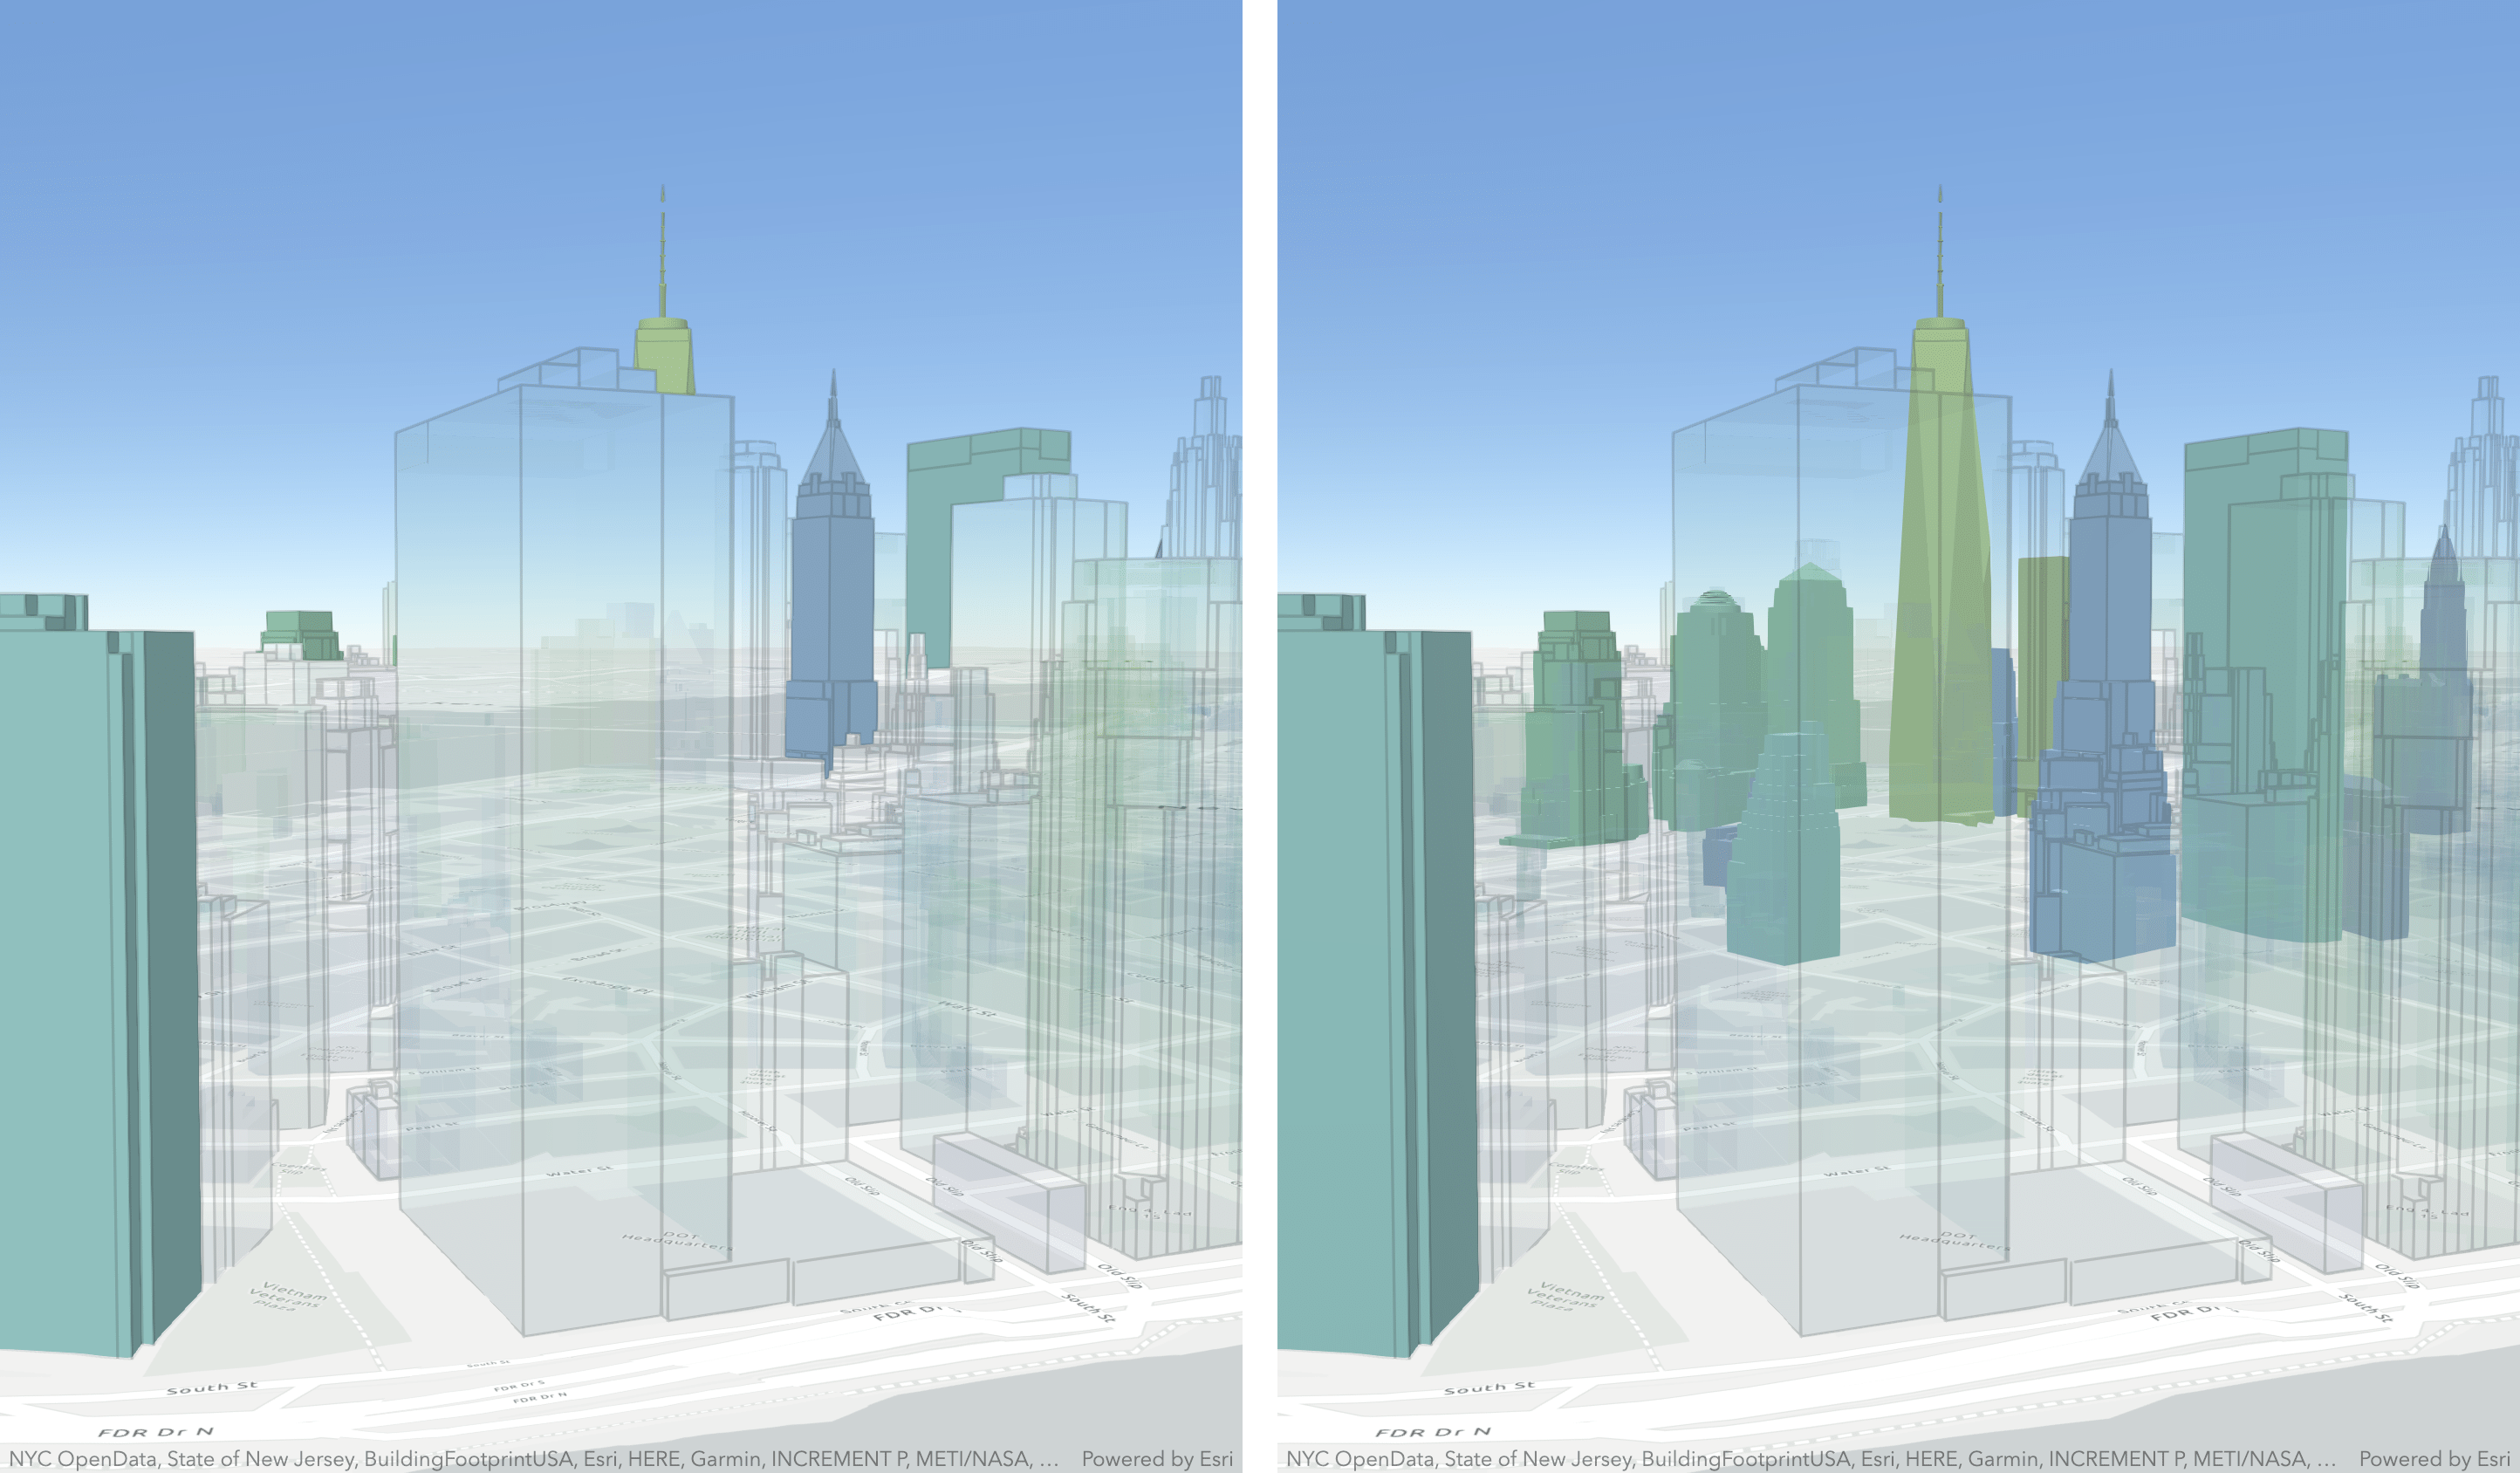
Transparency
You’ll also notice we improved the transparency rendering for buildings and extruded polygons. Now you clearly see non-transparent features behind transparent ones to draw attention to specific areas of interest. Make sure to incorporate transparency in your scene authoring strategy.
Tiled and map layers
There are new improvements with how ground layers load and visualize in Scene Viewer. Draped vector and raster data, including basemaps, elevation, and imagery now load and display a more homogeneous scale level, reducing the potential for draped content to display two different cached levels of detail (LOD). Tile layers are created to show streets, buildings and other content at certain scales, and this can be challenging in the scene as tilt affects scale. Now, rather than loading and displaying many scale levels, Scene Viewer loads and displays the same LOD in large parts of the view.
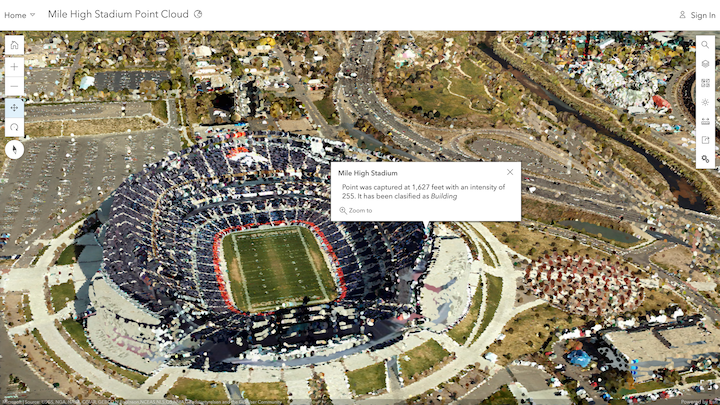
Pop-ups on point cloud scene layers
Utilize the vast amount of information in LiDAR and photography-based point clouds to see details about each point in the point cloud scene layer. This helps you better understand information about color, classification code, elevation, intensity and other variables. With pop-ups enabled in Layer Properties, click a point in the point cloud and immediately see detailed attribute information.
Scene layer performance enhancements
We continue to optimize scene layer performance of scene layers. Scene Viewer loads integrated mesh, 3D objects, and buildings up to four times faster with the new I3S specification version 1.7. In addition, new client-side caching helps reduce areas without data when exploring the scene. For more details, check out this blog and find the standalone tool to upgrade existing integrated mesh and 3D object scene layer packages to 1.7.
And that’s not all…
We packed even more enhancements and fixes into Scene Viewer:
- The Esri-provided gallery in Scene Viewer includes new 3D models, such as bicycles and fire hydrants, to further customize your scenes.
- Infrastructure and Recreation web styles are new in the gallery.
- Automatic level of detail has been added to 3D models of schematic trees to maintain strong performance in scenes.
- Scene Viewer now supports the CGCS 2000 coordinate system.
- A small loading bar on the Layers button was added that displays the status of all layers being loaded. This helps you and your audience understand the nature of the data loading.
We hope you find these features exciting and help you create new and beautiful captivating scenes!

Article Discussion: