Events
Esri FedGIS | February 9–11, 2026 | Washington, DC


Esri FedGIS | February 9–11, 2026 | Washington, DC
Find out how your peers are using Esri technology to achieve their goals.

Get enhanced support in conducting missions with ArcGIS.
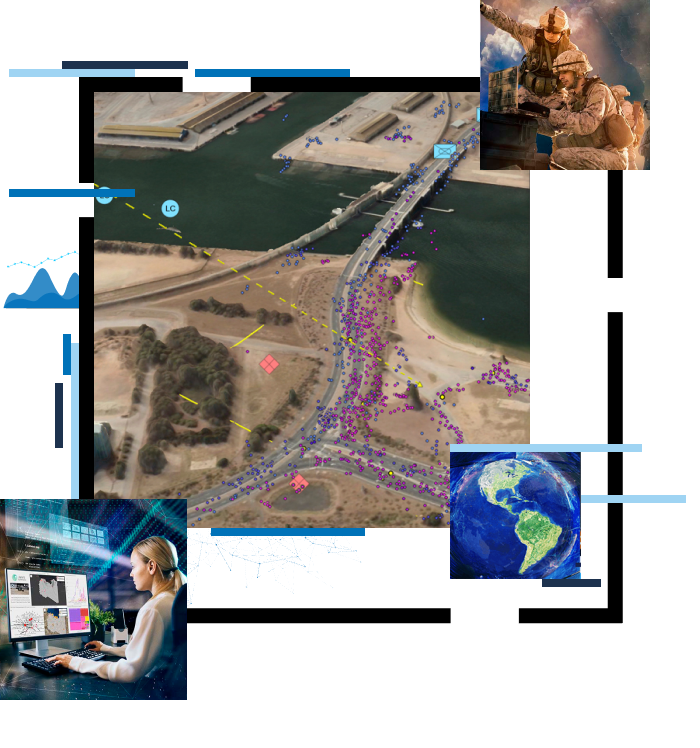
Discover insights with location intelligence.
Transform your imagery into actionable insights.