Enhancing Wildfire Assessment Programs with a Geospatial Approach
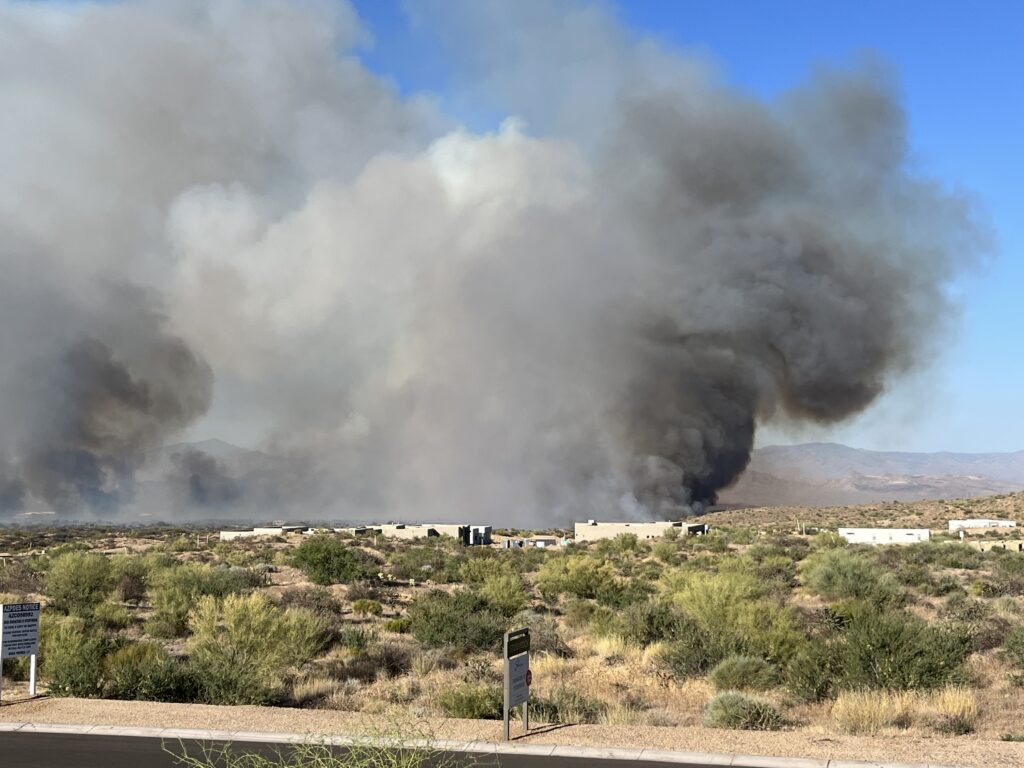
To many, Scottsdale, Arizona, doesn’t look like the typical scene for large scale wildland urban interface (WUI) fires. It’s comprised of luxury homes, saguaro silhouettes, and long ribbons of Natural Area Open Space (NAOS), areas that mandate the preservation of a property in its natural state, that thread right through neighborhoods. Those NAOS areas and their protected washes are gorgeous, and, in the wrong week of heat and wind, these unmitigated areas can act as a fuse.
We sat down with Scottsdale Fire and its geographic information system (GIS) team to unpack a program that looks simple on paper; drive around, perform home assessments, document issues, and inform the public, but it is quietly one of the most mature “every home, every year” wildfire assessment programs we’ve seen.
Captain Jim Mack noted, “We’re real aggressive about prevention here in Scottsdale. These (fires) can get out of hand quick.”
Before its modernization, Scottsdale’s assessment workflow was exactly what you’d expect – lots of paper records, and no efficient way to measure progress.
“We used to just print up map pages and make little three-ring binders for each station… mark a house on the map and leave a door hanger,” said Chief Kerry Swick. This was done for tens of thousands of homes, every year – on paper.
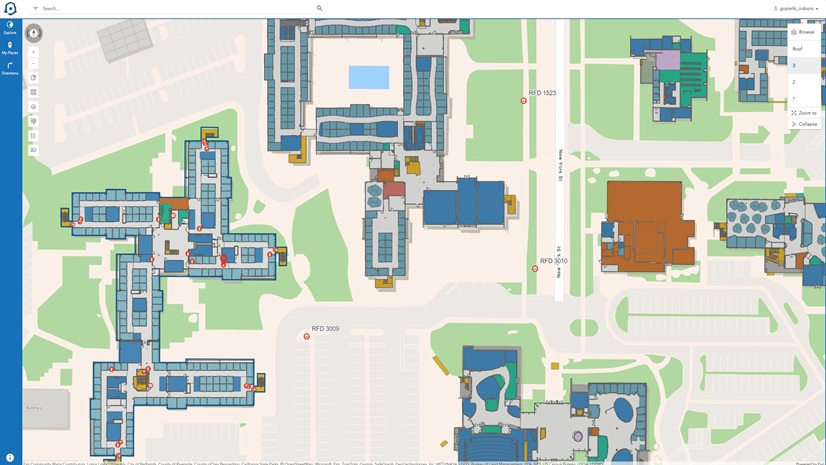
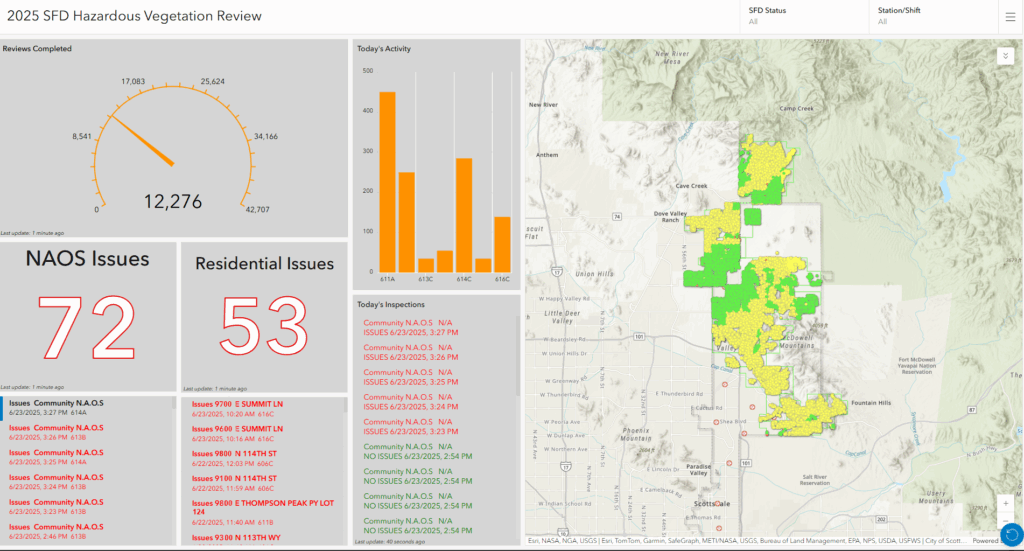
In 2019, the city’s GIS team, led by Mele Koneya and Chris Lechner, changed this paper-based workflow. They created a data-driven home assessment mitigation application. Borrowing lessons from their fire hydrant review program and other GIS efforts around the city, they stood up a mitigation focused ArcGIS Web AppBuilder application and ArcGIS Dashboards to review progress of the fire department personnel to assess residential areas by station and shift.
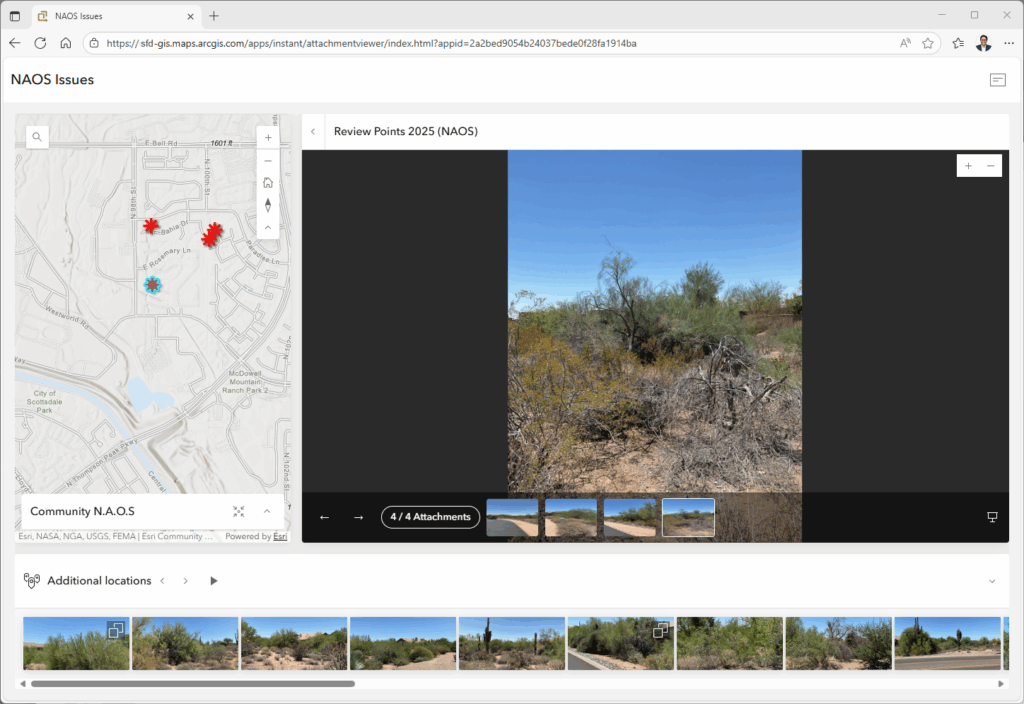
Then came the ability to live-edit defensible space status in the field with ArcGIS Field Maps. “Pictures definitely tell the story. Last year was the first year we started collecting photos, and this year we refined it” Koneya said.
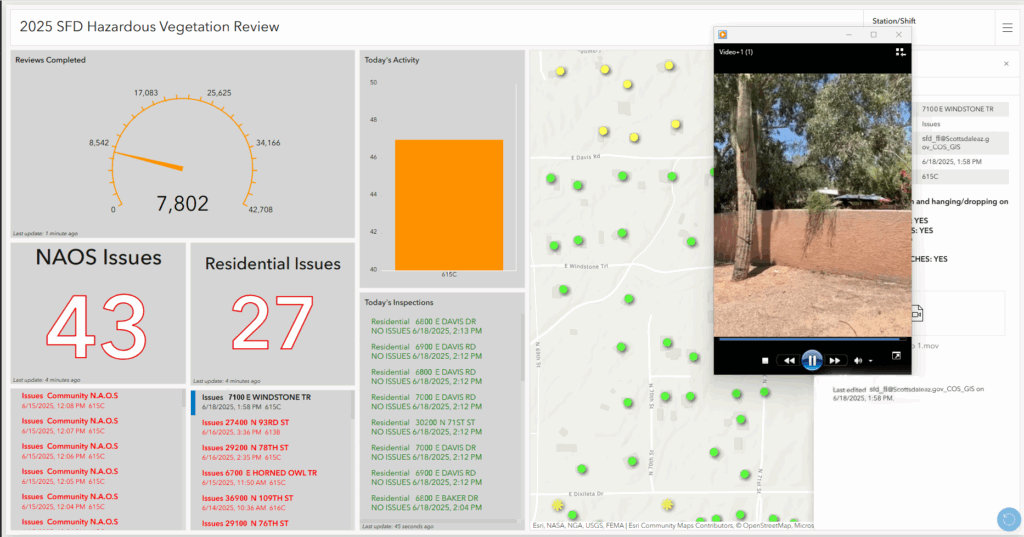
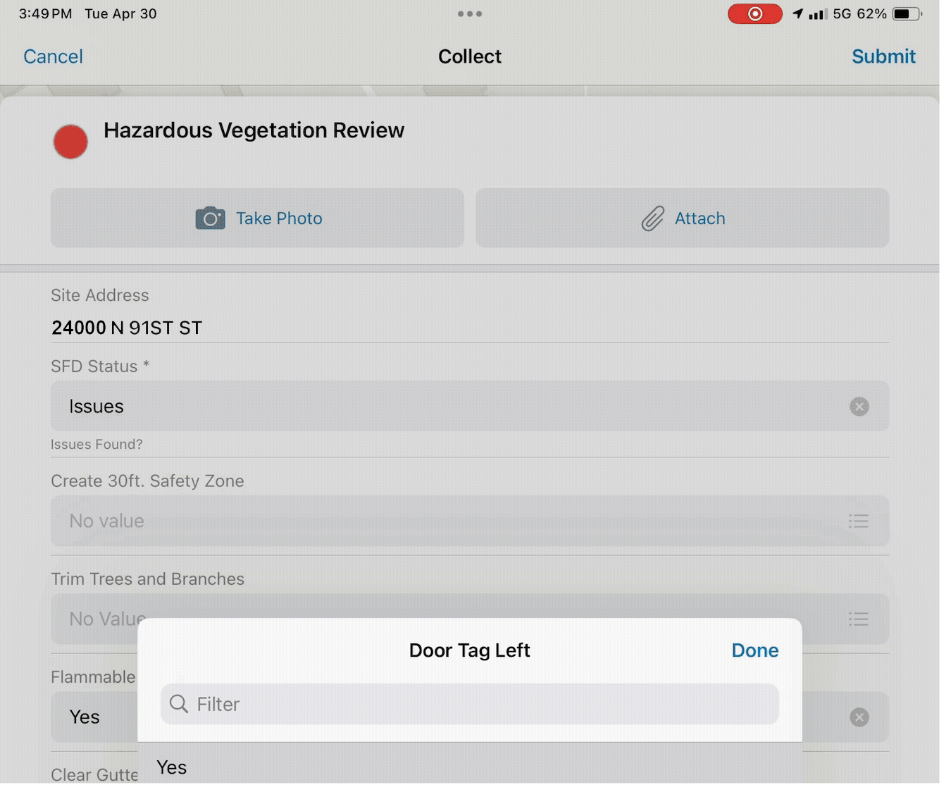
Crews now run windshield surveys with ArcGIS Field Maps; tap a form; and, when something’s off, snap a photo that will later travel with a postcard to owners. That single design choice closed the loop between firefighters, community relations, and residents.
2025 Home Assessments in Scottsdale
Stretching roughly 31 miles from north to south, Scottsdale concentrates its annual checks where neighborhoods press up against risk-laden NAOS. This season, crews completed approximately 42,000 assessments, including both residential properties and NAOS segments. This represents about a 25 percent increase from the 33,000–34,000 assessments completed last year.
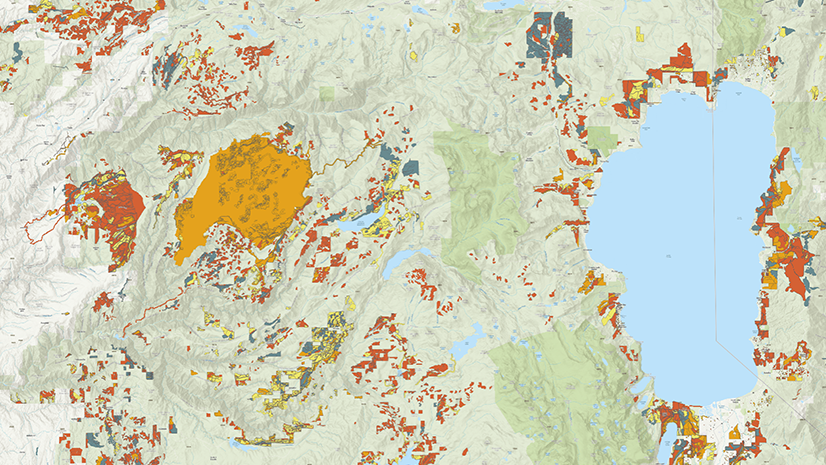
The workload is split among eight to nine northern stations, with seasonal brush units pitching in. Using ArcGIS Field Maps, every address gets triaged with a green, yellow, or red color system: green if it’s good, red if there’s a problem, and yellow if it’s not done yet. When a property is identified as red, fire department representatives knock on the door and turn findings into fixes.
Those numbers aren’t just feeding a dashboard; they’re positively influencing operations. “It puts [at-risk areas] on the company officer’s radar,” says Captain Blake Miller.
Red Roofs, Postcards, and Real Accountability
The city uses a clean color cue: green is good; red needs action. However, a dot changing colors on a map doesn’t do the work to get rid of weeds or remove ladder fuels against siding. Communication does.
The fire department “started sending postcards to homes with issues, and residents came back saying, ‘I don’t understand the problem.’ So, we added photos and specific mitigation detail so we could communicate it better and, if needed, fire department personnel can go out for an on-site assessment,” said Public Information Officer, Lori Stauffer.
Now the workflow looks like this:
- Windshield survey in ArcGIS Field Maps, flagging issues and taking photos
- Door hanger left with simple, specific guidance
- Mailing postcards (yes, even to out-of-town, second-home owners) that includes information on how to fix the exact issue that was found
- Fire department visit for owners who need it
Chief Swick said that staff have seen that “the postcard makes it to Chicago where the homeowner lives so they can call their landscaper or HOA, and things get done.”
The NAOS Curveball
NAOS, which is central to Scottsdale’s identity, can be a major wildfire vector when choked with flashy grass and dead material.
“The NAOS areas are our problem. It’s not the single-family home anymore,” said Chief Swick. Here’s the catch: Ordinance currently limits what can be done in NAOS (e.g., no vegetation management by homeowners and no gas-powered tools), which means motivated homeowners and firefighters have their hands tied. Even if homeowners attempt to mitigate risk in these areas, they can get ticketed for the work.
This year, Scottsdale began explicitly assessing NAOS segments alongside individual parcels, which does two important things:
- Prevents a type of false red triage – where the home is fine but the wash behind it is the hazard
- Builds the evidence base that leaders need to update policy and target mitigation where it matters
What This Is Not: Firewise USA Home Inspections
Scottsdale was crystal-clear about its program’s scope.
“It is not a full Firewise [USA] home assessment. This is a run-and-shoot offense because we’ve got almost 43,000 stops,” Swick said.
When owners request a deeper look (vents, ember screens, attachments), the city sends personnel for that one-on-one walkthrough. That keeps the mass survey fast and still provides a path to detailed, home-by-home hardening.
Why It Works and What Others Can Steal
What makes Scottsdale’s model tick is its cadence and clarity. By running wall-to-wall coverage every season, for every home, every year, the city builds not only a culture of readiness but also, just as importantly, clean data. ArcGIS Field Maps with photos turn vague suggestions from the city into actionable conversations; a picture and one plain sentence beat a generic “cleanup” notice every time.
The outreach itself is a two-step nudge for homeowners: a door hanger in the moment, followed by a postcard so that even out-of-town owners can act. When owners want specifics, a fire department representative steps in for the walk-through, and throughout the season an operations feedback loop helps company officers watch their risk environment evolve as assessments occur.
And it’s not just a Scottsdale Fire Department project anymore. Insurers are beginning to push guidance straight to homeowners, another nudge toward prevention. As Captain Jim Mack puts it, “It looks like the way of the future. Prevention is always the best route.”
Looking Forward
Scottsdale is exploring a vegetation-density-sensing drone to prioritize which NAOS clusters should get mitigated first in a data driven manner. Swick said that, ideally, Scottsdale would want to “fly a pattern and pictorially show where the super-dry dead stuff is—and how close it is to a house.”
By explicitly flagging NAOS as the hazard driver in many areas, and documenting the scale of that hazard, the city is building a case to modernize ordinance so that mitigation can occur without penalizing people for trying to be safe.
On the GIS side, the team has already migrated from ArcGIS Web AppBuilder. There’s even room to add tasking for assignments, including prioritization using satellite imagery and AI (e.g., canopy near eaves, vegetation within 5 feet of a home).
Swick framed it with a bit of institutional memory: “We keep pushing and refining and upgrading, just like in 1985 when Scottsdale became the first city in the world with single-family residential sprinkler systems.”
That’s the ethos here – not a silver bullet, but a repeatable system that tightens a few clicks every season: better photos, clearer language, smarter routing, sharper policy.
If You Work for a City Looking to Copy and Paste
Don’t wait for the perfect plan, start now. Pick a pilot area, start surveying homes, and quantify your results. Build the community feedback loop into the workflow so that findings don’t die on the vine: leave a door hanger in the moment, then send a photo-informed postcard that shows exactly what to fix. Name the off-parcel hazards to provide context.
If your version of NAOS is instead other protected lands or an unmaintained ditch, document that and treat it as part of your risk data. Create a pathway so that a trusted assessor can turn a lot of red dots into green dots with on-site coaching. And share the work: Put simple dashboards in front of chiefs and councils so that they can see progress, keep momentum, and keep the funding conversation moving.
Big thanks to Scottsdale Assistant Fire Chief Kerry Swick, Captains Jim Mack and Blake Miller, Public Information Officer Lori Stauffer, and GIS pros Mele Koneya and Brittany McKnight for their candor and their work.