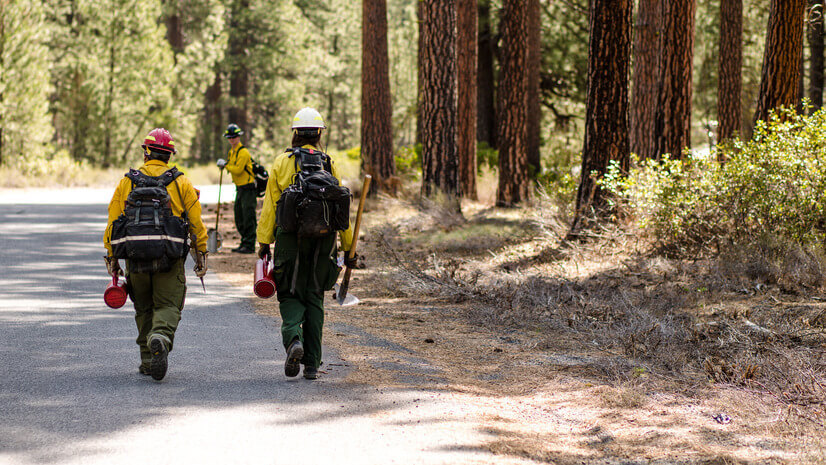
In this series, you’ve now seen the key wildfire apps, the data feeds that power them, and the national geographic information system (GIS) environment where professionals do their work. To round out this series, we’re going to take situational awareness to space. Remote sensing resources like satellite imagery, thermal sensors, and airborne platforms let us map fires when smoke and terrain make on‑the‑ground observation and mapping impossible. We’ll also introduce Incident Awareness and Assessment (IAA) technology, which allows agencies and incident management teams to order aircraft and satellite assets to deliver geospatial intelligence during a fire.
Satellite Imagery
Today, effectively fighting wildfires requires near real-time maps. This often translates to up-to-date imagery. Enter Content Store for ArcGIS, a commercial satellite imagery service that feels like a cheat code for imagery. It allows you to access an enormous range of satellite images on demand, often pulling from dozens of different satellites. The content store basically aggregates earth observation data from industry-leading sources into a single easy-to-use platform, so you don’t have to juggle multiple satellite providers or arcane ordering systems. You’re able to identify an area of interest over a specified date and grab imagery. Depending on the imagery you choose, there is a cost to this service. Regardless, I want you to be aware that it exists, especially if you can purchase imagery during an ongoing incident. Read more about the Content Store for ArcGIS here.
Satellite Tasking
When you need on-demand imagery for mapping an area of interest, such as the area of an ongoing wildfire, you’ll need direct satellite tasking capabilities. You can do this from the Content Store for ArcGIS mentioned above (this webinar shows you how). There are also a range of companies that provide tasking services, such as ICEYE, BlackSky, and Planet. To effectively get what you need, it’s important to understand why you need imagery. For mapping, RGB could be enough. However, if there’s still heavy smoke and you’re looking to complete damage assessment work, you may need synthetic aperture radar (SAR) data. This would require a call to ICEYE for tasking and purchasing the company’s wildfire insights.
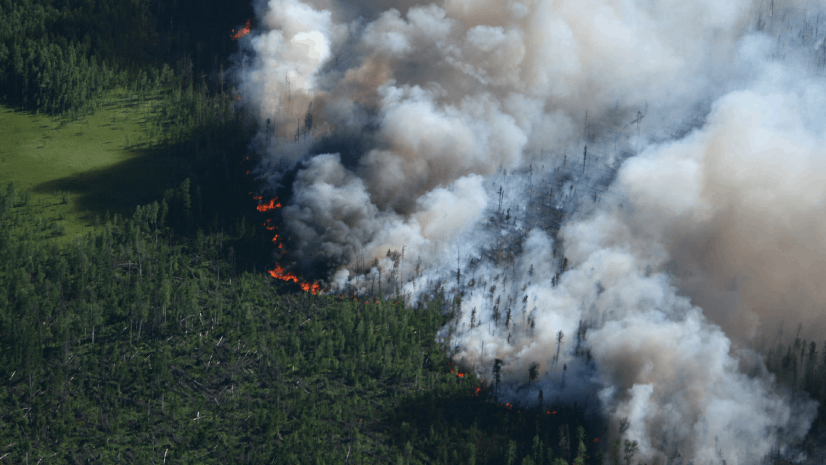
ICEYE staff completed damage assessment work by tasking their satellites for the Palisades and Eaton Fires this past January 2025. The results of their work are below, and you can read more here.


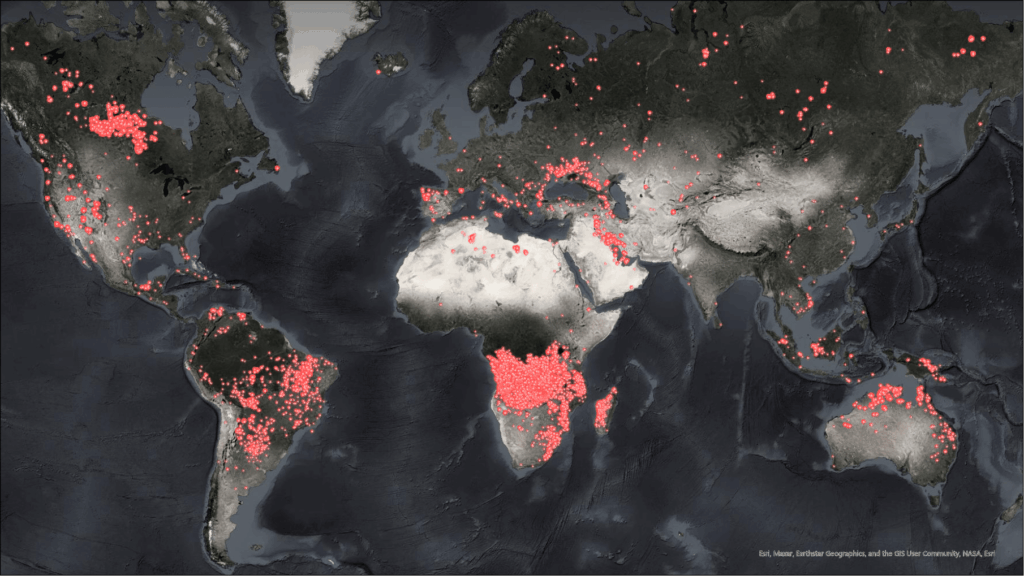
Thermal Hot Spots: VIIRS and MODIS
No wildfire tech toolkit is complete without the venerable Visible Infrared Imaging Radiometer Suite (VIIRS) and Moderate-Resolution Imaging Spectroradiometer (MODIS) thermal hot spot data. By now, most of us have used these types of satellite fire detection—those little red and orange dots on maps indicating where something’s burning. These come from NASA/NOAA satellites orbiting Earth and are used to broaden people’s situational awareness of fires. In ArcGIS Living Atlas of the World, the VIIRS thermal hot spots layer is readily available as a live feed. It’s updated a couple of times a day, about once every 12 hours across the globe, with each hot spot including attributes like the time of detection and fire radiative power. The resolution is low at 375 meters. MODIS is older but still useful for near real-time fire detection.
Using these hot spot layers effectively requires a bit of know-how and patience. Here are some tips to get the most out of VIIRS/MODIS fire data:
- Mind the delay: VIIRS data isn’t instantaneous. VIIRS satellites pass over an area about twice per day. VIIRS hot spots are typically available within a few hours of the satellite pass, but there’s still a delay. If a fire blew up an hour ago, it likely won’t show up on VIIRS maps until the next pass (later that afternoon or evening or even the next day). Always check the time stamp on the detections since they usually trail the actual events. This is OK; just use VIIRS as a supplemental intel source, not as your early fire detection or situational awareness tool.
- Understand resolution and coverage: VIIRS can detect fires as small as a few tens of meters across (thanks to its 375-meter pixel size), whereas MODIS has about a 1-kilometer pixel. That means VIIRS will catch smaller fires and provide more detail on large fire perimeters, just much later. Neither VIIRS nor MODIS will create a perfect fire perimeter. Rather, they will produce points corresponding to hot areas, not a contiguous fire perimeter. Think of them as heat sensors that give you a general idea of where active fire or intense heat is located. Use them to guide where to look, but for precise mapping and operational purposes, you’d still rely on aerial and satellite intelligence or ground reports.
- Expect false positives and context: Not every hot spot is a wildfire. VIIRS/MODIS will also detect things like industrial heat (e.g., oil refinery flares). In dry lightning busts, you might see a bunch of heat detections—some could be new fires, others false alarms. Check the confidence attribute if available (VIIRS often has a confidence or quality flag). Also, many mapping apps use variations in icons (like a different color or shape) to denote high-confidence versus low-confidence detections. Use your local knowledge—if a dot shows up in the middle of a known oil field, take it with a grain of salt. Conversely, a cluster of new hot spots in remote timber after a thunderstorm is probably worth a closer look.
- Use ArcGIS Living Atlas layers: ArcGIS Living Atlas provides ready-to-use layers for these hot spots. The Satellite (VIIRS) Thermal Hotspots and Fire Activity layer in ArcGIS Living Atlas is updated throughout the day and includes the last seven days of detections worldwide. Here’s a pro tip: You can use filters to isolate the latest detections. For example, only show hot spots in the past 12 hours to reduce clutter when there are thousands of points on the map. Also, because it is in ArcGIS Living Atlas as a service, you don’t have to manually download anything. Add the layer to your map and go. It’s the same data you’d get from NASA’s Fire Information for Resource Management System (FIRMS), just packaged for easy GIS use.
- Complement ground intel: Here’s perhaps the most important tip—don’t use VIIRS or MODIS in a vacuum. They are fantastic for detecting fires in remote areas, but they are not a replacement for real-time and near real-time data or reports from the field. There’s usually a lag. Treat the hot spot data as a companion to your operational intel. For instance, if crews report fire activity on one flank, and the VIIRS data from the last overpass aligns with that, it confirms what you know. If VIIRS shows heat in a place nobody expected, that’s a heads-up to investigate something that’s perhaps a spot fire or a new start beyond the lines. In essence, the satellites give you a big-picture view that can fill in gaps, especially at night or over large fire areas where no single person can observe everything.
Although this series focuses on a lot of US systems, it’s worth noting that NASA’s FIRMS and VIIRS/MODIS detections cover the entire globe. The same techniques we describe here can be used to monitor fires in the Amazon, Australia, or Siberia. Many countries are also asking about Integrated Reporting of Wildfire Information (IRWIN)‑like systems, so the principles of combining authoritative feeds with local knowledge apply anywhere there’s fire on the landscape.
ALERTCalifornia
Ground-based intelligence and sensors still matter a lot. ALERTCalifornia brings a crucial on-the-ground viewpoint through its network of high-definition, pan-tilt-zoom wildfire monitoring cameras strategically placed across California. These cameras provide firefighters, emergency managers, and the public with live, near real-time visual coverage of active fire areas, smoke conditions, and even weather changes.
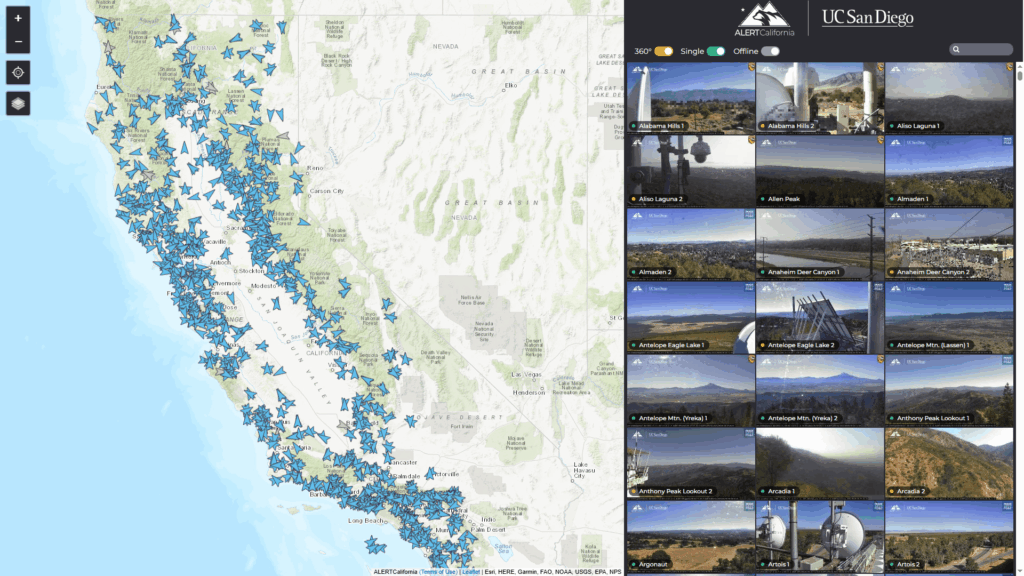
This isn’t just a camera feed, it’s integrated into GIS data you can actually use. Through ArcGIS Living Atlas, ALERTCalifornia shares its live camera feeds as a feature service. That means you can drop near real-time imagery directly into your operational maps and dashboards. Need eyes on a ridge of interest? There’s likely a camera for that. Wanting to only view only the cameras you’re interested in? There’s a camera for that, too. ALERTCalifornia is empowering you to make your own maps and dashboards with a curated set of cameras that meet your needs.
Bottom line: ALERTCalifornia helps bridge the gap between traditional ground intel and modern GIS workflows. If your area of responsibility includes California, add ALERTCalifornia to your operational toolkit. If your state isn’t offering camera feeds to the public yet, you’re behind the curve!
Access the ALERTCalifornia camera home page and the ALERTCalifornia feature service.
Incident Awareness and Assessment (IAA): A National Capability to Map Fires
I’m frequently asked, “How do wildfires get mapped nationally?” or “How can I map fires?” These are really an important questions—the people asking understand a simple truth: Without good maps, we’re flying blind. Fire managers, incident management teams, and firefighters need to know where a fire is located, identify threats like spot fires that may have crossed a road, or locate areas of intense heat. Agency administrators need geospatial products to brief elected officials and request resources. And land managers need to understand the footprint of a burn to start planning rehabilitation. In short, mapping isn’t a luxury, it’s the backbone of decision‑making during an incident.
That’s where IAA comes in. IAA can be loosely thought of as the overseas cousin of our Department of Defense’s intelligence, surveillance, and reconnaissance (ISR), designed to provide timely, usable imagery generally outside the United States or during Department of Homeland Defense events.
When a wildfire exceeds what local jurisdictions can handle, land managers and incident leadership can order IAA assets through the National Interagency Fire Center (NIFC) to get that mapping job done. Depending on the mission, those assets might differ. The platforms available via IAA collect electro‑optical, infrared, and full‑motion video data and send back geospatial products that show perimeters, hot spots, and new starts. During the 2020 California wildfires, for example, MQ‑9 aircraft crews streamed real‑time video that mapped fire perimeters and alerted first responders to changes in spread
IAA isn’t a free‑for‑all. Only those with an NIFC account and certain privileges have the authority to request these aircraft, and capacity may be limited. But I thought it was worth highlighting because so many people have asked me how big fires get mapped. For those who do have access, IAA is a powerful tool—it lets decision-makers order the right aircraft or satellite and receive high‑quality geospatial products. Even if you can’t request an IAA mission yourself, it’s good to know that these resources exist and that they’re part of the broader intelligence ecosystem we all rely on during fire season.
This has been a very high-level and quick review of the IAA program. However, if you want to take a deeper dive and learn more, read the user guide.
Other Resources
We’ve covered a lot of the heavy hitters, and I’m sure I’ve missed a few, but there are plenty of other readily available tools to help during this upcoming fire season. Esri’s Disaster Response Program curates a whole collection of maps, apps, and live feeds specific to wildfire, many of which I’ve covered above.
If you’ve ever found yourself creating the same map from scratch for the umpteenth time, give these a look. They might have already done 90 percent of the work for you.
- It’s worth noting that agencies like the Federal Emergency Management Agency (FEMA) have their own GIS hubs for wildfires. The FEMA Geospatial Resource Center is full of data and services for wildfires and disaster response, too.
- The National Wildfire Coordinating Group (NWCG) also offers standards and tools for geospatial data. While these are more reference materials than daily tools, knowing they exist can be a lifesaver when you’re navigating interagency operations. For instance, if you’re pulling together data for a multiagency fire response, NWCG guidelines can help you avoid the classic “this isn’t the format we use” type of headache.
- NWCG Standards for Geospatial Operations
- NWCG Symbology
Wrapping Up
This wraps up our four‑part series. From basic apps to national data feeds, from interagency mapping platforms to remote sensing, the common theme is that wildfire intelligence is increasingly accessible. Take some time to explore these tools, request an NIFC org account if you qualify, and share what you’ve learned with your peers. Better maps and better intel mean safer firefighters and more resilient communities.
I do want to end with a gentle reminder: All the fancy tools in the world won’t help if we don’t use them. It’s like owning a treadmill: It can do wonders, but it won’t run for you. So, as we head into the height of the 2025 fire season, take some time to set up these maps, learn these apps, and train your firefighters on them. Be sure to teach them to push the buttons but also teach them the reasons why. Explain why we collect the data and why it is important. You might be surprised at the rate of adoption.
Tech doesn’t solve everything, and GIS never extinguished a fire. But if you put in the time now, maybe—just maybe—the rest of the wildfire year will find you a step ahead with maps in hand. Keep one foot in the black, and don’t forget to share these resources with others who could use a leg up—we are in this together.
Learn More
To learn more about GIS solutions for wildland fire, visit our solutions page or download our ebook.