The image features a predominantly white background with a single thin orange line running horizontally along the top edge.

Conservation Science

Reveal the science of living systems

Integrate data, analysis, and models in one spatial foundation.

A vibrant data visualization map of North America is overlaid with multicolored lines indicating routes or flows.

Your data is the key to defensible science

When your science is grounded in geography, it becomes evidence people trust. And action follows.

ArcGIS connects ecological data, remote sensing, and spatial analysis so you can uncover biodiversity patterns, explain change, and defend your findings with confidence.

Secure and scaleable conservation science, powered by ArcGIS

One platform for all your data

You depend on data from dozens of sources, often in diverse formats.

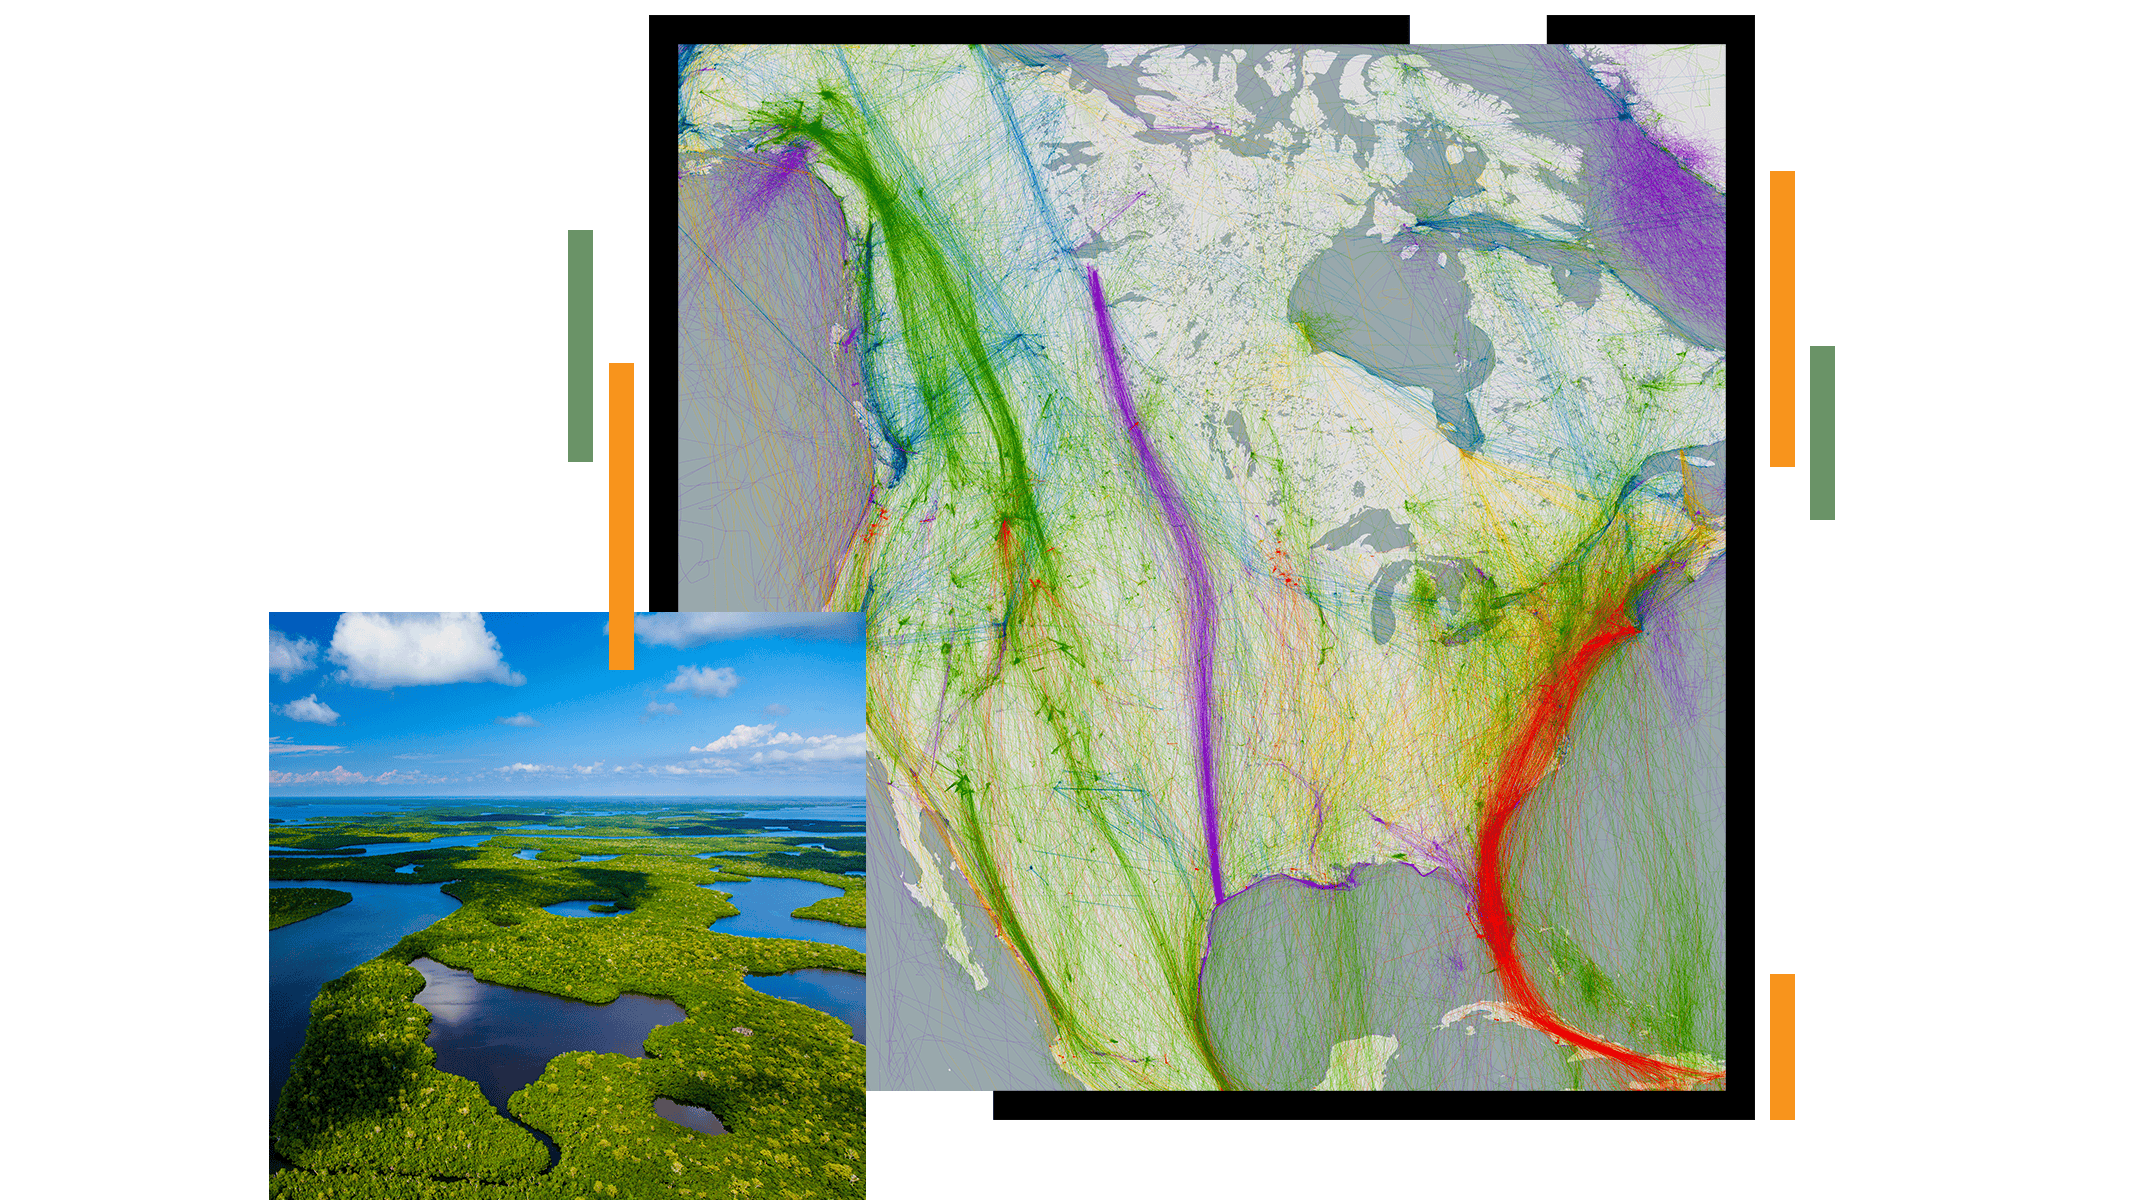
ArcGIS brings your data together, combining field observations with remote sensing, real-time sensors and more into one secure spatial foundation that works with R, Python, and open geospatial formats. Spend less time wrangling data and more time on your science.

Three-dimensional grid map showing South Asia with raised columns and purple color gradients representing data distribution

See how ecosystems influence one other

Connected data reveals how species, habitats, climate, and communities influence one another.

ArcGIS integrates field observations, remote sensing, climate data, and socioeconomic factors into a connected spatial picture—so you can see where ecosystems are under the most stress.

A satellite-style aerial image shows a complex network of winding rivers cutting through dense green forest.

Know where to take action

Some changes are too gradual, too vast, or too interconnected to identify without the right tools.

ArcGIS combines spatial statistics, imagery, and temporal data to reveal changes in species distribution, land cover, and ecosystem health—helping teams spot biodiversity loss early and act with confidence.

A satellite view of a rugged, desert-like terrain is overlaid with colorful circular data points.

Predict where and how conditions will change

Forward-looking analysis supports more proactive conservation decisions.

ArcGIS uses geospatial AI and predictive modeling to help conservation teams anticipate change. From species distribution and habitat suitability to long‑term trend analysis, you can plan ahead and focus effort where it will matter most.

A computer screen displays a climate data visualization dashboard with a central world map showing temperature changes in warm orange tones.

Communicate securely without diluting the science

Make your science open to unite conservation efforts and secure by design to build trust.

ArcGIS lets you publish models, tools, and research findings with the broader biodiversity scientific community, while keeping sensitive data like endangered species locations behind role-based access controls.

A satellite-style map shows a network of white routes radiating from a central hub in Europe.

CUSTOMER SUCCESS STORIES

See how organizations use geography to advance conservation

Products that support conservation science

Previous
Next

Apply for the Esri Conservation Program

For more than three decades, the Esri Conservation Program has provided technology and training assistance to conservation professionals around the globe.

Apply now