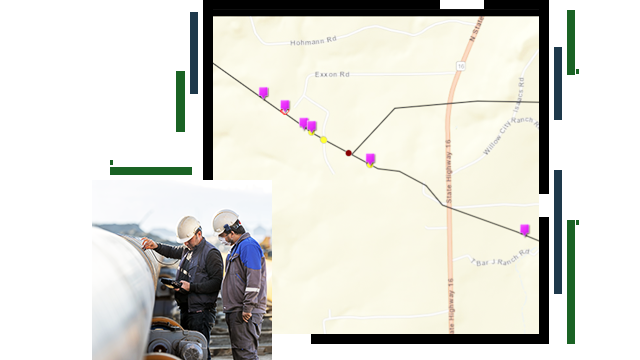
Skip to Content

Integrity Management

Keep your pipeline in good condition for safe and reliable operation

Two pipeline operators checking a pipeline, and a map with magenta icons on a lined route

Pipeline operators use partner value-added software built using ArcGIS capabilities to identify, prioritize, assess, evaluate, repair, and validate the integrity of transmission pipelines. Esri and its partners collaborate to provide pipeline operators with a holistic understanding of their pipeline's assets and condition.

Support pipeline integrity management

Class location

In the United States, population density along a pipeline determines a pipeline's strength requirements which, in turn, affects its maximum allowable operating pressure. Determining population density for this purpose requires knowledge of the number of structures and their height and other areas where people gather regularly within a given distance of the pipeline. Using GIS, you can visualize and analyze all the data needed to determine class location.

An aerial view of a corporate building and a parking lot full of cars built near a pond and wooded area with a freeway behind it

High and moderate consequence areas

Locations with dense populations along a pipeline where a potential pipeline failure could significantly impact people or property are identified as consequence areas. Determining consequence areas requires knowledge of class location, a pipeline's maximum allowable operating pressure, nominal pipeline diameter, and nearby highways. Pipeline operators must periodically inspect the condition of their pipelines in an HCA or MCA and remediate any degradation that might affect the pipeline's integrity. GIS capabilities are essential in determining consequence areas.

A yellow natural gas pipeline warning sign with snow on it in front of a neighborhood

MAOP validation

Validating Maximum Allowable Operating Pressure (MAOP) and documenting that the results meet regulatory requirements entails access to many data points and review of all related records. Location is the attribute most common to these data points and records. GIS supports pipeline operators in fulfilling their MAOP validation requirements.

A gas pressure meter over 200 psi

Risk assessment

Many factors are considered by pipeline operators as they assess potential actions that could cause their pipe network to lose containment and the consequences of such a loss. Location is the most common denominator in all that data, making GIS a key system for pipe risk assessment.

A pipeline operator checking a gas pressure meter

In-line inspection planning and assessment

A key contributor to knowledge of a pipe's internal condition is in-line inspection. Data from smart pig runs spots internal pipe defects and conditions that can result in corrosion or other failures. The exact location of each known defect can be pinpointed in ArcGIS and made available to all applications for visualization and analysis.

A pipeline open for an in-line inspection

Video

ILI Data Management

See how to leverage ArcGIS Pipeline Referencing with in-line inspection (ILI) data inside ArcGIS.

Products for integrity management

Previous
Next

Contact sales

Contact us

Outside the United States

Connect with the Esri pipeline team