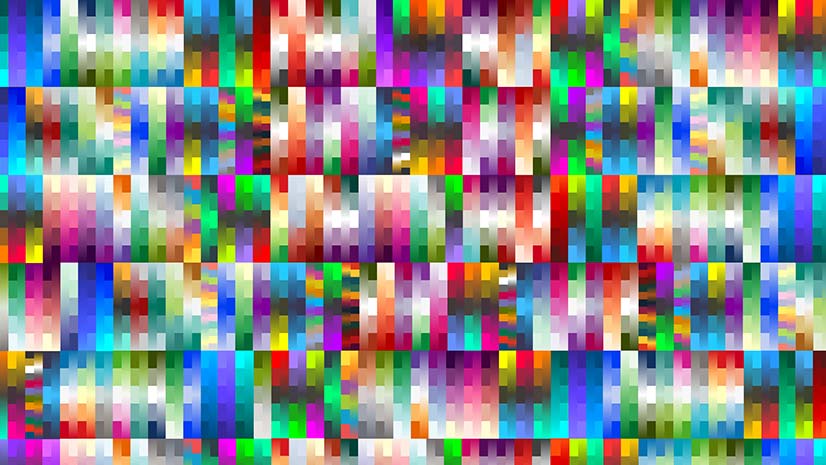
Check Out the New Color Ramps
Color ramps were updated for the Map Viewer beta. You will find more than 300 color ramps in the Map Viewer, most being colorblind friendly.
Color ramps were updated for the Map Viewer beta. You will find more than 300 color ramps in the Map Viewer, most being colorblind friendly.
Configure or upgrade your GIS by packaging ArcGIS with Dell products, including Dell servers, workstations, and laptops.
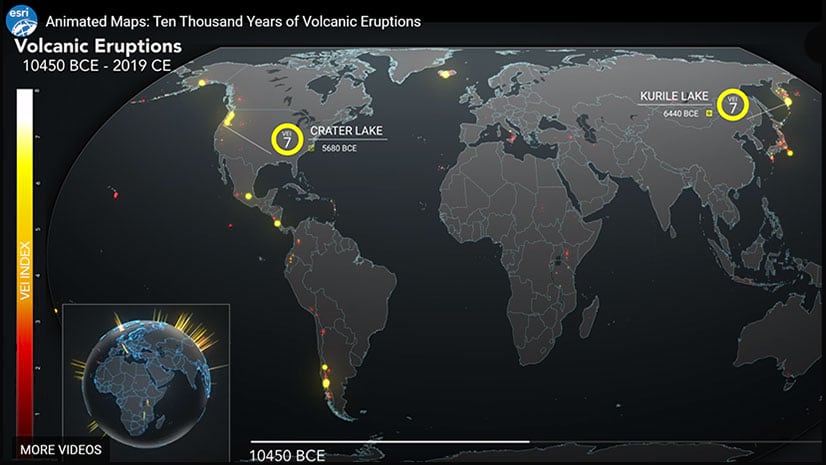
Esri created an animated map that groups volcanic eruptions over the last 10,000 years using the volcanic explosivity index (VEI).
Map Viewer beta includes a new layout for authoring maps and more pop-up configuration capabilities, printing layouts, and smart mapping tools.
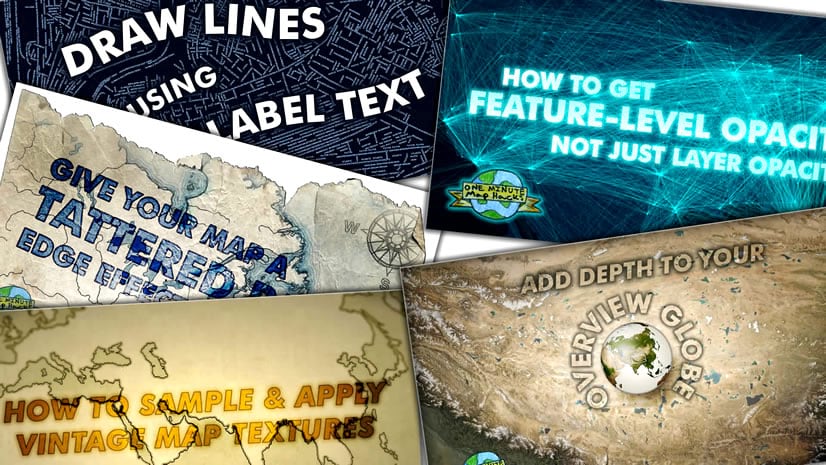
In this one-minute map hack, Esri cartographer John Nelson teaches you how to use ArcGIS Pro make a line map made up of labels.
Get a taste of the more than 1,500 GIS Day events around the world by reading these inspiring stories.
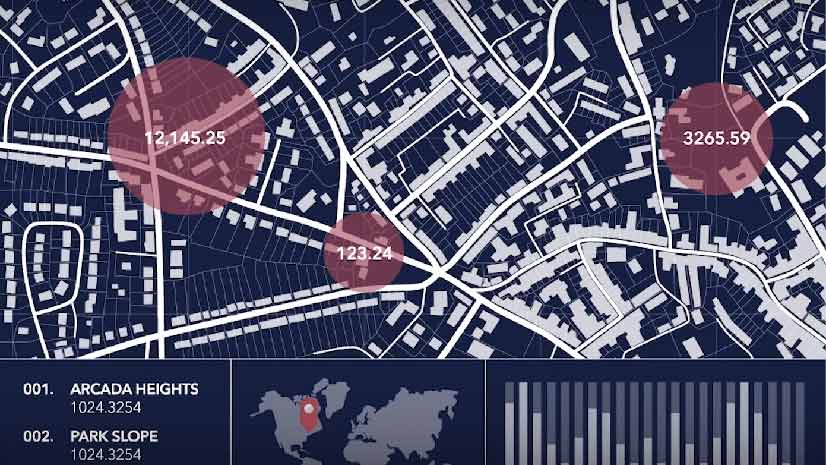
Understanding data comes down to mapping it. Get answers about the wheres, whys, and whens of your business and much more insightful information.
Learn how to create professional thumbnails for your maps, apps, and other geographic content in ArcGIS Online.
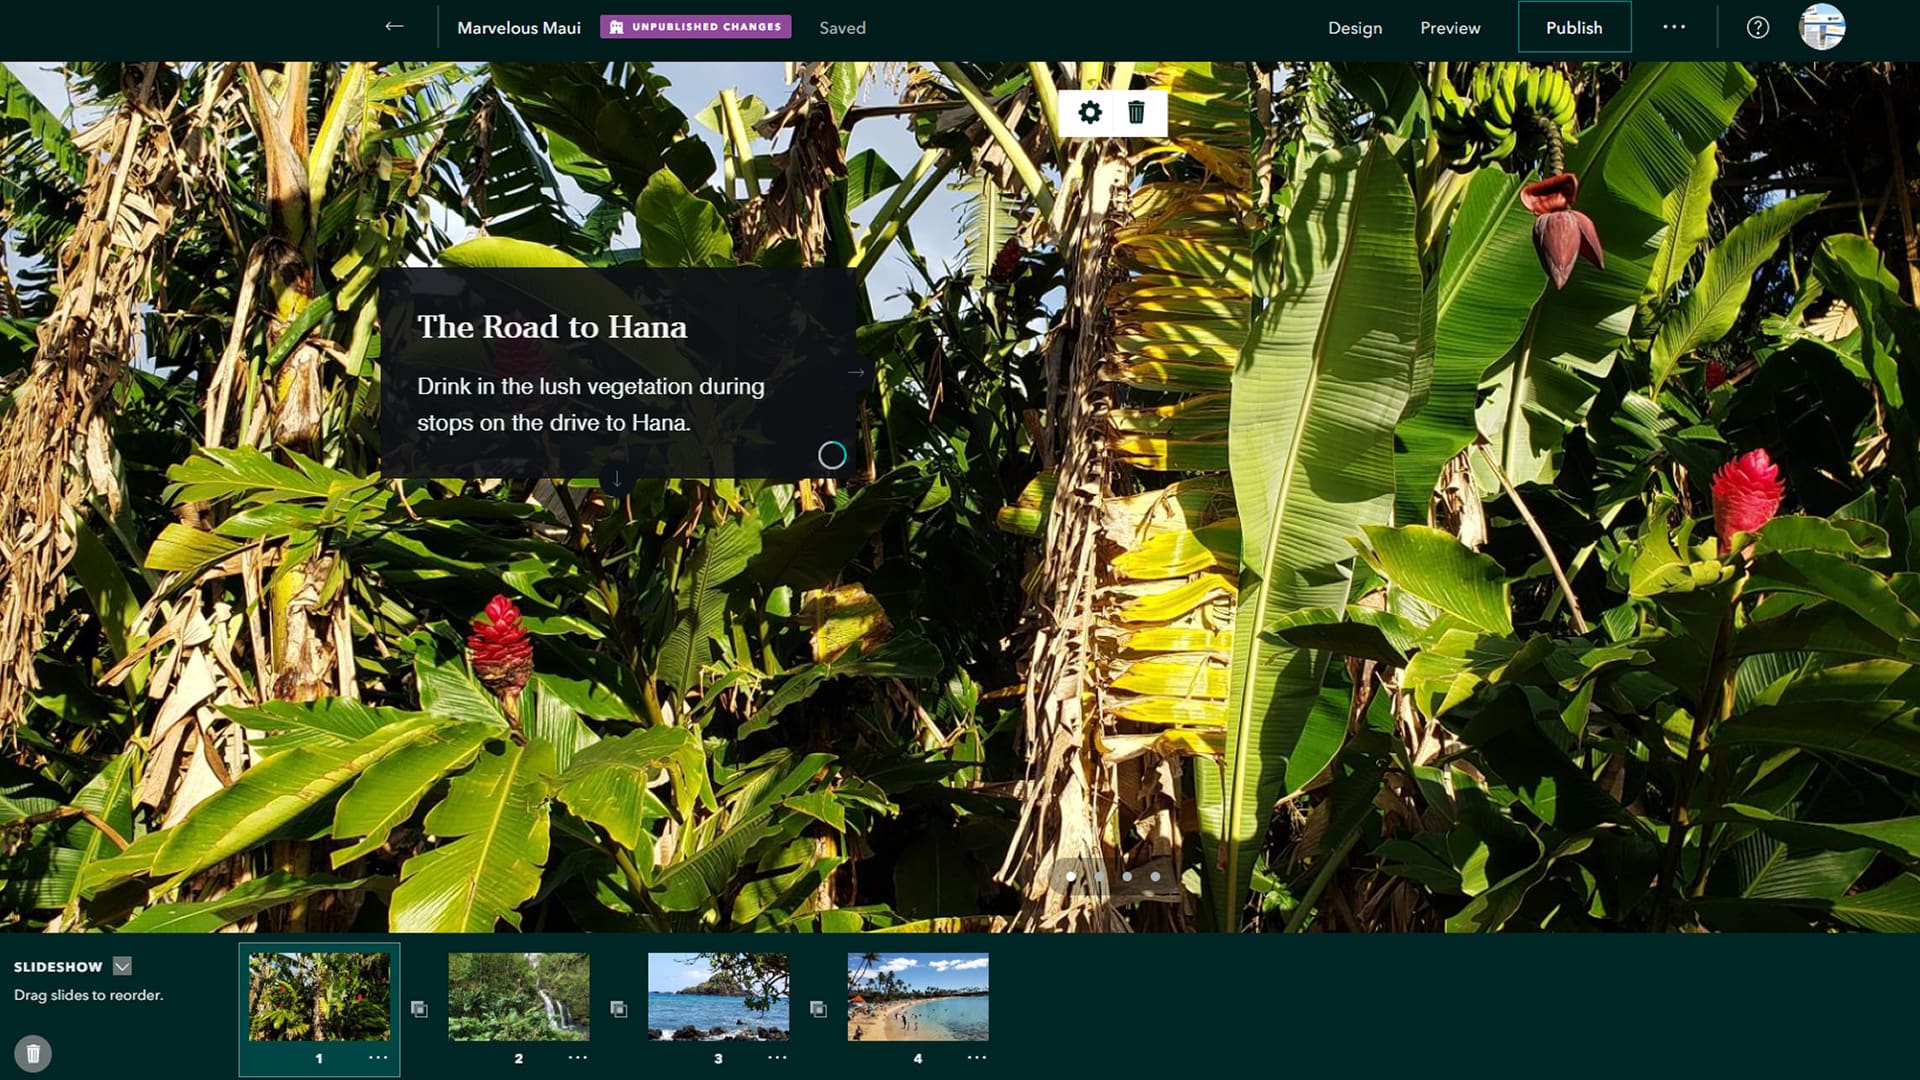
Design, tell, and display your stories more creatively with the new ArcGIS StoryMaps app tools such as slideshow, collections, and autoplay.
The US Census Bureau used GIS to develop a web mapping app that identifies areas with households typically hard to count during the census.
John Nelson from Esri shows you how to use ArcGIS Pro to give cluttered-looking coastlines on a small scale map a more elegant appearance.
Discover the new features and updated user interface in Navigator for ArcGIS, a turn-by-turn, voice guided navigation app for iOS.