Data-driven maps, or any data-visualization for that matter, need some kind of a legend to help the map reader interpret the visual. Without it, the map is just a pretty picture with no informational value. The ArcGIS API for JavaScript (ArcGIS JS API) comes equipped with an out-of-the-box Legend widget that works across a variety of layer and renderer types to effectively communicate the meaning of a map’s symbols and colors.


Sometimes users want more than a basic legend. They may ask questions about outliers, the spread of the data, and the number of features within a particular range. At version 4.12 (released in July 2019), the ArcGIS JS API provides developers with a highly configurable Histogram widget that can be used as a legend with interactive components.
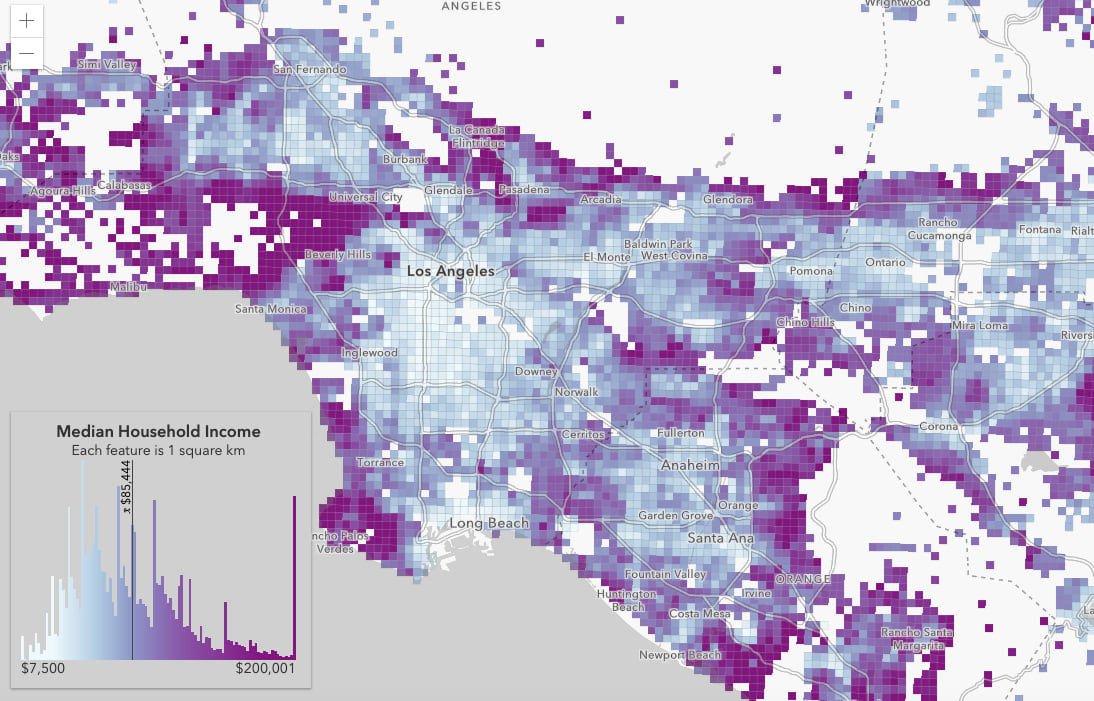
The following app renders the same map with a histogram styled using the color scheme of the layer’s renderer.

The colored histogram does a better job at communicating the range of the data, the spread, and how outliers may affect the visualization. It is particularly good at communicating asymmetric or skewed datasets. Asymmetric patterns are lost in the traditional Legend widget because the Legend depicts all color ramps the same way regardless of how close or far apart the min and max values are from the mean.
This post will walk you through the process of how to create a legendary histogram for any continuous color visualization.
Display a basic Histogram
The Histogram widget provides a simple API for displaying data in a histogram. The API requires you to specify the histogram’s minimum and maximum value, and an array of bins, each with a minimum and maximum bound along with a count.
Click the image below to open a CodePen and play with the code.
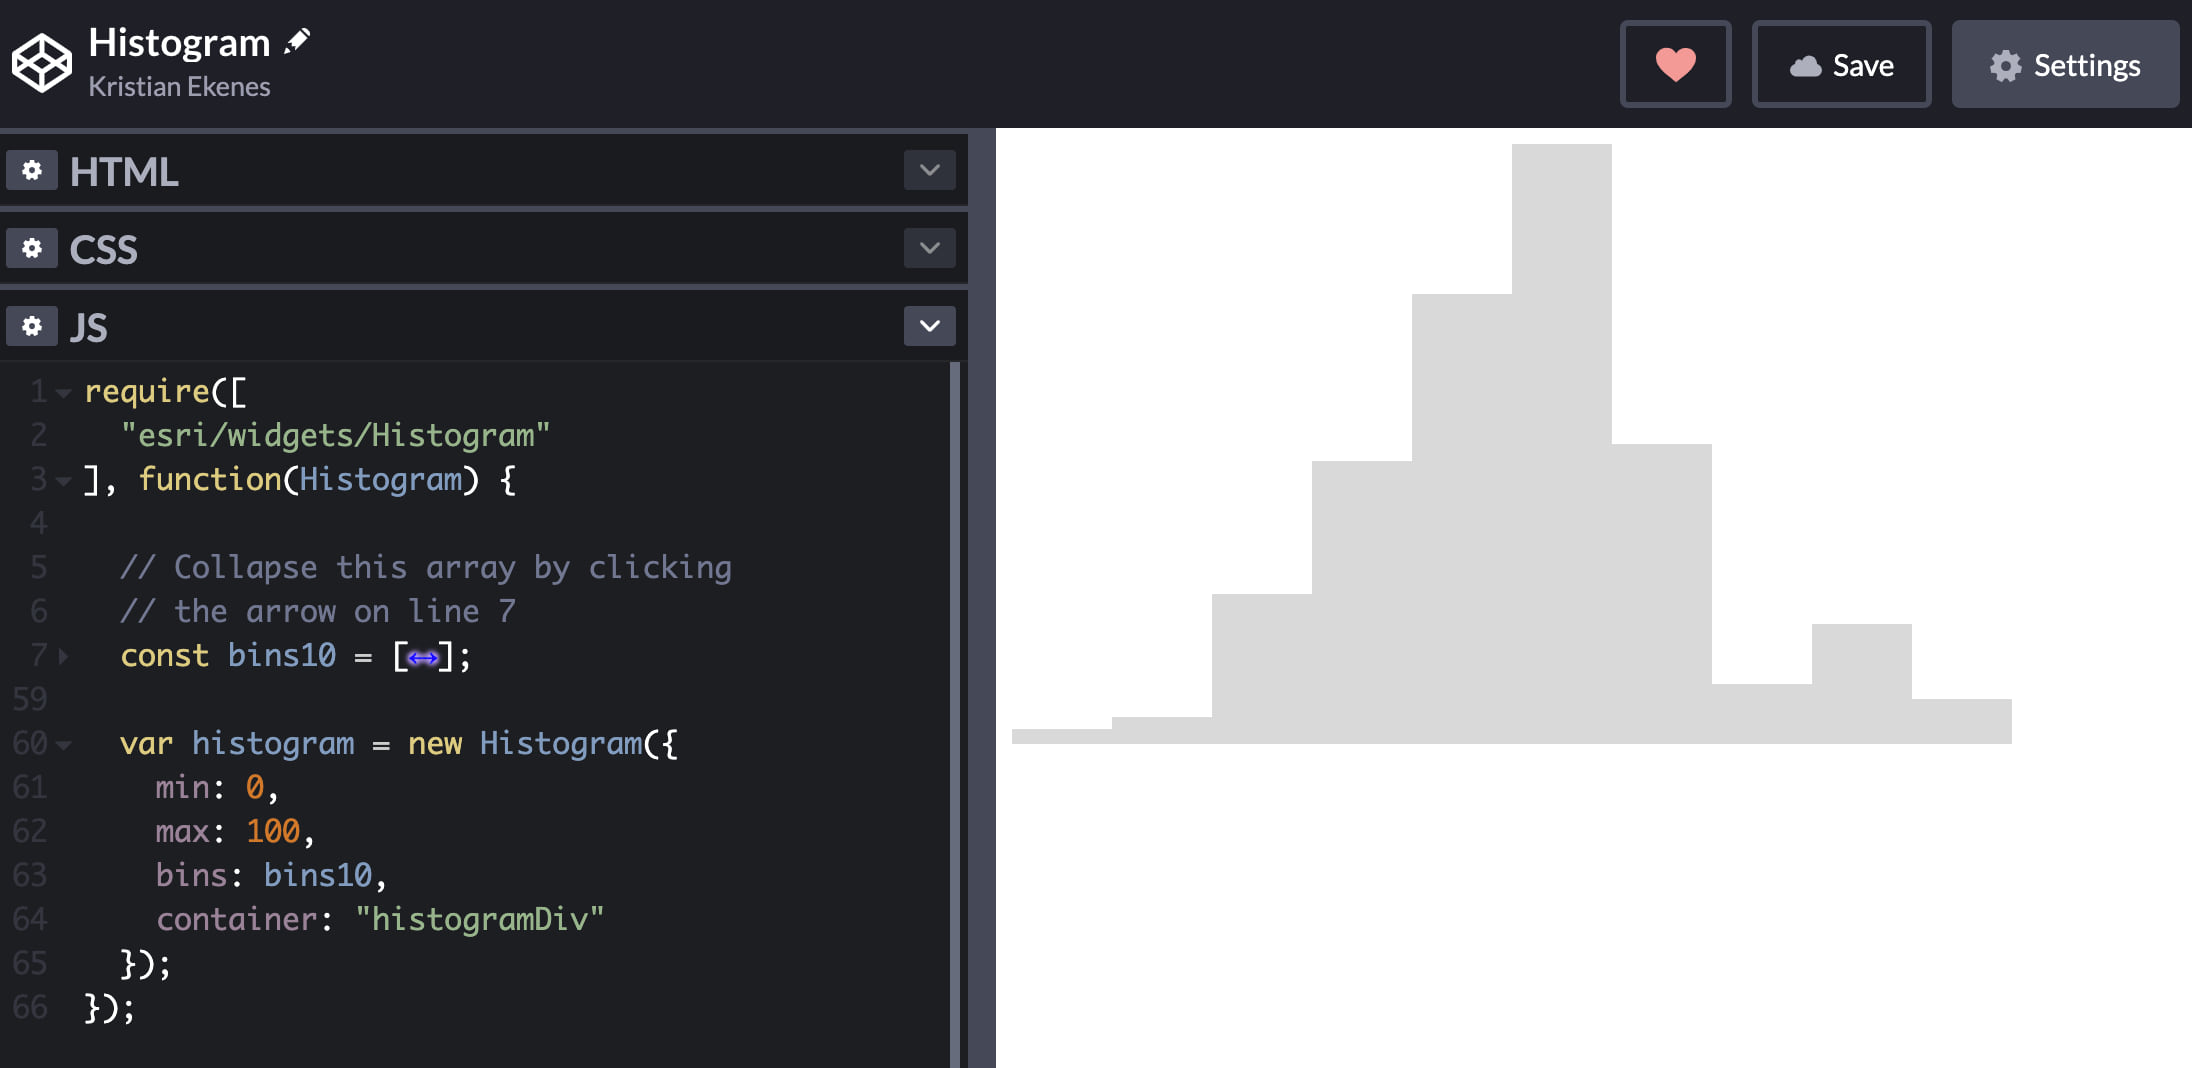
After seeing that code snippet, you may ask: Do I really have to manually specify all of those bins? What if I want a more detailed histogram with 100 bins?
The ArcGIS JS API has you covered.
You can take advantage of the histogram function for generating histograms based on a field value in a layer, or even the result of an Arcade expression.
That’s what the following app does.
histogram({
  layer: layer,
  field: "MEDHINC_CY",
  // an Arcade expression can also go here
  // in the valueExpression param
  numBins: 100
}).then(function(histogramResult){
  // convenience function on Histogram widget for
  // constructing the widget based on histogram result
  const histogramChart = Histogram.fromHistogramResult(histogramResult);
  histogramChart.container = "histogramDiv";
});

Add more context
Now histogram bins are rendered in the view! However, a histogram without labels is kind of like a map without a legend.? We can add more context to the histogram by adding an average line or any other data line to indicate meaningful values in the dataset.
// Add more context to your histogram with average
// and data lines
histogramChart.average = 85444;
histogramChart.dataLines = [{
  value: 25750,
  label: "Federal Poverty Line"
}];

// The labelFormatFunction allows you to customize
// the formatting of numeric values
histogramChart.labelFormatFunction = function (value) {
  return intl.formatNumber(value, {
    style: "currency",
    currency: "USD",
    currencyDisplay: "symbol",
    minimumFractionDigits: 0,
    maximumFractionDigits: 0
  });
};
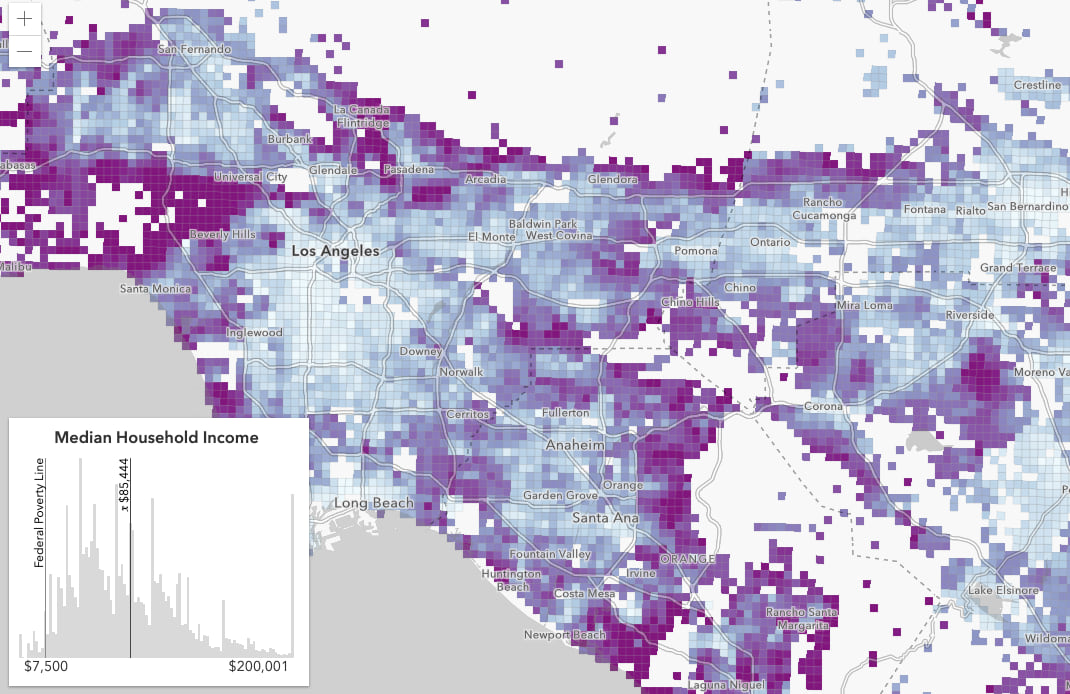
The Histogram doesn’t come with default labels. You can use the min and max values of the Histogram widget and display them below the histogram container to provide additional context to the user.
Color the bars to match the map
Now we have histogram bins with labels and data lines. But we still need a legend so the user can make sense of the colors in this map. Rather than take up more space with a legend, we can style the bars of the histogram to match our data.
The Histogram’s barCreatedFunction property allows us to do this. The barCreatedFunction is called each time a bar element is created. It takes a bar element as a parameter, allowing you to style it and add interaction to each bar with event handlers. This is particularly powerful for data exploration applications.
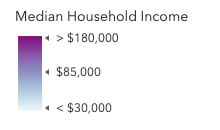
The renderer for the layer in the example above visualizes median household income using a color visual variable. The color variable defines a continuous color ramp, assigning colors to various data points (or stops) and interpolates colors for features whose values lie between the given stops. You can observe this color transition in the Legend widget.
Coloring the histogram to match the data (and effectively replacing the legend) takes a little extra work. Since each bin represents a range of data, I calculate the middle value of that range and use the Color.blendColors method to determine the color that value would be assigned for a given color visual variable. The following snippet uses this technique to set this color to bar element’s fill attribute.
// Color the histogram to match the features in the map
histogramChart.barCreatedFunction = function(index, element) {
  const bin = histogramChart.bins[index];
  const midValue = (bin.maxValue - bin.minValue) / 2 + bin.minValue;
  const color = getColorFromValue(vv.stops, midValue);
  element.setAttribute("fill", color.toHex());
};
That certainly makes the visual more interesting for the end user. The following function determines how a color is inferred for a given value in a histogram bin.
// infers the color for a given var
// based on the stops from a ColorVariable
function getColorForValue(stops, value) {
  let minStop = stops[0];
  let maxStop = stops[stops.length - 1];

  const minStopValue = minStop.value;
  const maxStopValue = maxStop.value;

  if (value < minStopValue) {
    return minStop.color;
  }

  if (value > maxStopValue) {
    return maxStop.color;
  }

  const exactMatches = stops.filter(function(stop) {
    return stop.value === value;
  });

  if (exactMatches.length > 0) {
    return exactMatches[0].color;
  }

  minStop = null;
  maxStop = null;
  stops.forEach(function(stop, i) {
    if (!minStop && !maxStop && stop.value >= value) {
      minStop = stops[i - 1];
      maxStop = stop;
    }
  });

  const weightedPosition =
    (value - minStop.value) / (maxStop.value - minStop.value);

  // esri/Color
  return Color.blendColors(
    minStop.color,
    maxStop.color,
    weightedPosition
  );
}
Add interaction to the Histogram
Once you have access to the histogram bar elements, you can do a lot more to add interactivity to the visualization.
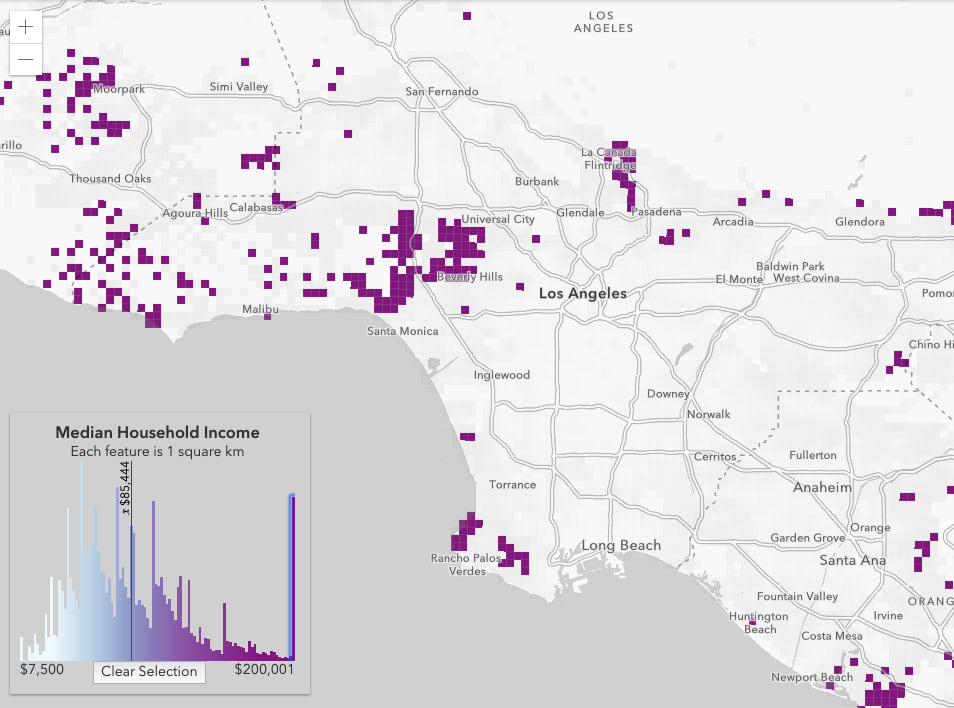
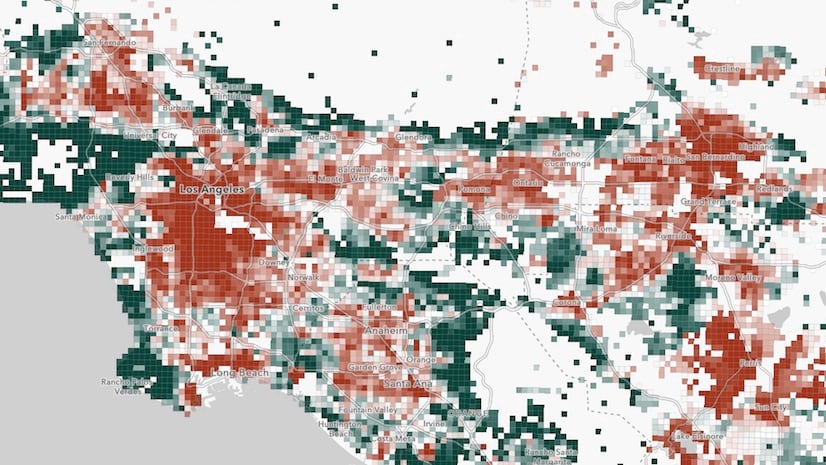
It’s natural for users to ask which features on the map fall within specific histogram bins. You can provide this capability to your users by adding event listeners to the bar elements.
In the example below, I added an event listener to each bar so that when focused, only the features that pertain to the corresponding data bin are displayed in the map.
// Color the histogram to match the features in the map
histogramChart.barCreatedFunction = function(index, element) {
  // code for styling each element goes here

  element.addEventListener("focus", function() {
    const { minValue, maxValue } = bin;

    // When a bar is focused, filter the layer view
    // by setting low opacity on the features
    // excluded by the filter
    const query = layerView.layer.createQuery();
    query.where = `${field} >= ${minValue} AND ${field} <= ${maxValue}`;
    layerView.queryObjectIds(query).then(function(ids) {
      layerView.effect = {
        filter: {
          objectIds: ids
        },
        excludedEffect: "grayscale(100%) opacity(5%)"
      };
    });
  });
};
Click the image below to try it yourself and see the code in context.
You can take the interaction a step further by adding a data line to the histogram each time the user clicks a feature. This is one way of several ways to communicate a feature’s value when the feature’s color is hard to compare with the colors of the histogram.
let highlightHandle;

view.on("click", function(event){
  view.hitTest(event).then(function(hitResponse){
    if(highlightHandle){
      highlightHandle.remove();
      highlightHandle = null;
    }
    const graphicHit = hitResponse.results.length;
    if(!graphicHit){
      console.log("no hit");
      return;
    }
    // If the click hits one of the layer's features
    // in the view, then add the value of the feature's
    // field (the one used to generate the histogram)
    // as a data line to the Histogram widget
    const matchingHit = hitResponse.results.find(function(hit){
      return hit.graphic.layer.title === layer.title;
    });
    if(matchingHit){
      const graphic = matchingHit.graphic;
      const avgIncome = graphic.attributes[field];
      histogramChart.dataLines = [{
        value: avgIncome,
        label: formatValueToCurrency(avgIncome)
      }];
      highlightHandle = layerView.highlight(graphic);
    } else {
      histogramChart.dataLines = null;
    }
  })
});
Click the following image to try it yourself.

More examples
Removing the Legend in favor of a colored histogram doesn’t work for all scenarios. It tends to work well only for layers rendered based on a single numeric value using color. That excludes anything involving more than one visual variable, UniqueValueRenderer, HeatmapRenderer, and DotDensityRenderer. It can also feel a little strange when working with aggregated data because each value in the data doesn’t represent a single observation or data point.
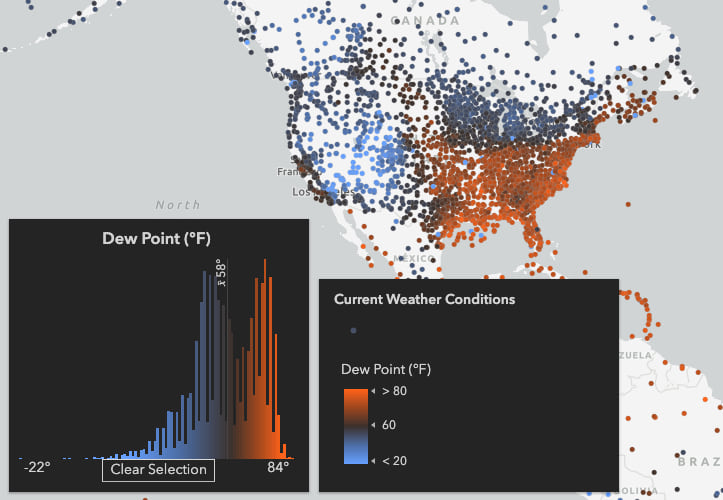
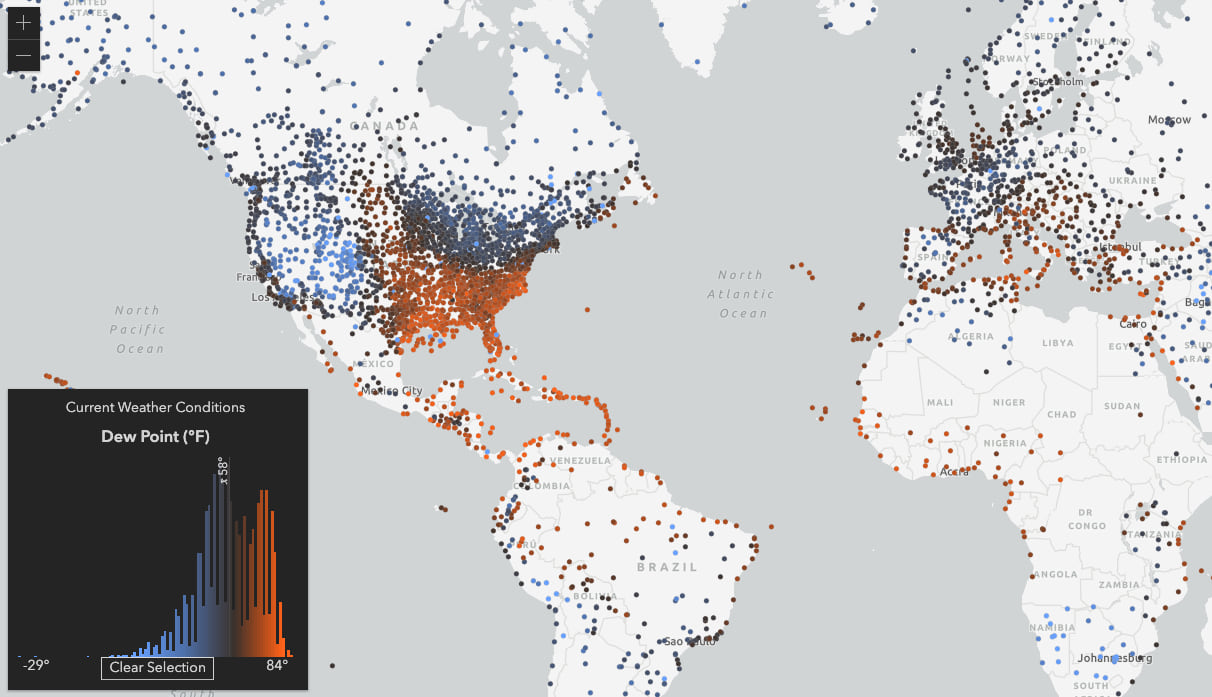
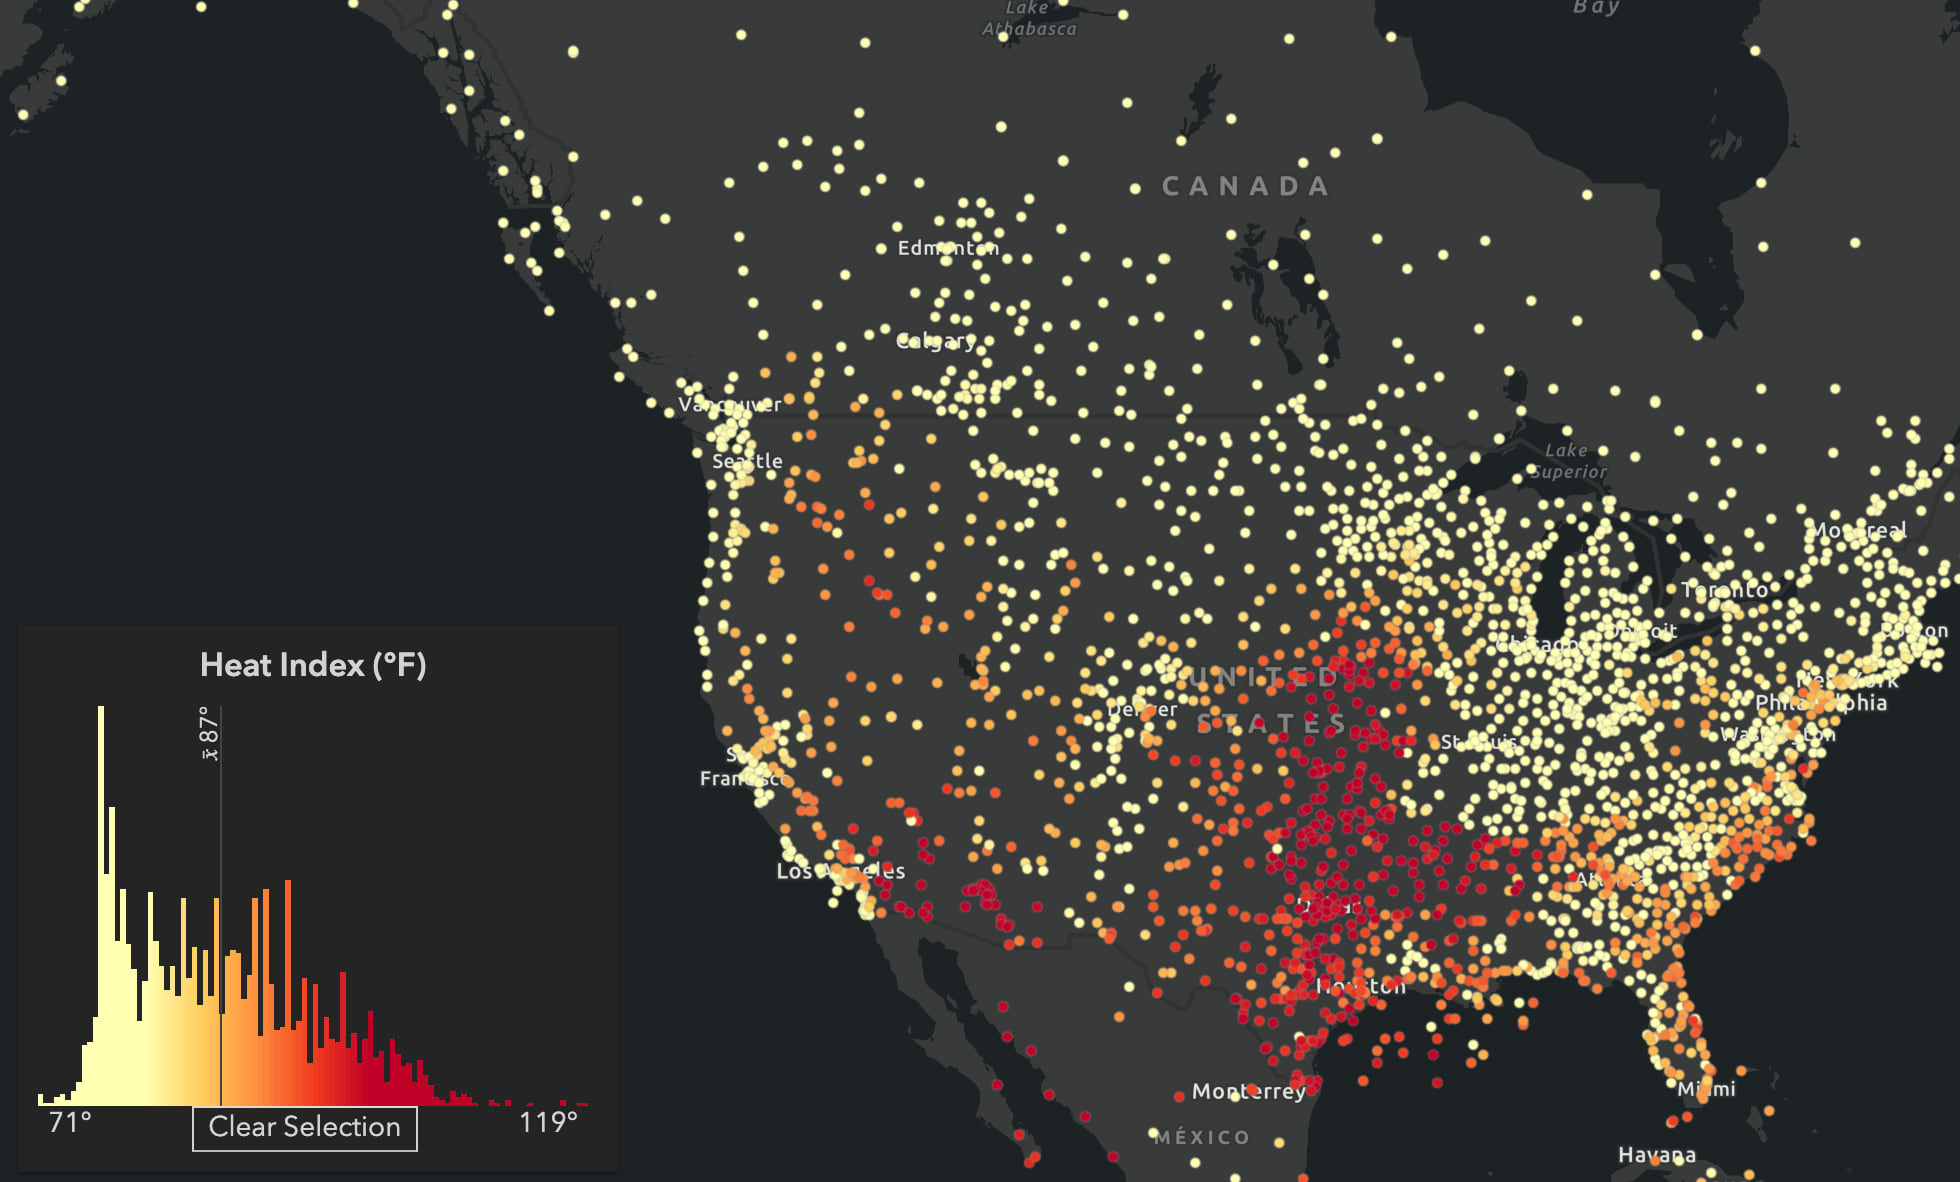
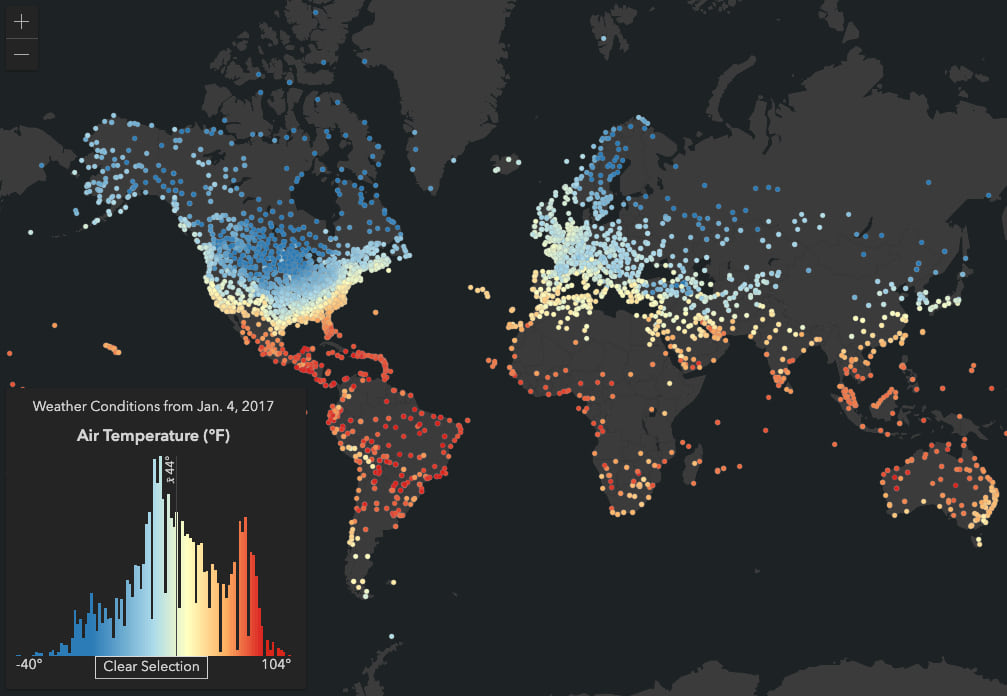
However, histograms tend to work well with scientific data. Check out the following examples which take advantage of the Current Weather and Wind Station Information live data feed in the ArcGIS Living Atlas of the World.
The following apps have all the same capabilities described in this post. You can try each app and modify the code by clicking on each image below.
Dew Point
Heat Index
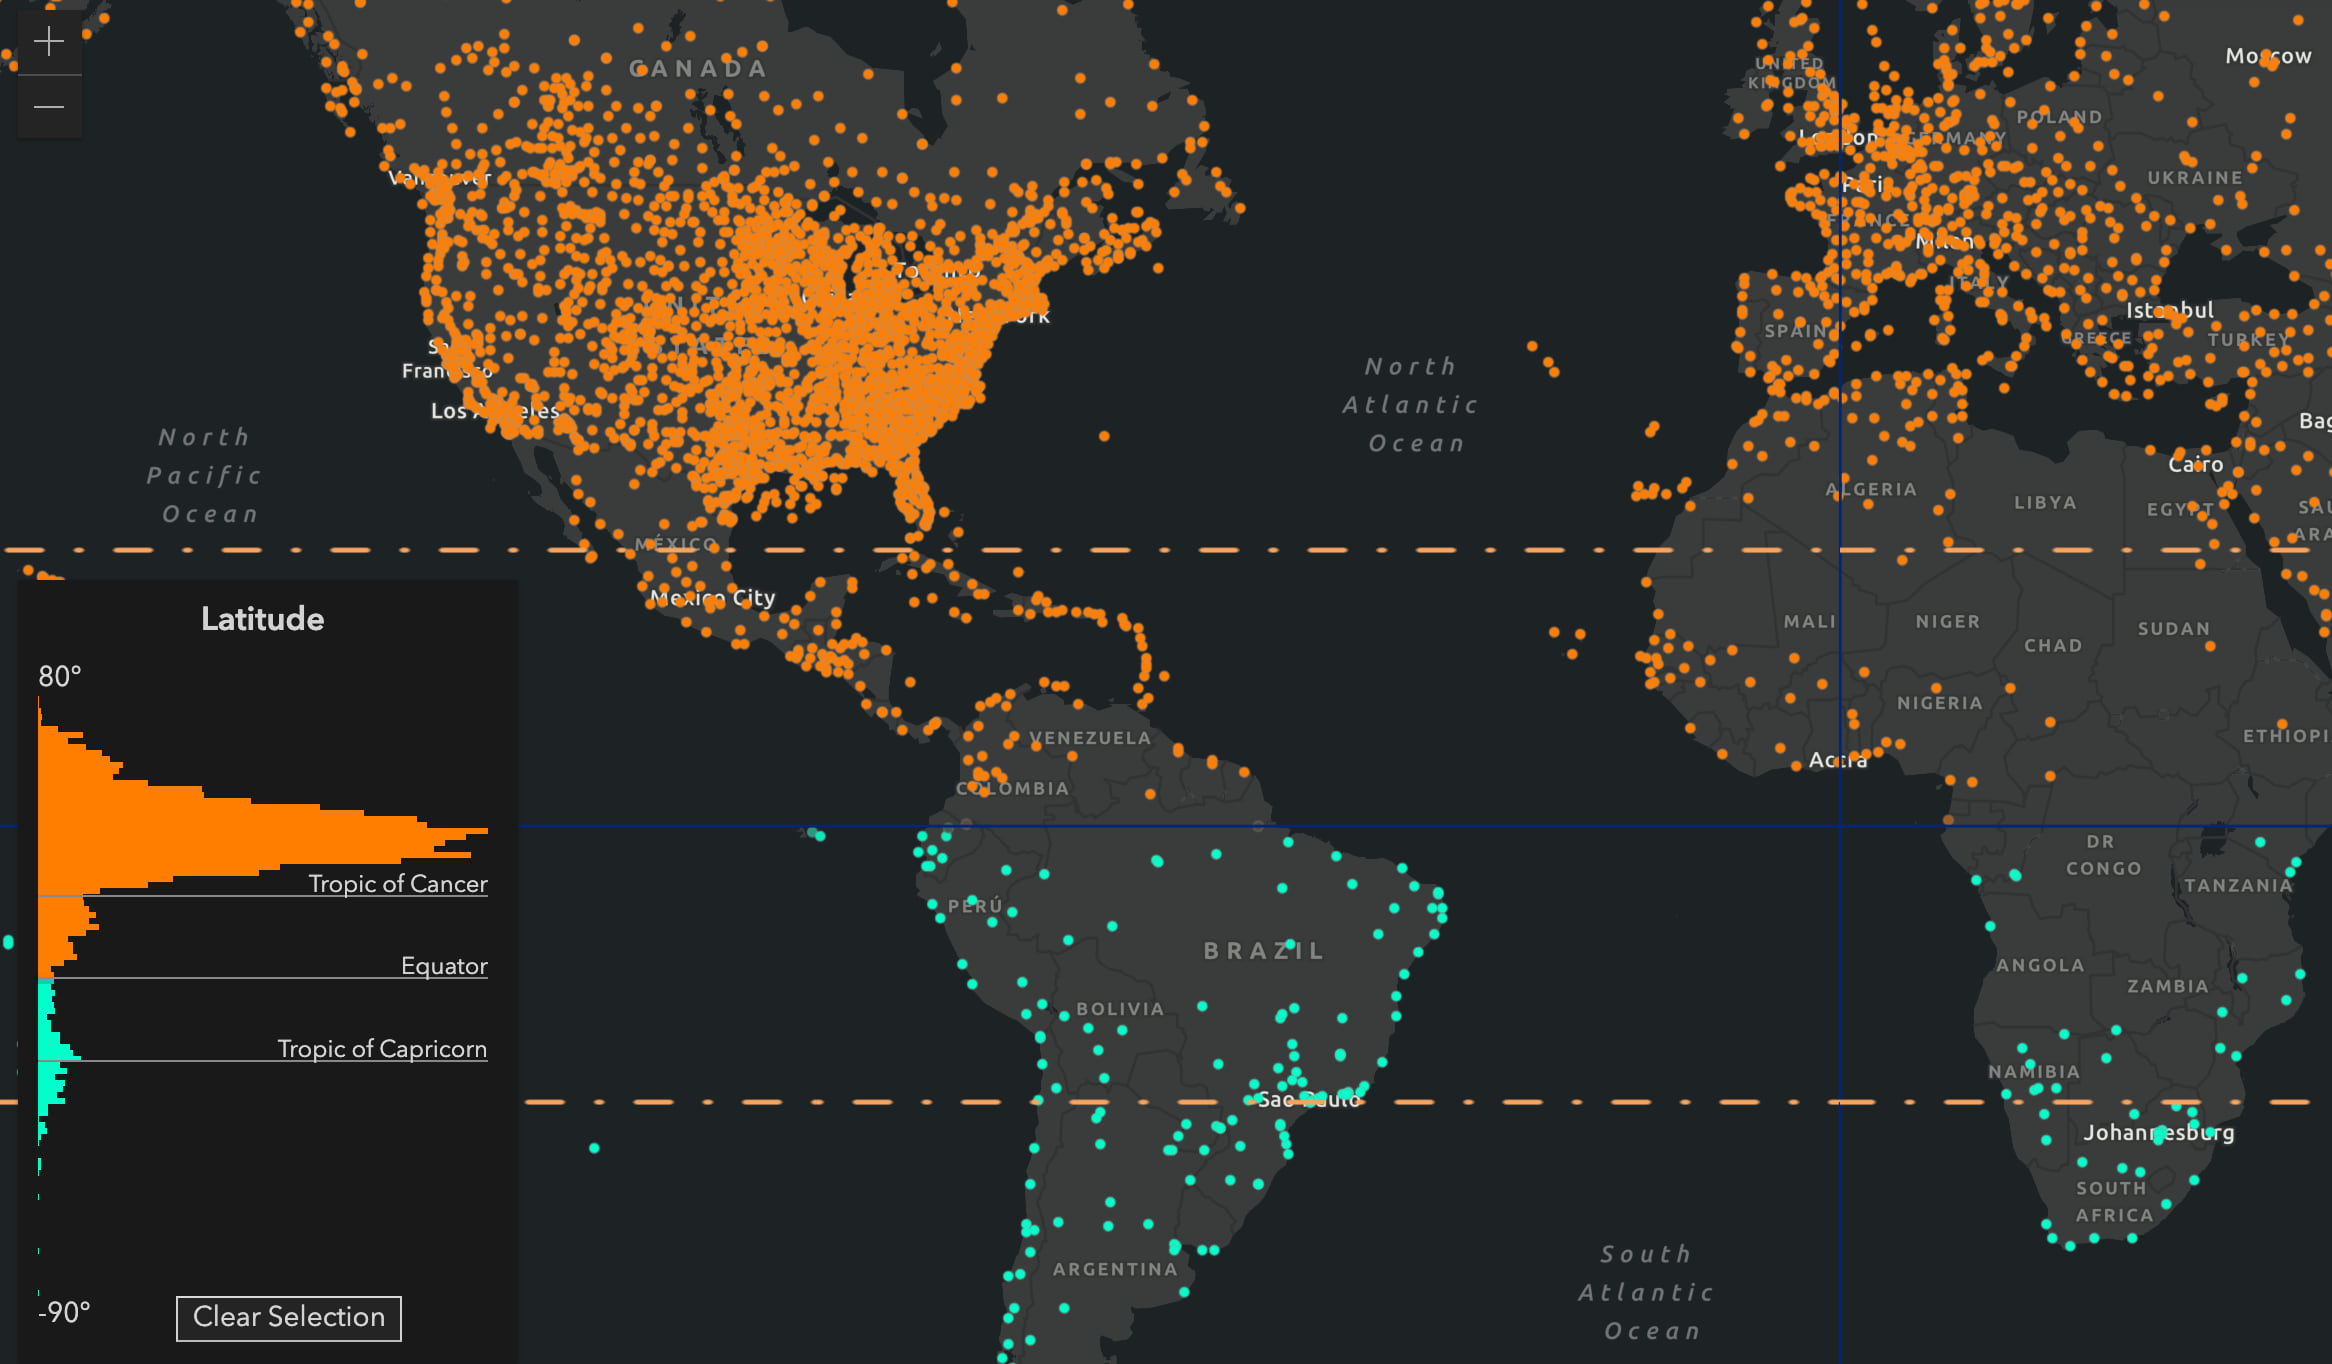
Latitude
Why would you ever want to show latitude in a histogram? Aside from the fact that this is a great way to demonstrate the vertical layout option, you could use a histogram of the data’s coordinates to see if there is any spatial bias in the visualization. Since this dataset tells a story about global weather, it may be worth noting that most of the data points are biased toward the northern hemisphere. That may be OK considering there is more land area in the north. ?♂️
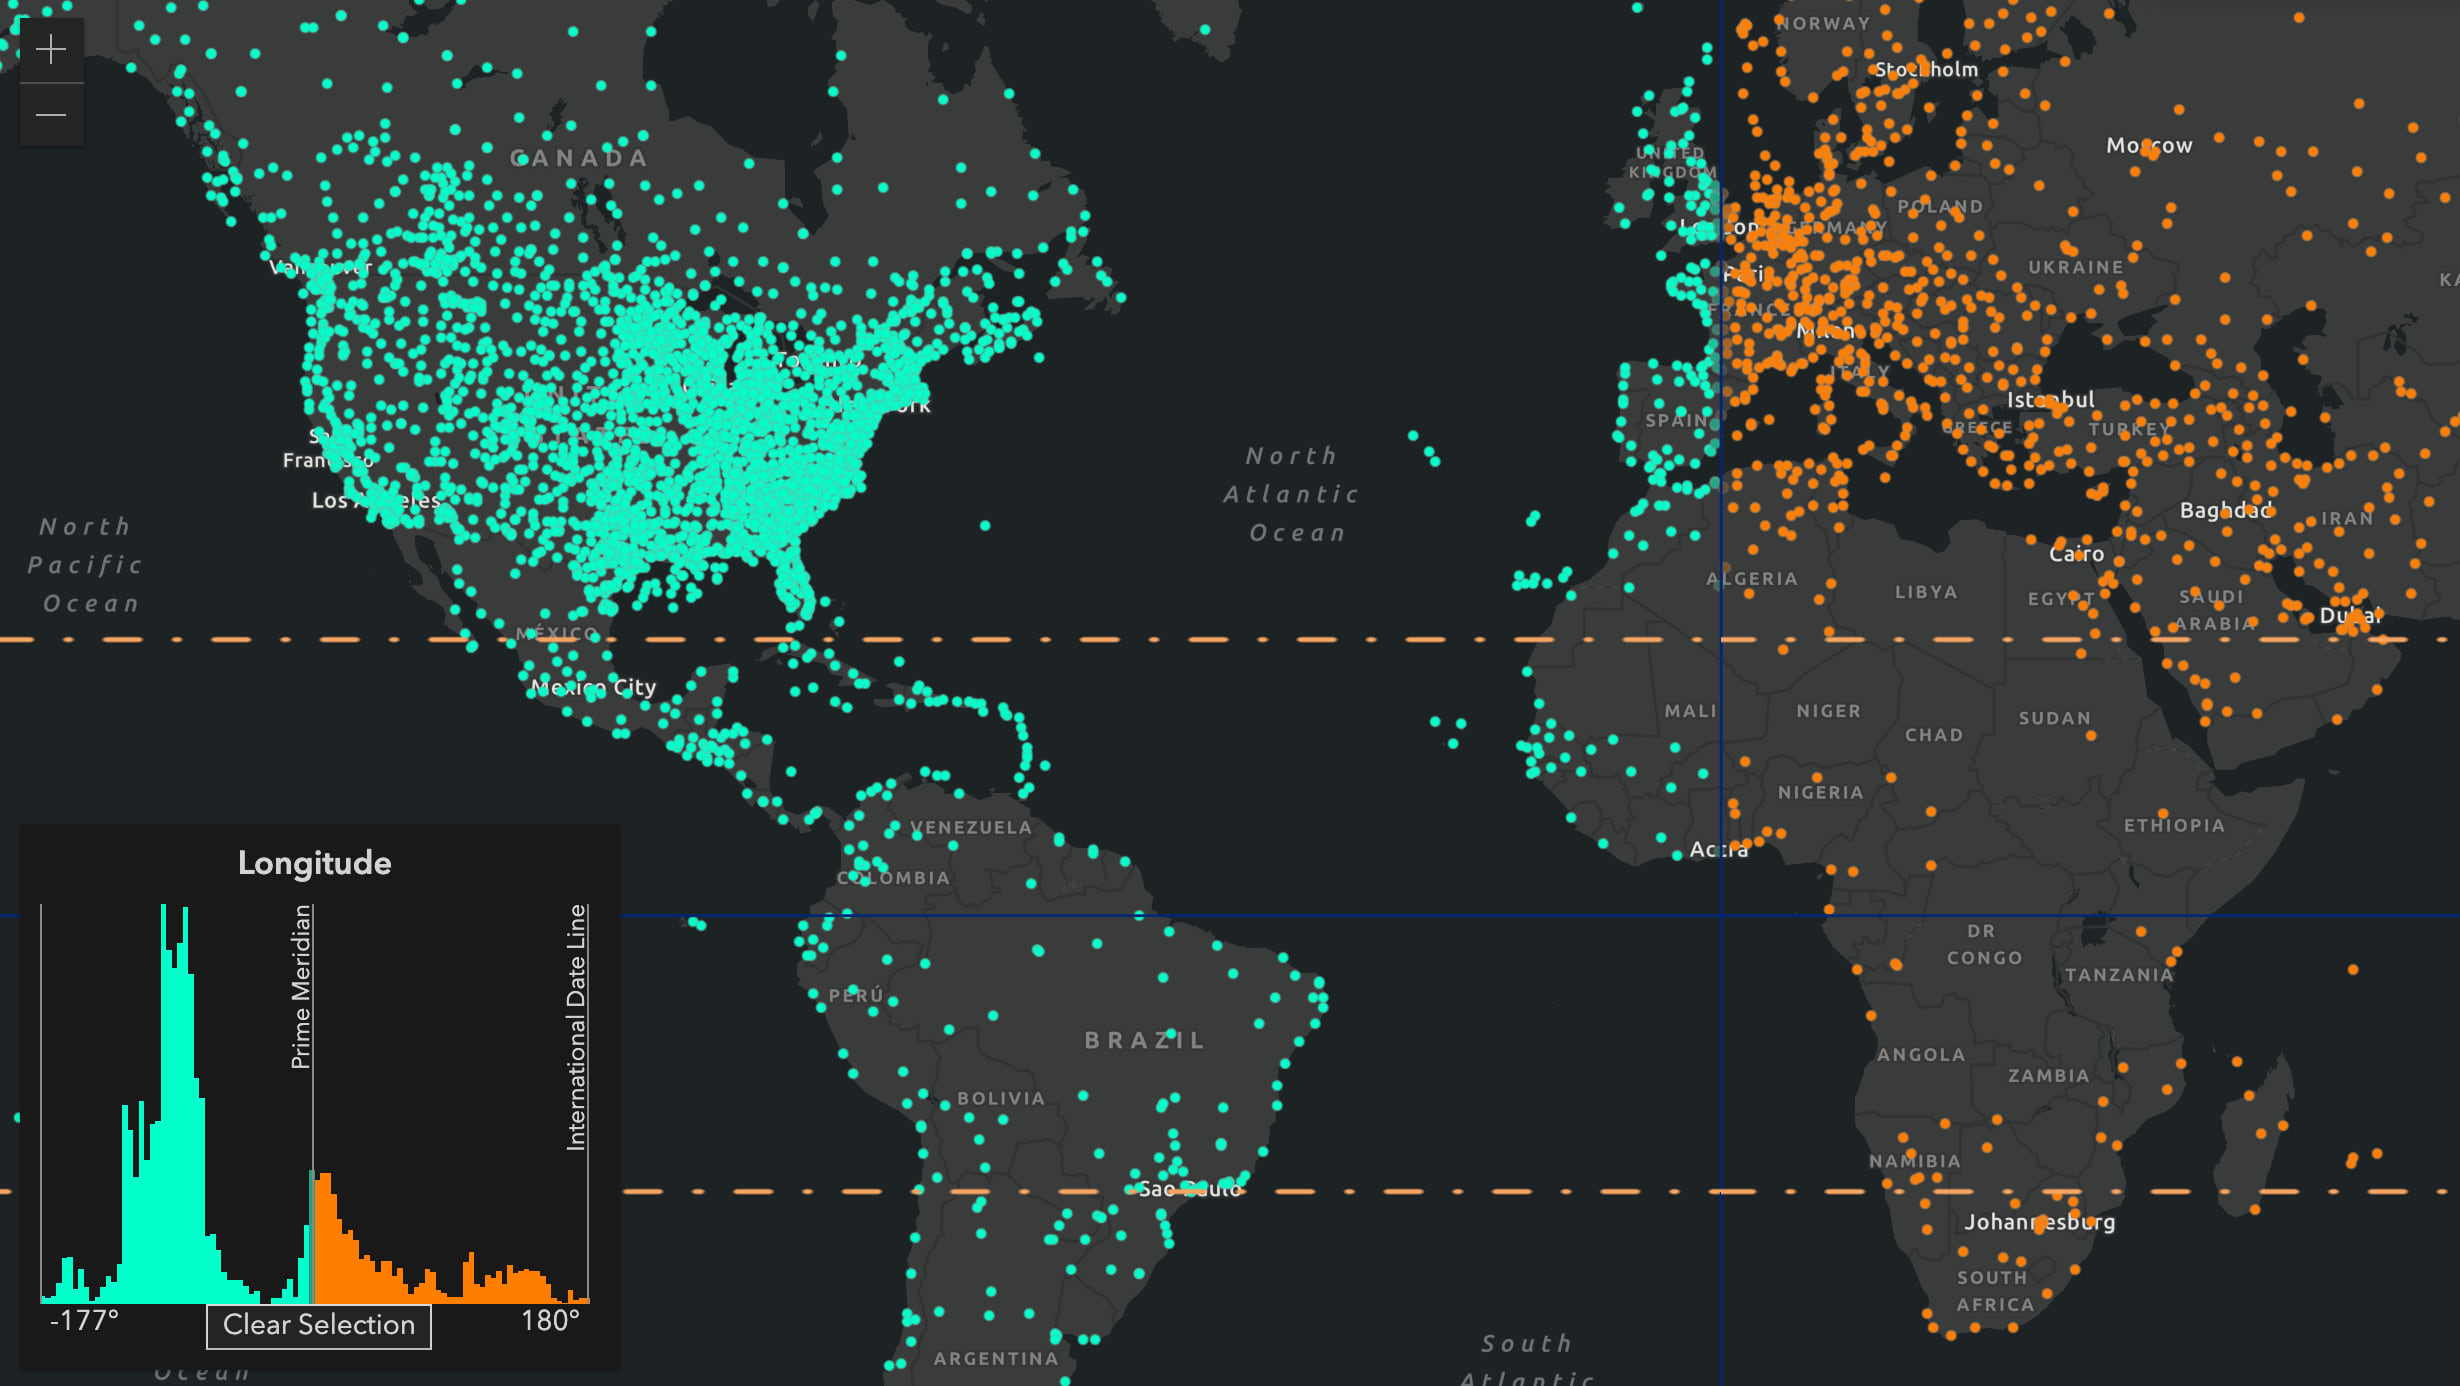
Longitude
The more-land-in-the-north-than-the-south argument may be an acceptable response to north-south sample location bias, but this histogram shows there is a distinct bias for weather station locations in the west.
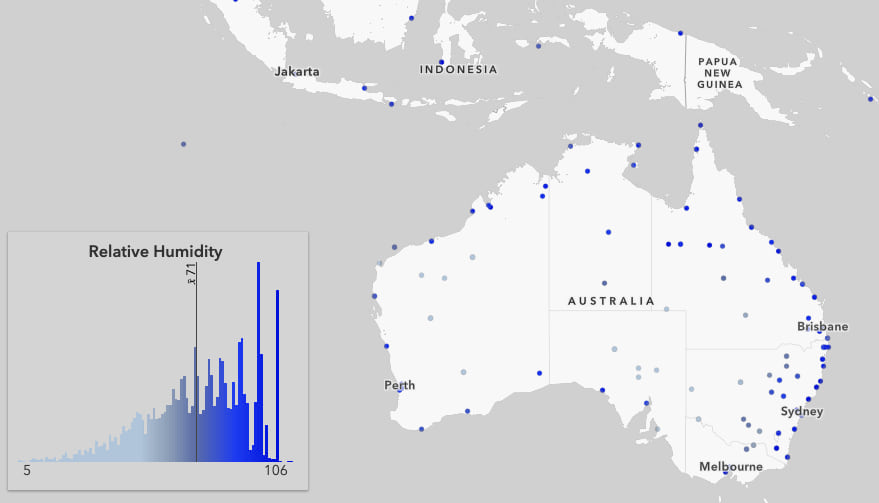
Humidity
Air Temperature
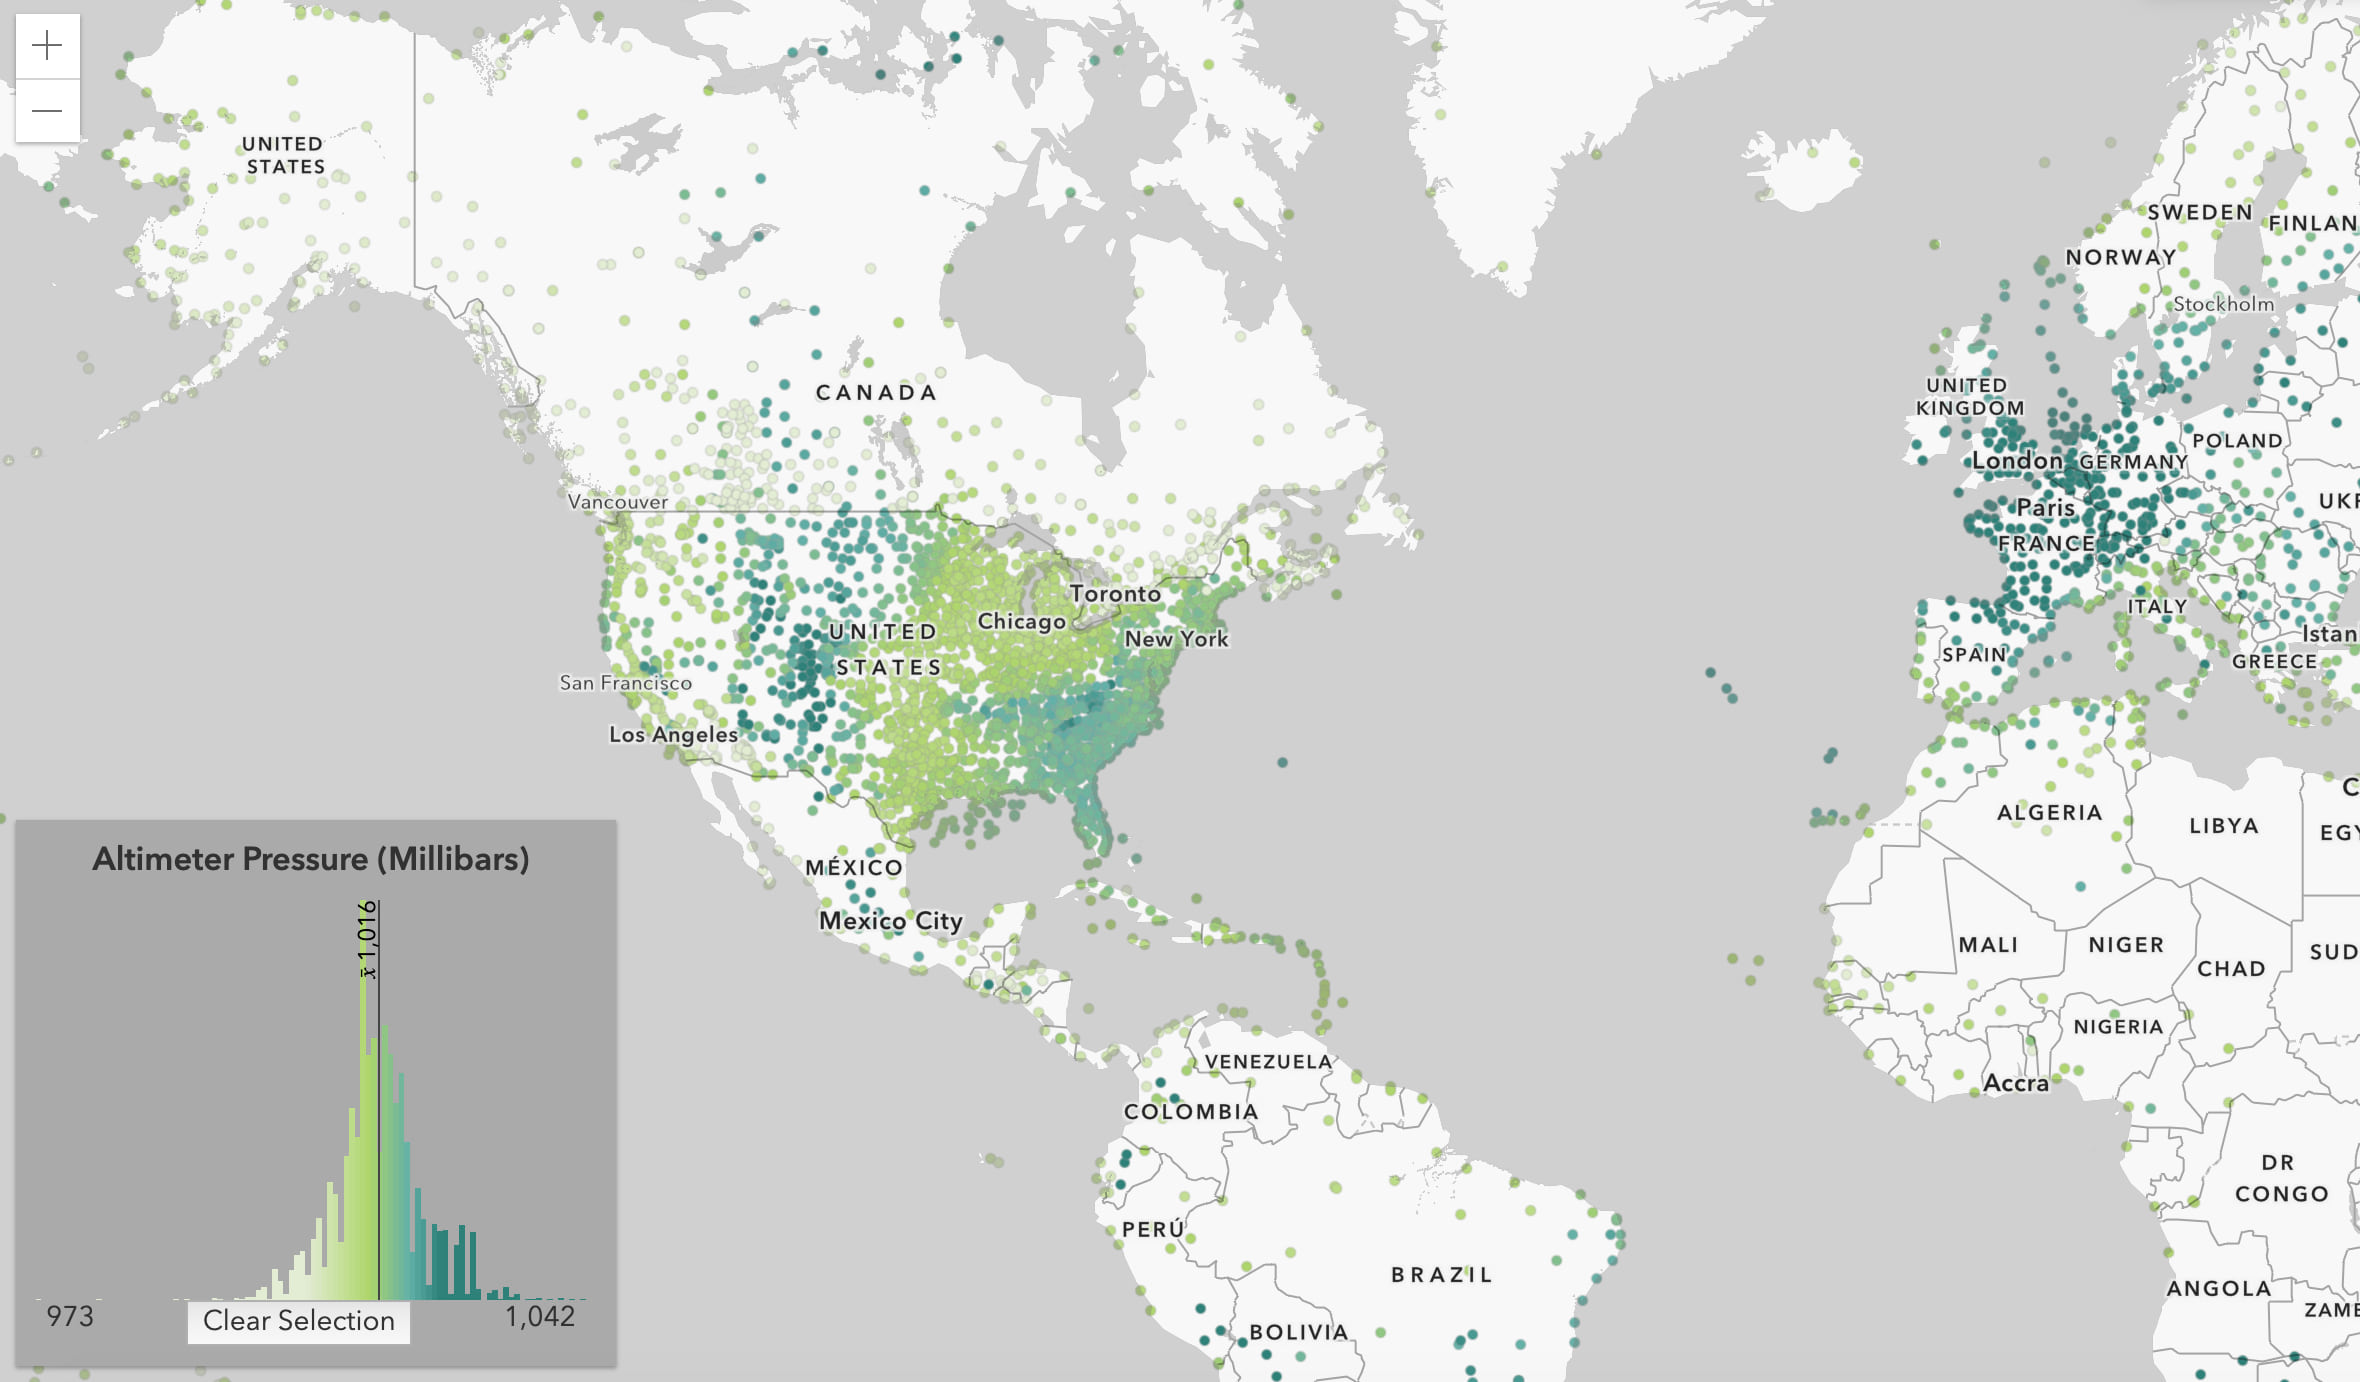
Altimeter Pressure
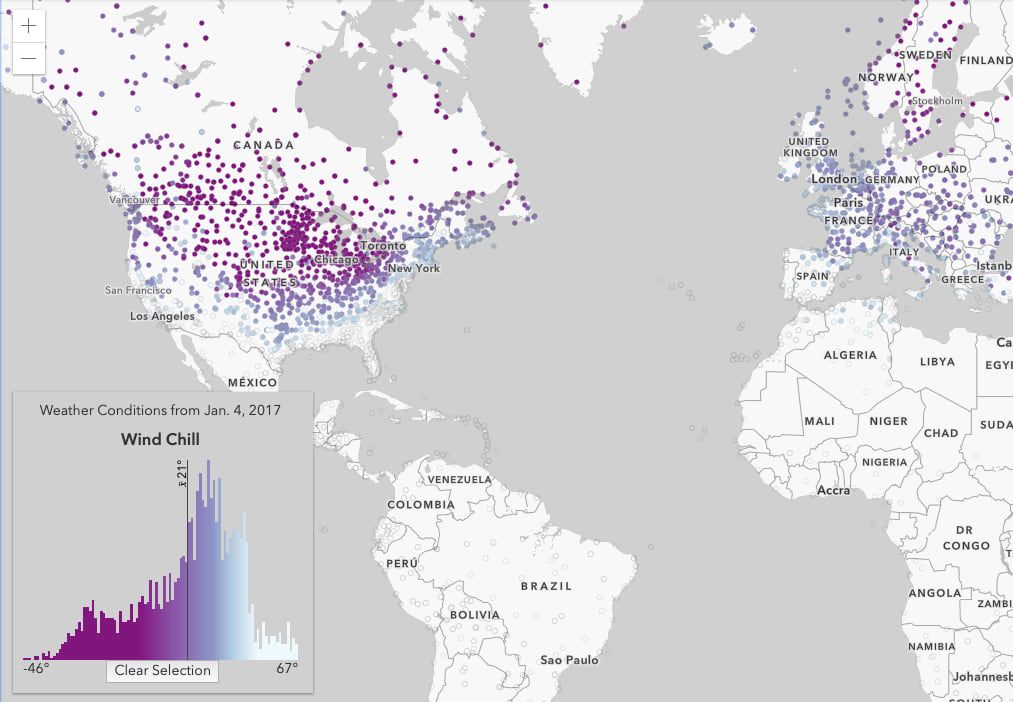
Wind Chill
Try it yourself!
Thanks to the Histogram widget, you have another option for communicating a story with your data. I invite you to try it out in your own apps and share them with me on Twitter!


Commenting is not enabled for this article.